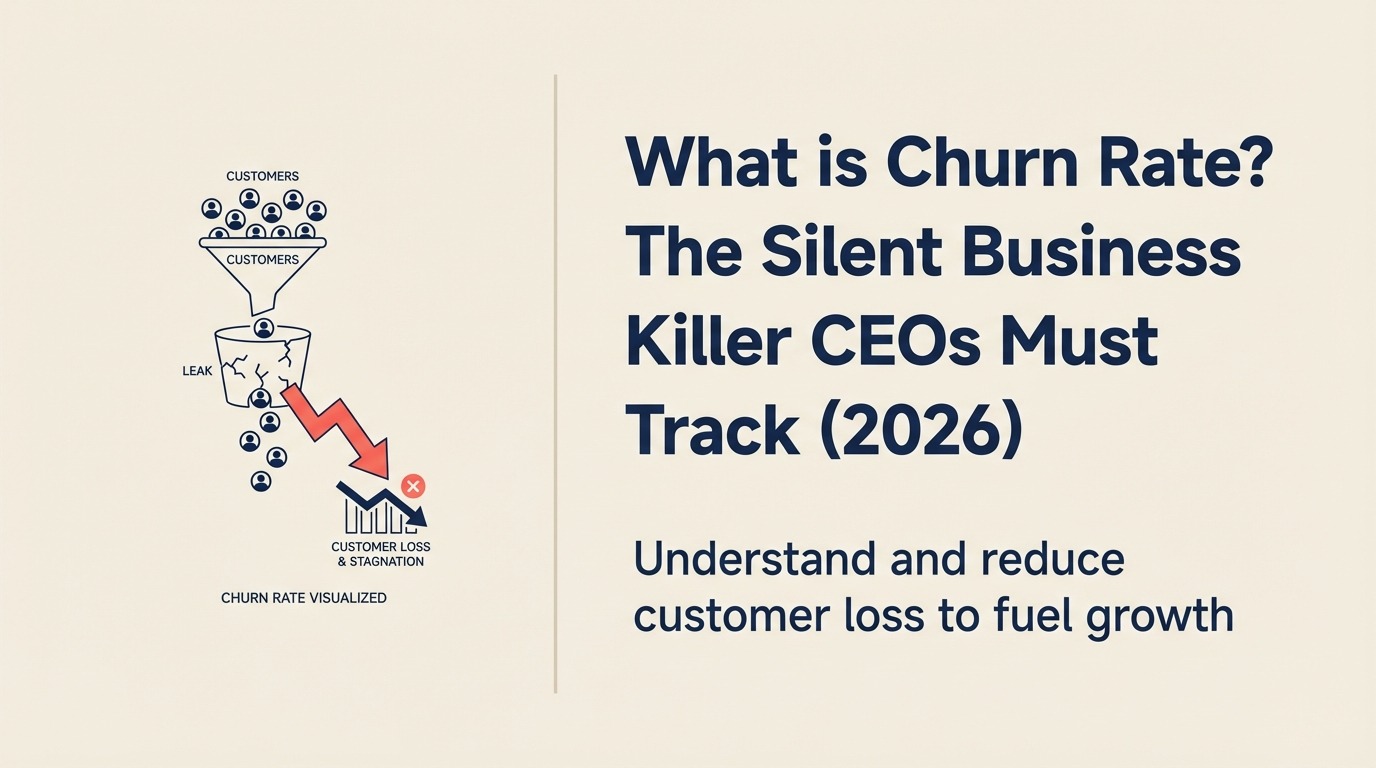
What is Churn Rate? The Leaky Bucket Destroying Your Growth
Turn this article into takeaways for your work.


Each assistant summarizes the article only for you and suggests best practices for your work.
A SaaS company celebrated adding 1,000 new customers last month. The CEO was thrilled. What he didn't mention? They lost 1,100 existing customers. Net growth: -100.
This is churn. And it's killing more businesses than competition ever will.
Churn Rate: The Brutal Truth
Churn Rate = (Customers Lost ÷ Total Customers) × 100
Simple math, devastating impact:
- 5% monthly churn = 46% gone in a year
- 10% monthly churn = 72% gone in a year
- 15% monthly churn = 86% gone in a year
At 15% monthly churn, you're essentially rebuilding your entire customer base every year. Good luck scaling that.
The Two Types Every CEO Must Track
Customer Churn
Formula: (Customers lost ÷ Starting customers) × 100
Example:
- Start of month: 1,000 customers
- Lost: 50 customers
- Churn: 5%
Revenue Churn (The Hidden Danger)
Formula: (MRR lost ÷ Starting MRR) × 100
Plot twist: You can have negative revenue churn
- Lose 5% of customers
- But remaining customers upgrade
- Net revenue grows despite customer loss
This is the holy grail of SaaS.
Churn Benchmarks by Industry (2026)
B2B SaaS
- Enterprise: 5-10% annually (excellent)
- Mid-market: 15-25% annually (good)
- SMB: 30-50% annually (average)
- Monthly targets: <2% (sustainable)
E-commerce
- Subscription boxes: 5-7% monthly
- Replenishment: 10-15% monthly
- Digital products: 3-5% monthly
Consumer Apps
- Dating apps: 70-80% in 90 days
- Fitness apps: 60-70% in 90 days
- Productivity: 40-50% in 90 days
Professional Services
- Agencies: 10-20% annually
- Consultants: 15-25% annually
- Accountants: 5-10% annually
The True Cost of Churn
Let's do the math most CEOs avoid:
Scenario: 1,000 customers, $100/month average, 10% monthly churn
Year 1 Impact:
- Customers lost: 718
- Revenue lost: $430,800
- Replacement cost (CAC $500): $359,000
- Total damage: $789,800
5-Year Impact: Over $2 million lost to a "small" 10% churn.
But wait, it gets worse...
The Compound Effect Nobody Talks About
High churn doesn't just hurt revenue. It destroys everything:
- CAC Payback: Need 3x longer to profit
- Team Morale: Sales feels pointless
- Product Development: Building for ghosts
- Fundraising: Investors run away
- Company Value: Multiples collapse
One founder told me: "Churn doesn't just kill growth. It kills hope."
Why Customers Really Leave
Forget the exit surveys. Here's what actually drives churn:
The Big Three (60% of churn)
- Didn't see value quickly enough (40%)
- Found alternative solution (15%)
- Budget/economic reasons (5%)
The Hidden Killers (40% of churn)
- Poor onboarding experience
- Lack of engagement
- Technical issues
- Better competitor offer
- Company went out of business
The shocking truth? Most churn is preventable.
Early Warning Signs
Spot these before it's too late:
Usage Indicators:
- Login frequency dropping
- Feature adoption stalling
- Support tickets decreasing (yes, decreasing)
- Integration disconnections
Behavioral Signals:
- Skipping check-in calls
- Ignoring product updates
- Payment method failures
- Decision maker changes
The Magic Number: If usage drops 40% month-over-month, 87% chance they'll churn within 90 days.
The Churn Reduction Playbook
Churn reduction works as a staged operating system, moving from immediate saves to onboarding, embedded value, prediction, and shared ownership.
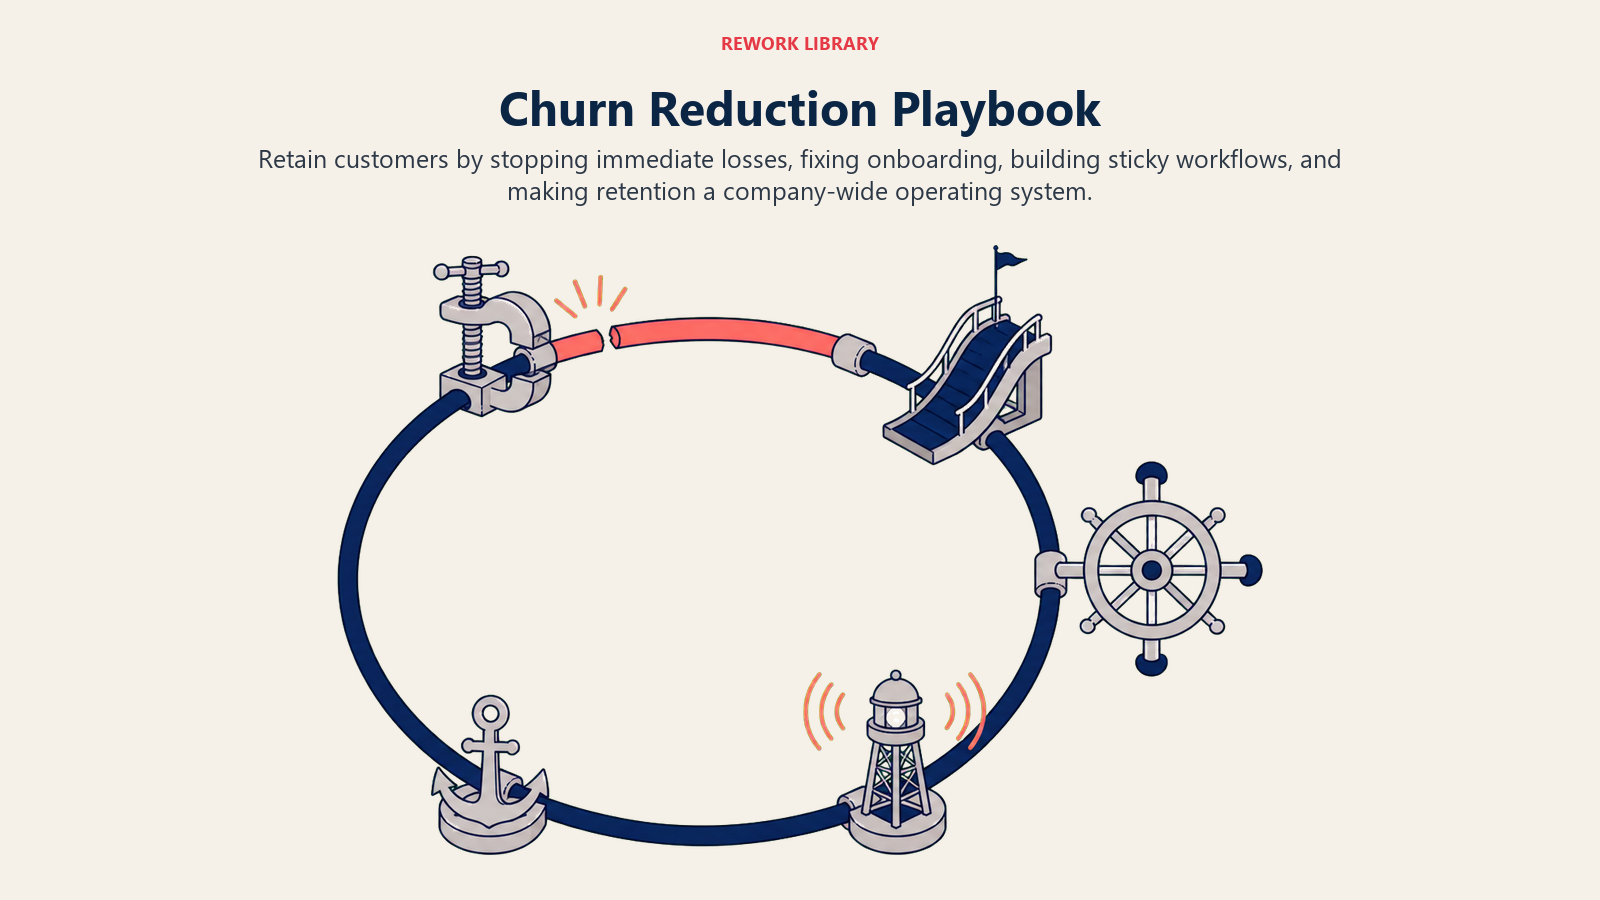
Week 1: Stop the Bleeding
- Call every cancellation - 20% will stay with a conversation
- Offer pause instead of cancel - 30% will return
- Exit interview incentive - $50 gift card for 15-minute call
- Win-back email sequence - 10-15% recovery rate
Month 1: Fix Onboarding
- Day 1 success - One valuable outcome in first session
- Week 1 habit - Daily active use target
- Week 2 expansion - Introduce second use case
- Week 4 check-in - Proactive success call
Companies with great onboarding have 50% lower churn.
Quarter 1: Build Sticky Features
- Switching costs - Data they'd lose by leaving
- Network effects - Value from other users
- Integrations - Deep workflow embedding
- Customization - Personalized setup
Year 1: Transform the Business
- Success metrics - Track value delivery
- Cohort analysis - Understand patterns
- Predictive models - Intervene early
- Cultural shift - Everyone owns retention
Technology Stack for Churn Prevention
Analytics
- Amplitude/Mixpanel - Behavior tracking
- ProfitWell - Subscription analytics
- ChurnZero - Customer success platform
Engagement
- Intercom - Proactive messaging
- Pendo - In-app guidance
- Customer.io - Lifecycle campaigns
Prediction
- Gainsight - Health scoring
- Totango - Churn prediction
- Internal models - Custom algorithms
The Negative Churn Masterclass
Best-in-class companies achieve negative net revenue churn:
How Slack Does It:
- Land: Free team starts small
- Expand: More users join (viral)
- Upgrade: Hit paid tier limits
- Grow: Add more teams
- Result: 140% net revenue retention
Your Path to Negative Churn:
- Seat expansion - Grow within accounts
- Usage tiers - Natural upgrade path
- Feature add-ons - Modular pricing
- Cross-sell - Related products
Churn Rate vs Growth Rate
The brutal math:
- 5% monthly growth + 10% churn = -5% net growth
- 20% monthly growth + 15% churn = 5% net growth
- 10% monthly growth + 3% churn = 7% net growth
Reducing churn by 1% often easier than increasing growth by 3%.
Your 90-Day Churn Reduction Plan
Days 1-30: Measure and Understand
- Calculate exact churn (customer and revenue)
- Cohort analysis by segment
- Interview 20 churned customers
- Identify top 3 churn reasons
Days 31-60: Quick Wins
- Fix onboarding gaps
- Launch win-back campaign
- Implement usage alerts
- Create saves team
Days 61-90: Systematic Improvement
- Predictive model development
- Success team training
- Product roadmap alignment
- Pricing/packaging optimization
Target: 25% churn reduction in 90 days (achievable for most).
The Psychology of Retention
Why customers stay isn't the opposite of why they leave:
Why they leave: Frustration, better option, budget Why they stay: Habit, results, relationships
Build for staying, not just against leaving.
Your Action Items
Churn is not a customer success problem. It's a company problem.
Today:
- Calculate your actual churn rate
- Compare to benchmarks above
- Call 3 recently churned customers
This Week:
- Analyze churn by cohort
- Map customer journey
- Identify biggest drop-off
This Month:
- Launch one retention initiative
- Set up churn alerts
- Create retention dashboard
Remember: Acquiring a new customer costs 5-25x more than keeping an existing one. Every 1% improvement in churn can increase your company value by 12%.
Fix your leaky bucket before pouring in more water.
Ready to master retention? Explore Customer Success strategies or dive into Net Revenue Retention for growth through expansion.
Part of the [Business Terms Collection]. Last updated: 2026-07-21
On this page
- Churn Rate: The Brutal Truth
- The Two Types Every CEO Must Track
- Customer Churn
- Revenue Churn (The Hidden Danger)
- Churn Benchmarks by Industry (2026)
- The True Cost of Churn
- The Compound Effect Nobody Talks About
- Why Customers Really Leave
- The Big Three (60% of churn)
- The Hidden Killers (40% of churn)
- Early Warning Signs
- The Churn Reduction Playbook
- Week 1: Stop the Bleeding
- Month 1: Fix Onboarding
- Quarter 1: Build Sticky Features
- Year 1: Transform the Business
- Technology Stack for Churn Prevention
- Analytics
- Engagement
- Prediction
- The Negative Churn Masterclass
- Churn Rate vs Growth Rate
- Your 90-Day Churn Reduction Plan
- The Psychology of Retention
- Your Action Items