What is P&L? The One Page That Tells Your Entire Business Story
Turn this article into takeaways for your work.
Each assistant summarizes the article only for you and suggests best practices for your work.
Every month, I ask CEOs to show me their P&L. Half fumble around. The other half show me a 47-page report their CFO created. Both are wrong.
Your P&L (Profit & Loss statement) is your business scorecard. If you can't read it in 30 seconds and know exactly how you're doing, you're flying blind.
P&L: Your Business X-Ray
A Profit & Loss statement shows your revenues, costs, and profits over a specific period.
Think of it as your business health report:
- Revenue: Money coming in (your offense)
- Expenses: Money going out (your defense)
- Profit/Loss: What's left (your score)
Simple? Yes. But most CEOs read it wrong.
The P&L Structure That Matters
Forget accounting textbooks. Here's what actually matters:
The Top Line (Revenue)
Gross Revenue         $1,000,000
- Returns/Refunds       ($50,000)
= Net Revenue          $950,000
What to watch: Growth rate, not just total
The Middle (Margins)
Net Revenue            $950,000
- Cost of Goods Sold   ($380,000)
= Gross Profit         $570,000 (60%)

Gross Profit           $570,000
- Operating Expenses   ($470,000)
= Operating Profit     $100,000 (10.5%)
What to watch: Percentages, not just dollars
The Bottom Line
Operating Profit       $100,000
- Interest             ($10,000)
- Taxes                ($20,000)
= Net Profit           $70,000 (7.4%)
What to watch: Trends, not just snapshots
How to Read a P&L in 30 Seconds
- Revenue growth: Up or down vs last period?
- Gross margin: Improving or declining?
- Operating margin: Positive and growing?
- Expense ratios: Any line item over 20% of revenue?
- Bottom line: Black or red?
That's it. Everything else is details.
The Hidden Stories in Your P&L
Story 1: The Growth Trap
Revenue: +50% year-over-year ✓
Expenses: +80% year-over-year ✗
Result: Growing broke
High growth with faster expense growth = death spiral.
Story 2: The Margin Squeeze
Year 1 Gross Margin: 65%
Year 2 Gross Margin: 60%
Year 3 Gross Margin: 55%
Competition or commoditization. Fix now or die slowly.
Story 3: The False Profit
Net Profit: $100,000 ✓
But...
Accounts Receivable: +$500,000
Inventory: +$300,000
Profitable on paper, no cash in bank. Classic P&L trap.
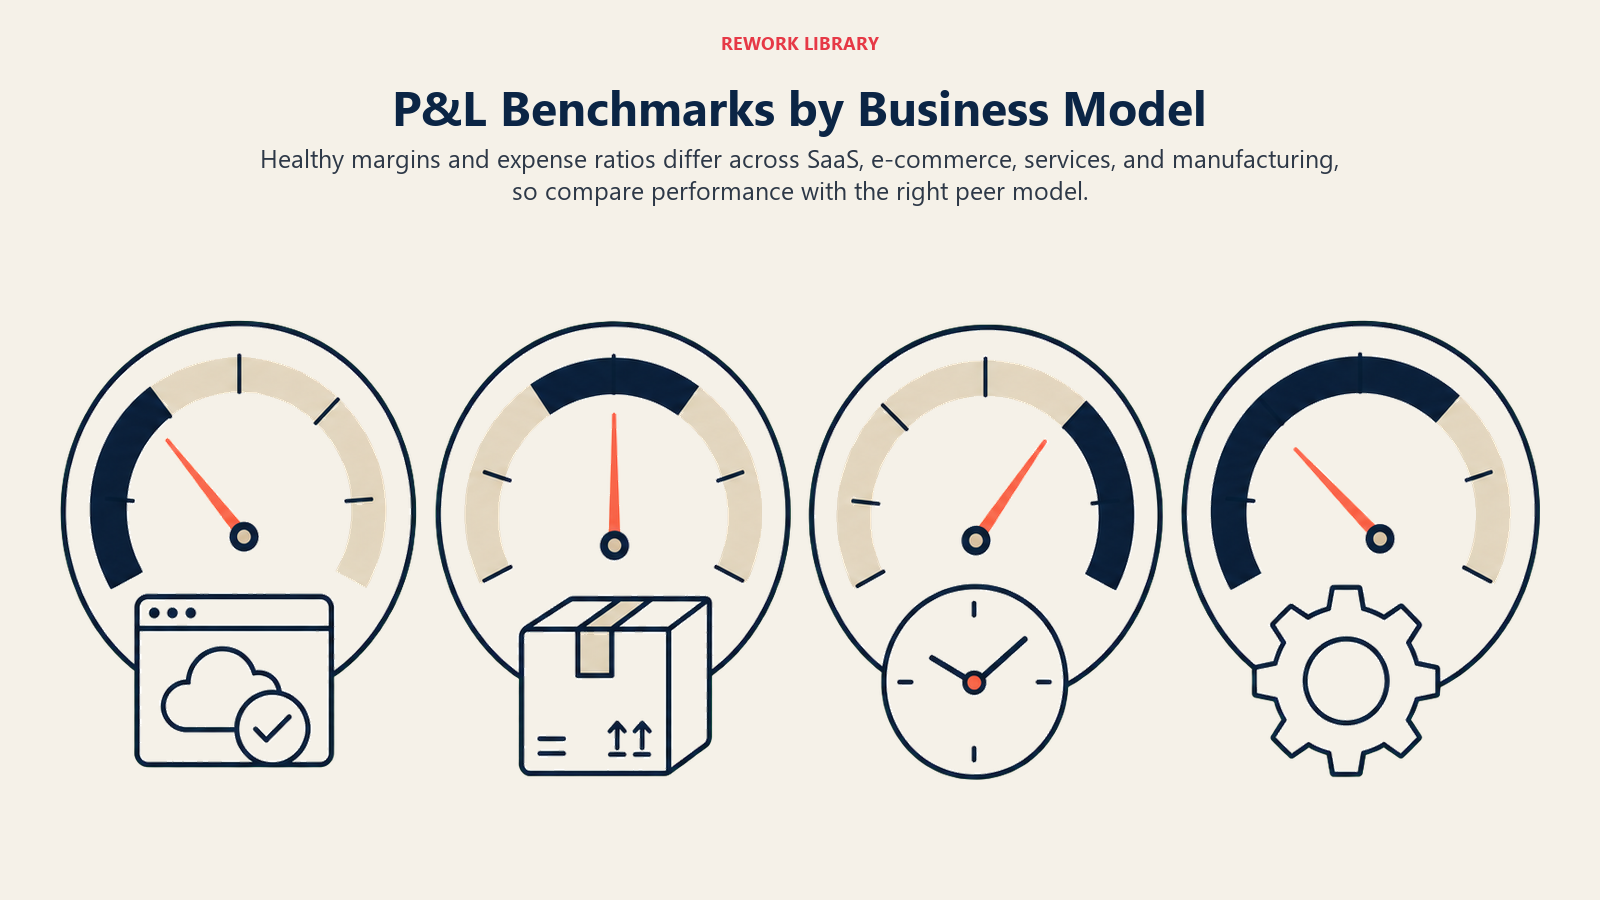
P&L Benchmarks by Business Model (2026)
Benchmarks are useful only when margins and expense ratios are compared with the economics of the right peer business model.
SaaS Companies
- Gross Margin: 75-85%
- Sales & Marketing: 30-50% of revenue
- R&D: 15-25% of revenue
- G&A: 10-15% of revenue
- Target Operating Margin: 10-20%
E-commerce
- Gross Margin: 40-60%
- Marketing: 15-25% of revenue
- Fulfillment: 10-15% of revenue
- G&A: 8-12% of revenue
- Target Operating Margin: 5-15%
Professional Services
- Gross Margin: 40-60%
- Sales: 10-20% of revenue
- Delivery: Included in COGS
- G&A: 15-20% of revenue
- Target Operating Margin: 15-25%
Manufacturing
- Gross Margin: 25-40%
- Sales: 5-10% of revenue
- Operations: 10-15% of revenue
- G&A: 10-15% of revenue
- Target Operating Margin: 8-15%
The Five P&L Ratios Every CEO Must Know
1. Gross Margin (Health Check)
Formula: (Revenue - COGS) ÷ Revenue Good: Above industry average Bad: Declining quarter-over-quarter
2. Operating Margin (Efficiency Score)
Formula: Operating Profit ÷ Revenue Good: Positive and growing Bad: Negative or shrinking
3. Expense Ratios (Spending Discipline)
Formula: Each Expense Category ÷ Revenue Good: Stable or declining Bad: Growing faster than revenue
4. Customer Acquisition Ratio
Formula: Sales & Marketing ÷ New Customers Good: 3-12 month payback Bad: Over 18 months
5. Employee Efficiency
Formula: Revenue ÷ Number of Employees Good: $150K+ per employee Bad: Under $100K per employee
Common P&L Manipulation Tricks
Trick 1: Revenue Recognition Games
Booking future revenue today. Looks good until it doesn't.
Trick 2: Capitalizing Expenses
Moving operating costs to balance sheet. Inflates profit temporarily.
Trick 3: One-Time Items
Every month has "one-time" expenses. They're not one-time.
Trick 4: Channel Stuffing
Pushing inventory to distributors. Revenue today, returns tomorrow.
Red flag: If it seems too good to be true, dig deeper.
Your Monthly P&L Review Process
Week 1: The Flash P&L
Quick estimate within 5 days of month-end:
- Revenue (from sales system)
- Major expenses (from bills)
- Rough margin calculation
Week 2: The Real P&L
Complete P&L by day 10:
- All revenue recognized
- All expenses accrued
- Margins calculated
- Variances analyzed
Week 3: The Action P&L
Strategic review by day 15:
- Compare to budget
- Identify problem areas
- Create action items
- Adjust forecasts
Week 4: The Forward P&L
Next month planning:
- Updated projections
- Expense approvals
- Investment decisions
- Course corrections
P&L Analysis Tools
Basic (Good Enough)
- Excel with templates
- QuickBooks reports
- Google Sheets dashboards
Intermediate (Better)
- Fathom
- LivePlan
- Jirav
Advanced (Best)
- Anaplan
- Adaptive Insights
- NetSuite
Truth: A simple Excel P&L updated weekly beats a complex system updated quarterly.
The CEO's P&L Dashboard
Create a one-page view with:
Revenue Metrics
- Total Revenue (vs last month/year)
- Growth Rate %
- Revenue by Product/Service
- Customer Concentration
Expense Metrics
- Total Expenses (vs revenue)
- Expense by Category
- Biggest increases
- Per-employee costs
Profit Metrics
- Gross Margin % (trend)
- Operating Margin % (trend)
- EBITDA
- Net Margin
Key Ratios
- CAC Payback
- Magic Number
- Rule of 40
- Burn Multiple
Update weekly. Review religiously.
From P&L to Action
Your P&L tells you what happened. Your job is to change what happens next.
If Revenue is Down
- Analyze by product/customer
- Check sales pipeline
- Review pricing
- Accelerate marketing
If Margins are Shrinking
- Audit COGS line by line
- Negotiate with suppliers
- Review pricing power
- Cut low-margin products
If Expenses are Growing Too Fast
- Freeze hiring
- Cut discretionary spending
- Renegotiate contracts
- Improve efficiency
If Losing Money
- Calculate runway
- Cut deep once
- Focus on unit economics
- Consider pivot
Your P&L Action Plan
Today:
- Find your latest P&L
- Calculate the five key ratios
- Identify biggest surprise
- Pick one thing to fix
This Week:
- Create simple P&L dashboard
- Compare to benchmarks
- Set up weekly review
- Share with leadership
This Month:
- Implement monthly process
- Train team on P&L basics
- Tie bonuses to P&L metrics
- Create action triggers
This Quarter:
- Achieve positive operating margin
- Improve gross margin 2%
- Reduce expense ratio 5%
- Build predictable P&L
The Bottom Line on P&Ls
Your P&L is not an accounting exercise. It's your business strategy in numbers.
Every line tells a story:
- Revenue = Market acceptance
- Gross margin = Business model
- Expenses = Priorities
- Profit = Sustainability
Read it wrong, make bad decisions. Read it right, build an empire.
The best CEOs can draw their P&L from memory. Not because they're financial geniuses, but because they live it daily.
Your P&L is your scorecard. Know the score, or lose the game.
Ready to go deeper? Master Cash Flow Statements for the full picture or explore Financial Planning for forward-looking insights.
Part of the [Business Terms Collection]. Last updated: 2026-07-21
On this page
- P&L: Your Business X-Ray
- The P&L Structure That Matters
- The Top Line (Revenue)
- The Middle (Margins)
- The Bottom Line
- How to Read a P&L in 30 Seconds
- The Hidden Stories in Your P&L
- Story 1: The Growth Trap
- Story 2: The Margin Squeeze
- Story 3: The False Profit
- P&L Benchmarks by Business Model (2026)
- The Five P&L Ratios Every CEO Must Know
- 1. Gross Margin (Health Check)
- 2. Operating Margin (Efficiency Score)
- 3. Expense Ratios (Spending Discipline)
- 4. Customer Acquisition Ratio
- 5. Employee Efficiency
- Common P&L Manipulation Tricks
- Trick 1: Revenue Recognition Games
- Trick 2: Capitalizing Expenses
- Trick 3: One-Time Items
- Trick 4: Channel Stuffing
- Your Monthly P&L Review Process
- Week 1: The Flash P&L
- Week 2: The Real P&L
- Week 3: The Action P&L
- Week 4: The Forward P&L
- P&L Analysis Tools
- Basic (Good Enough)
- Intermediate (Better)
- Advanced (Best)
- The CEO's P&L Dashboard
- Revenue Metrics
- Expense Metrics
- Profit Metrics
- Key Ratios
- From P&L to Action
- If Revenue is Down
- If Margins are Shrinking
- If Expenses are Growing Too Fast
- If Losing Money
- Your P&L Action Plan
- The Bottom Line on P&Ls