Bahasa Indonesia
Pipeline Metrics Overview: Dashboard untuk Kesehatan Revenue
Turn this article into takeaways for your work.
Each assistant summarizes the article only for you and suggests best practices for your work.
Peter Drucker pernah berkata dengan tepat, "Apa yang diukur akan dikelola."
Namun inilah kebenaran yang tidak nyaman: sebagian besar revenue leader mengukur hal yang salah. Atau terlalu banyak hal. Atau hal yang menunjukkan apa yang terjadi tiga bulan lalu, bukan apa yang akan datang kuartal berikutnya.
Pipeline metrics lebih dari sekadar angka di dashboard. Metrik ini mengungkap apakah mesin pendapatan Anda bekerja penuh tenaga atau justru diam-diam mulai rusak. Perusahaan yang konsisten mencapai target dibanding yang selalu kelabakan setiap kuartal? Bedanya bukan keberuntungan. Ini soal disiplin pengukuran.
Membangun pendapatan yang dapat diprediksi berarti memahami metrik mana yang benar-benar penting, cara menghitungnya dengan benar, dan apa yang metrik tersebut ungkapkan tentang kesehatan pipeline Anda.
Apa yang Membuat Pipeline Metric Benar-Benar Berguna?
Tidak semua metrik diciptakan setara. Pipeline metrics terbaik memiliki tiga karakteristik:
Metrik itu actionable. Metrik yang baik memberi tahu apa yang harus dilakukan secara berbeda, bukan sekadar apa yang terjadi. "Pipeline yang dibuat bulan ini 30% di bawah target" memicu tindakan. "Total opportunity di Salesforce" tidak.
Metrik itu leading indicator. Lagging metric (closed revenue, win rate) menunjukkan apa yang sudah terjadi. Leading metric (new pipeline creation, konversi tahap awal) memprediksi apa yang akan terjadi. Anda membutuhkan keduanya, tetapi leading indicator memberi Anda waktu untuk melakukan intervensi.
Metrik itu comparable. Metrik yang bisa disegmentasikan berdasarkan rep, wilayah, produk, atau periode waktu memungkinkan analisis yang bermakna. "Win rate keseluruhan 25%" itu menarik. "Win rate turun dari 32% menjadi 18% untuk deal di bawah $50 ribu di wilayah Timur Laut" menuntut investigasi.
Empat Kategori yang Mencakup Semuanya
Pipeline metrics lebih mudah dikelola ketika dikelompokkan menjadi volume, quality, velocity, dan conversion.
Setiap pipeline metric masuk ke salah satu dari empat kategori ini. Kuasai keempatnya, dan Anda akan memahami gambaran kesehatan pipeline secara utuh.
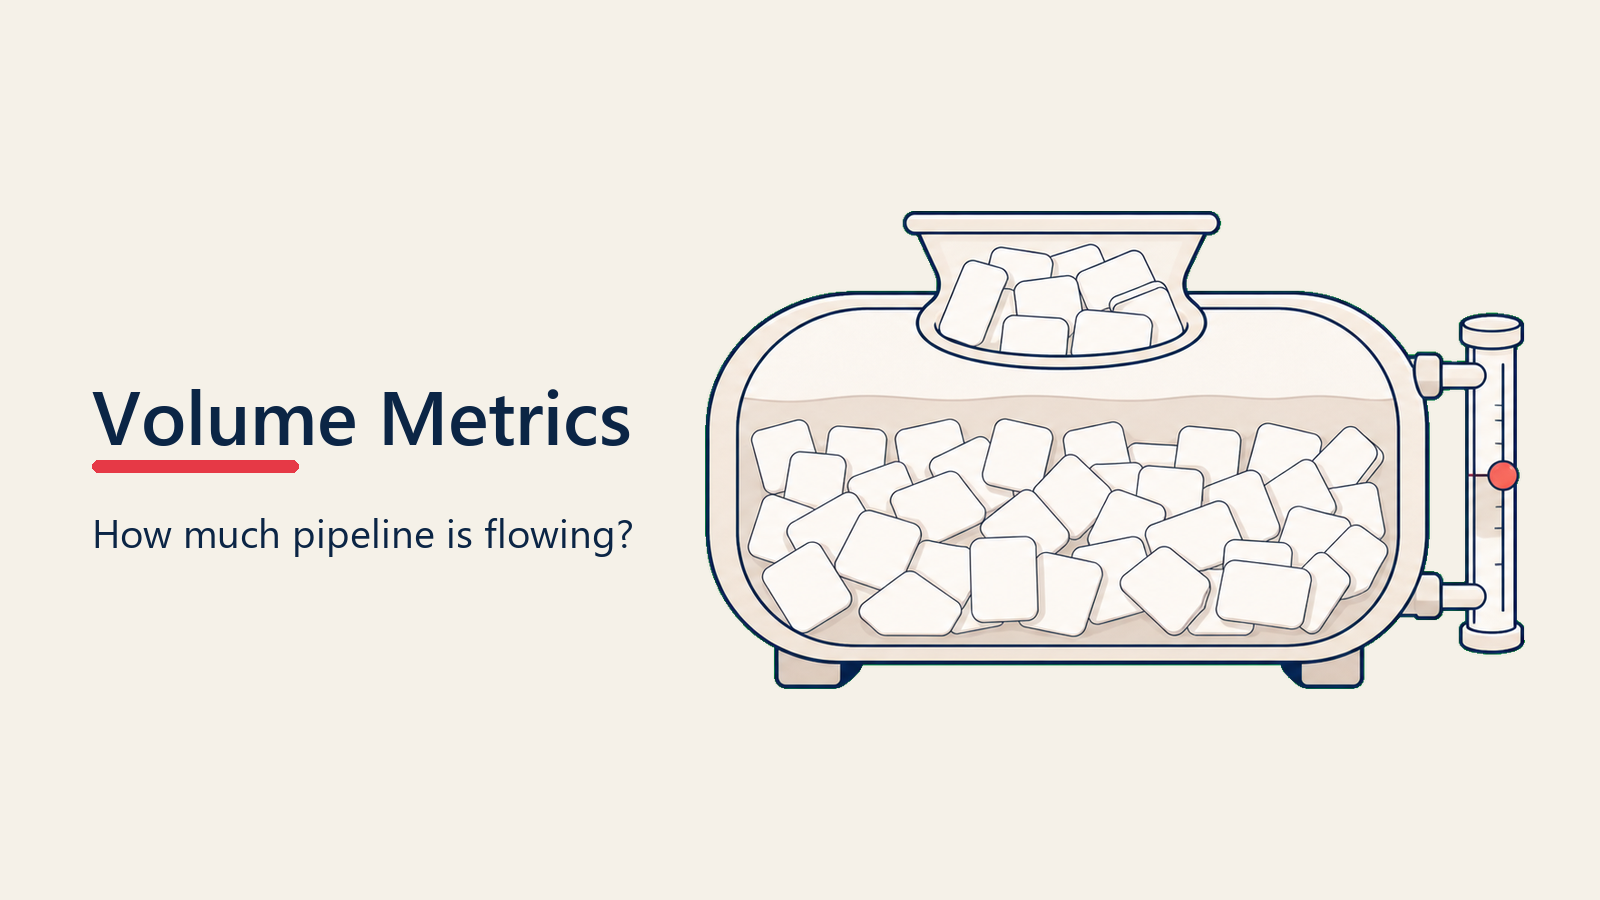
Volume Metrics: Kuantitas dan Aliran
Volume metrics mengukur seberapa banyak pipeline yang Anda miliki dan bagaimana pergerakannya melalui sistem Anda. Anggap ini seperti memeriksa ketinggian air dan laju aliran di reservoir pendapatan Anda.
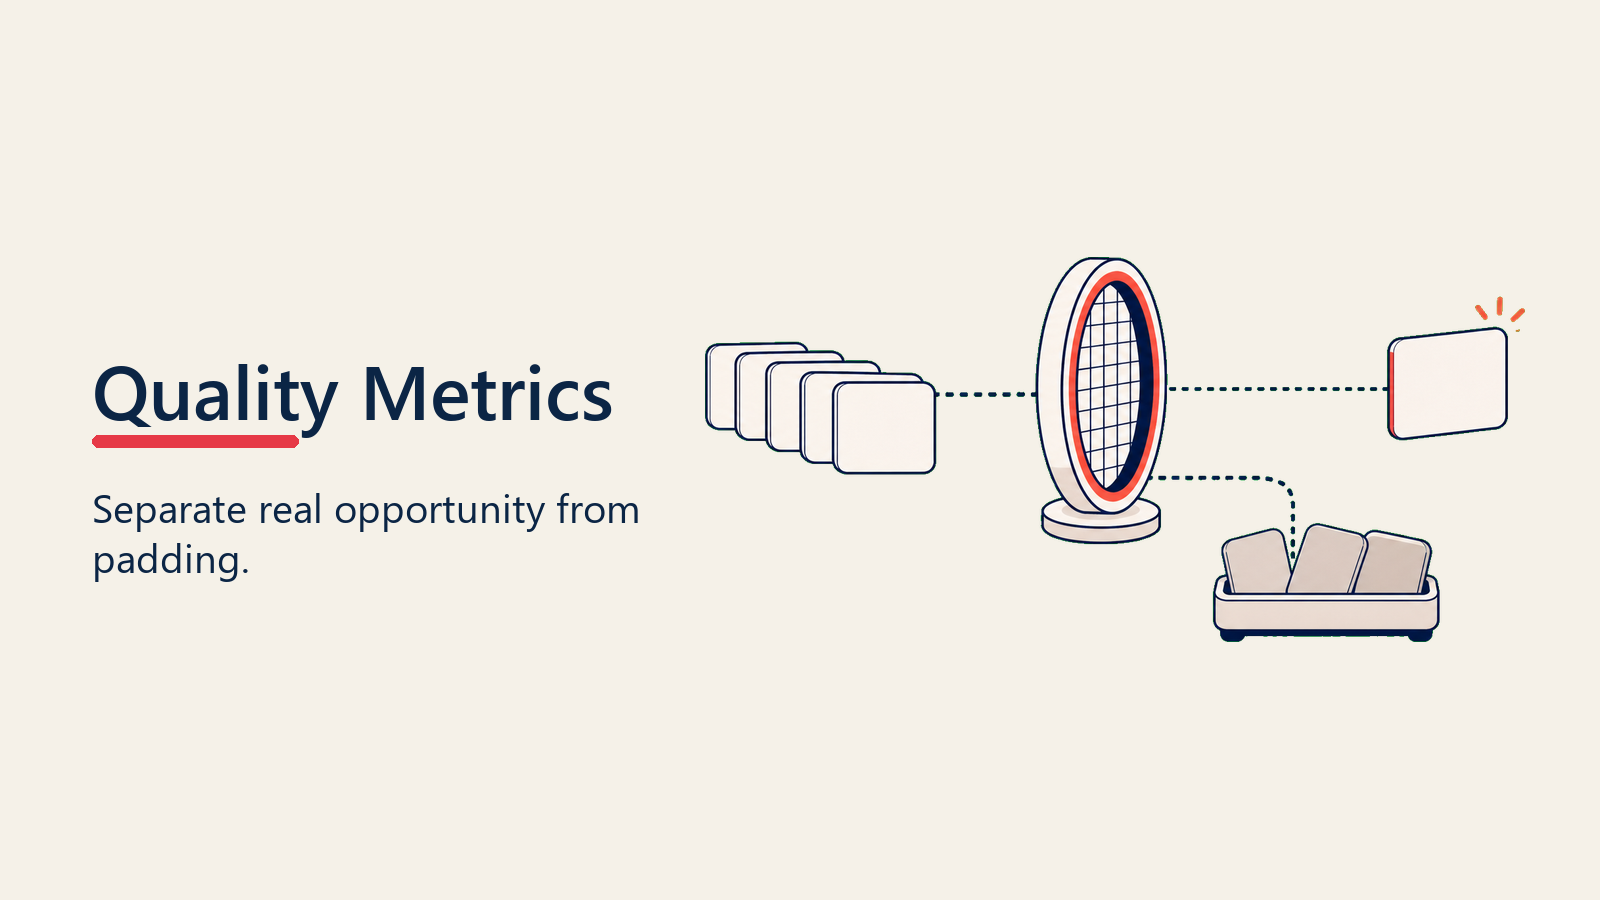
Quality Metrics: Konversi dan Win Rate
Quality metrics mengungkap apakah pipeline Anda berisi peluang nyata atau sekadar harapan kosong. Metrik ini memisahkan pembeli serius dari yang cuma "tire-kicker" dan menunjukkan jenis deal mana yang benar-benar close.
Velocity Metrics: Kecepatan dan Efisiensi
Velocity metrics melacak seberapa cepat deal bergerak melalui pipeline Anda. Lebih cepat tidak selalu lebih baik, tetapi memahami ritme alami pipeline Anda mengungkap bottleneck dan pola forecasting.
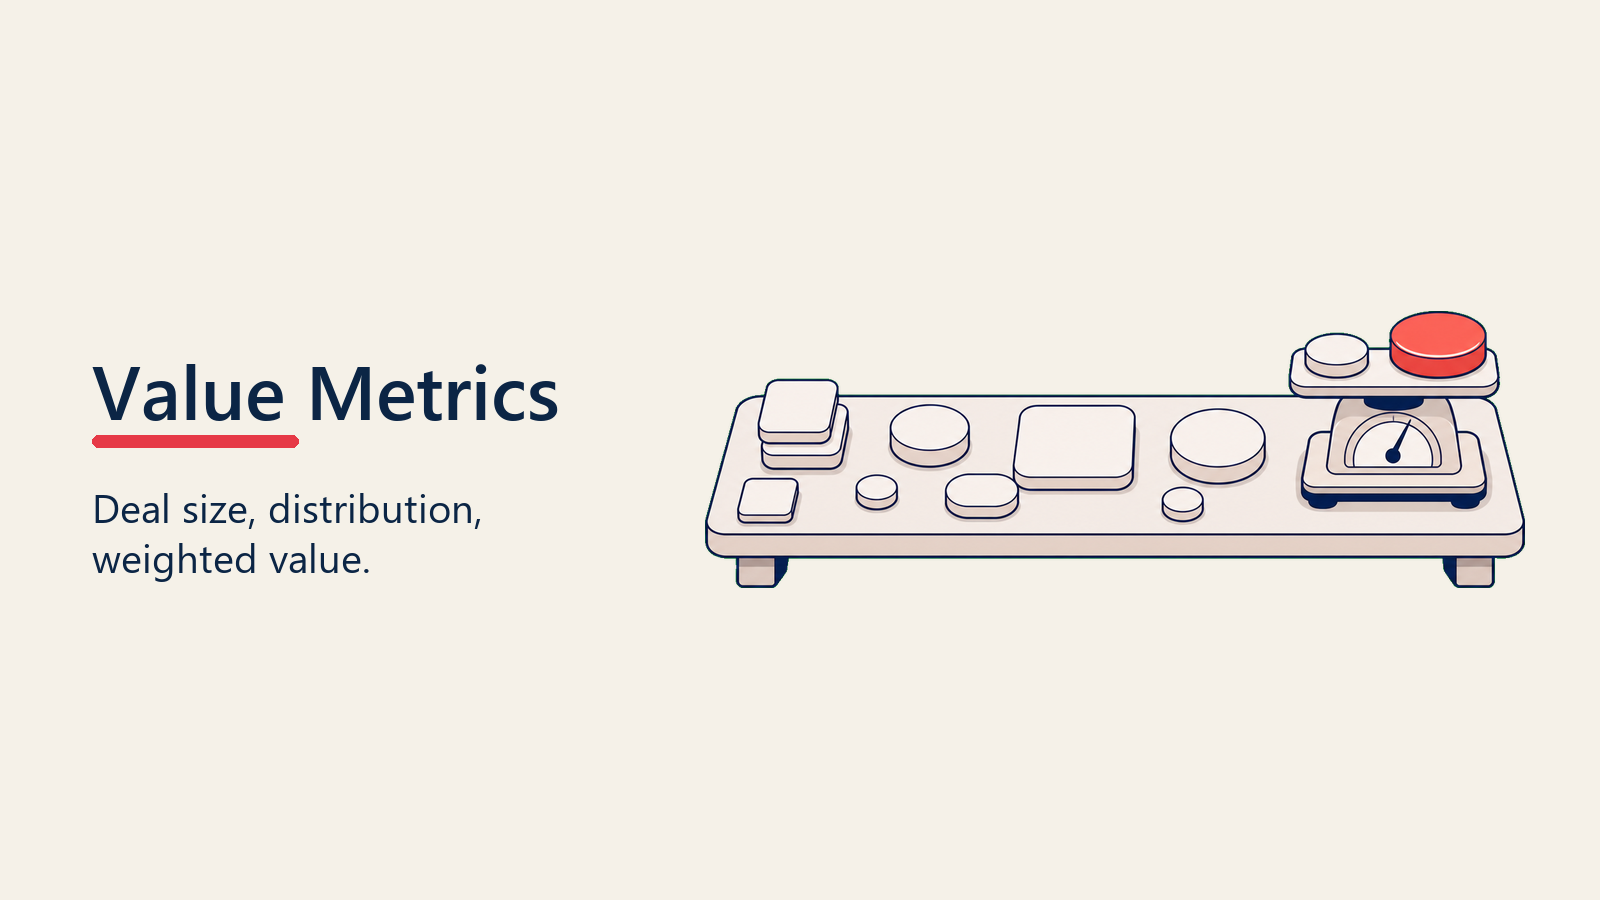
Value Metrics: Ukuran dan Potensi Pendapatan
Value metrics mengukur ekonomi deal: ukuran rata-rata, pola distribusi, dan ekspektasi pendapatan yang disesuaikan dengan probabilitas. Di sinilah volume bertemu dengan realita.
Volume Metrics: Memahami Kuantitas Pipeline
Volume metrics menjawab pertanyaan mendasar, "Apakah pipeline kami sudah cukup?"
Total Pipeline Value
Jumlah seluruh open opportunity dalam pipeline Anda, terlepas dari tahap atau probabilitasnya.
Mengapa penting: Ini adalah gross opportunity universe Anda. Meski belum disesuaikan dengan probabilitas, angka ini menetapkan potensi pendapatan maksimum untuk periode tertentu.
Kalkulasi: Jumlah seluruh nilai opportunity di mana Status = Open
Rentang benchmark:
- B2B SaaS: 3-5x target pendapatan kuartalan
- Enterprise software: 4-6x target pendapatan kuartalan
- Penjualan transaksional: 2-3x target pendapatan bulanan
Tanda peringatan: Total pipeline kurang dari 3x target berarti Anda hanya berjarak satu bulan buruk dari gagal mencapai target.
Pipeline by Stage
Nilai pipeline yang dirinci berdasarkan setiap tahap dalam proses penjualan Anda.
Mengapa penting: Distribusi ini mengungkap apakah pipeline Anda sehat secara menyeluruh atau justru menumpuk di tahap awal/akhir. Pipeline yang tidak seimbang menciptakan masalah forecasting dan target yang meleset.
Distribusi ideal (pipeline 7 tahap):
- Tahap awal (1-3): 40-50%
- Tahap tengah (4-5): 30-35%
- Tahap akhir (6-7): 20-25%
Memahami cara merancang tahap pipeline yang efektif membantu menetapkan target distribusi yang bermakna.
Tanda peringatan:
- Lebih dari 60% di tahap awal = masalah konversi
- Kurang dari 15% di tahap akhir = risiko pendapatan jangka pendek
- Lebih dari 40% di tahap akhir = sandbagging atau deal yang macet
New Pipeline Created (Periode ke Periode)
Nilai opportunity baru yang ditambahkan ke pipeline Anda dalam periode waktu tertentu.
Mengapa penting: Ini adalah leading indicator yang memprediksi pendapatan masa depan. Penurunan new pipeline creation hari ini berarti target yang meleset kuartal berikutnya.
Kalkulasi: Jumlah nilai opportunity di mana Created Date jatuh dalam periode tersebut
Rentang benchmark:
- Seharusnya setara atau melebihi closed revenue + pipeline decay
- Sehat: 100-125% dari target kuartalan dibuat setiap kuartal
- Pertumbuhan tinggi: 150-200% dari target
Frekuensi pemantauan: Mingguan untuk penyesuaian taktis, bulanan untuk perencanaan strategis
Pipeline Adds vs Exits
Perubahan bersih dalam nilai pipeline, memperhitungkan opportunity baru yang ditambahkan dan opportunity yang keluar (won, lost, atau didiskualifikasi).
Mengapa penting: Total pipeline bisa menyembunyikan masalah. Menambahkan $2 juta tetapi kehilangan $2,5 juta setiap bulan? Pipeline Anda menyusut meski angka utamanya terlihat stabil.
Kalkulasi:
Net Pipeline Change = New Opportunities Created
                      + Won Opportunities
                      - Lost Opportunities
                      - Disqualified Opportunities
Pola sehat: Perubahan bersih positif dengan win yang menyumbang 20-30% dari total exit
Tanda peringatan: Perubahan bersih negatif selama dua periode berturut-turut mengindikasikan masalah demand generation
Open Opportunities Count
Total jumlah open opportunity dalam pipeline Anda.
Mengapa penting: Digabungkan dengan total pipeline value, ini mengungkap ukuran deal rata-rata dan kapasitas rep. Rep dengan 80 open opportunity punya beban kerja yang sangat berbeda dari rep dengan 15.
Rentang benchmark:
- Enterprise AE: 15-30 opportunity aktif
- Mid-market AE: 30-50 opportunity aktif
- SMB AE: 50-100+ opportunity aktif
Tanda peringatan:
- Terlalu banyak: perhatian jadi terpecah, kurangnya prioritas
- Terlalu sedikit: masalah demand generation atau kualifikasi yang terlalu ketat
Quality Metrics: Mengukur Konversi dan Win Rate
Quality metrics memisahkan opportunity nyata dari pipeline padding. Metrik ini mengungkap apakah volume metrics Anda dibangun di atas fondasi yang kokoh atau sekadar angan-angan. Praktik kualifikasi opportunity yang kuat secara langsung memperbaiki metrik ini.
Stage-to-Stage Conversion Rates
Persentase opportunity yang berhasil naik dari satu tahap ke tahap berikutnya.
Mengapa penting: Win rate keseluruhan adalah lagging indicator. Stage-to-stage conversion menunjukkan persis di mana deal tersendat, mengungkap peluang coaching dan masalah proses yang spesifik.
Kalkulasi: (Opportunity yang naik ke tahap berikutnya ÷ Opportunity yang masuk tahap saat ini) × 100
Rentang benchmark (B2B SaaS):
- Discovery → Qualification: 60-70%
- Qualification → Proposal: 50-60%
- Proposal → Negotiation: 60-70%
- Negotiation → Closed-Won: 70-80%
Teknik analisis: Pantau ini setiap minggu. Penurunan 15% pada konversi stage-to-stage mana pun adalah sinyal peringatan dini yang layak diinvestigasi segera.
Overall Win Rate
Persentase opportunity yang berhasil close.
Mengapa penting: Win rate mengungkap apakah targeting, kualifikasi, dan eksekusi penjualan Anda berjalan dengan baik. Ini adalah quality metric utama untuk seluruh pipeline Anda.
Kalkulasi: (Closed-Won Opportunities ÷ Total Closed Opportunities) × 100
Rentang benchmark:
- Enterprise B2B: 25-35%
- Mid-market B2B: 30-40%
- Transactional B2B: 40-50%
- High-velocity SaaS: 20-25%
Penting: Selalu ukur win rate dari opportunity yang sudah terkualifikasi, bukan raw lead. Memasukkan opportunity yang belum terkualifikasi akan mengecilkan metrik secara artifisial. Fokus pada strategi peningkatan win rate setelah Anda memiliki pengukuran baseline yang andal.
Win Rate by Segment, Rep, dan Product
Win rate yang dirinci berdasarkan kategori yang bermakna.
Mengapa penting: Win rate keseluruhan menyembunyikan pola penting. Anda mungkin punya win rate keseluruhan 30%, tetapi 45% di enterprise dan hanya 18% di SMB, yang mengungkap masalah targeting.
Segmen penting yang perlu dipantau:
- Ukuran perusahaan (jumlah karyawan, pendapatan)
- Vertikal industri
- Wilayah geografis
- Jenis produk/solusi
- Sales representative
- Sumber lead
- Rentang ukuran deal
Pemicu tindakan:
- Variansi 20%+ antar segmen → masalah targeting atau alokasi sumber daya
- Variansi 30%+ antar rep → masalah coaching atau kualitas wilayah
- Tren menurun pada segmen mana pun → kecocokan pasar atau tekanan kompetitif
Loss Analysis and Reasons
Alasan yang dikategorikan mengapa opportunity close-lost.
Mengapa penting: "Kami kalah dari kompetitor" tidak membantu Anda memperbaiki apa pun. "Kalah dari Kompetitor X soal harga pada deal di bawah $50 ribu" memberi Anda sesuatu yang spesifik untuk diselesaikan.
Kategori loss standar:
- Kalah dari kompetitor tertentu
- Kalah dari status quo (tidak ada keputusan)
- Masalah anggaran/waktu
- Kecocokan produk/fitur
- Persepsi harga/value
- Kepergian champion atau perubahan organisasi
Rentang benchmark:
- Kalah dari kompetitor: 30-40%
- Kalah dari status quo: 25-35%
- Anggaran/waktu: 15-25%
- Produk/harga: 10-15%
Teknik analisis: Pantau alasan loss setiap bulan. Jika "kalah dari Kompetitor X" melonjak dari 15% menjadi 30% dalam satu kuartal, posisi kompetitif Anda sudah berubah. Melakukan analisis deal yang kalah secara sistematis mengungkap pola yang bisa Anda tindaklanjuti.
Deal Quality Score
Skor komposit yang menunjukkan kesehatan opportunity berdasarkan berbagai faktor.
Mengapa penting: Tidak semua pipeline setara. Deal $100 ribu dengan stakeholder yang aktif terlibat, evaluasi kompetitif, dan waktu yang mendesak sangat berbeda dari deal $100 ribu dengan kontak yang jarang dan timeline yang kabur.
Faktor skoring umum:
- Keterlibatan stakeholder (frekuensi, senioritas)
- Lanskap kompetitif (status petahana, tahap evaluasi)
- Konfirmasi anggaran
- Kejelasan timeline
- Pemahaman proses keputusan
- Tingkat keparahan pain point
- Kekuatan champion
Pendekatan benchmark: Skor 0-100, dengan 70+ menandakan opportunity berkualitas tinggi. Pantau persentase pipeline Anda yang berada di atas 70.
Target: 40-60% dari pipeline tahap akhir seharusnya bernilai 70+
Velocity Metrics: Melacak Kecepatan dan Efisiensi
Velocity metrics mengungkap seberapa efisien pipeline Anda melakukan konversi. Lebih cepat tidak selalu lebih baik, tetapi memahami ritme alami pipeline Anda memungkinkan forecasting yang lebih baik dan mengungkap bottleneck tersembunyi.
Average Sales Cycle Length
Rata-rata waktu dari pembuatan opportunity hingga close (won atau lost).
Mengapa penting: Panjang sales cycle mendorong arus kas, akurasi forecasting, dan perencanaan kapasitas rep. Siklus 180 hari berarti keputusan yang dibuat hari ini memengaruhi pendapatan enam bulan ke depan.
Kalkulasi: Rata-rata dari (Close Date - Created Date) untuk seluruh opportunity yang closed
Rentang benchmark:
- Enterprise B2B: 6-18 bulan
- Mid-market B2B: 3-6 bulan
- SMB B2B: 1-3 bulan
- High-velocity SaaS: 15-45 hari
Tips analisis:
- Segmentasikan berdasarkan ukuran deal (deal yang lebih besar butuh waktu lebih lama)
- Pantau tren dari waktu ke waktu (siklus yang memanjang menandakan masalah)
- Bandingkan panjang siklus deal yang won dan lost (loss yang lebih cepat = masalah kualifikasi)
Time in Each Stage
Rata-rata jumlah hari opportunity berada di setiap tahap pipeline.
Mengapa penting: Panjang sales cycle secara agregat bisa menyembunyikan pola penting. Siklus rata-rata 120 hari terlihat baik-baik saja sampai Anda sadar deal menghabiskan 90 hari di satu tahap saja. Itulah bottleneck Anda.
Kalkulasi: Rata-rata dari (Stage Exit Date - Stage Entry Date) per tahap
Pendekatan benchmark: Tetapkan baseline Anda, lalu pantau variansinya. Tahap yang biasanya memakan 14 hari tiba-tiba menjadi 28 hari menandakan masalah.
Tanda peringatan:
- Tahap awal yang terlalu lama = masalah kualifikasi
- Tahap akhir yang berlarut-larut = masalah negosiasi atau deal yang macet
- Tahap tengah yang tersendat = masalah value proposition atau champion
Menerapkan kriteria stage gate membantu memastikan deal bergerak melalui tahap-tahap secara efisien.
Pipeline Velocity
Metrik komposit yang menggabungkan nilai deal, probabilitas win, dan panjang siklus.
Mengapa penting: Satu metrik ini menangkap apakah pipeline Anda secara efisien berkonversi menjadi pendapatan. Velocity yang lebih tinggi berarti lebih banyak pendapatan dalam waktu yang lebih singkat.
Kalkulasi:
Pipeline Velocity = (Number of Opportunities × Average Deal Value × Win Rate) ÷ Sales Cycle Length (days)
Contoh:
(100 opportunity × $50.000 × 30% win rate) ÷ 90 hari = $16.667 per hari
Pendekatan benchmark: Tetapkan baseline, lalu pantau setiap bulan. Fokus pada tren, bukan nilai absolut.
Tuas peningkatan:
- Menambah jumlah opportunity (demand gen)
- Meningkatkan nilai deal rata-rata (targeting, packaging)
- Meningkatkan win rate (kualifikasi, eksekusi penjualan)
- Mempersingkat panjang siklus (menghilangkan bottleneck)
Pelajari lebih lanjut: Pipeline Velocity: Metrik yang Menggabungkan Volume, Value, dan Kecepatan
Deal Acceleration and Deceleration
Opportunity yang bergerak lebih cepat atau lebih lambat dibanding rata-rata historis untuk tahapnya.
Mengapa penting: Deal yang berakselerasi menandakan minat pembeli yang kuat dan layak mendapat perhatian ekstra. Deal yang melambat berisiko dan butuh intervensi.
Kalkulasi:
- Bandingkan durasi tahap saat ini dengan rata-rata historis
- Tandai deal yang 20%+ lebih cepat (berakselerasi) atau lebih lambat (melambat)
Pemicu tindakan:
- Deal yang berakselerasi: prioritaskan, pastikan sumber daya tersedia
- Deal yang melambat: check-in dengan rep, identifikasi hambatan
Stagnant Deal Percentage
Opportunity yang tidak menunjukkan aktivitas atau pergerakan tahap yang berarti dalam periode tertentu.
Mengapa penting: Deal yang stagnan adalah zombie pipeline. Deal ini menggelembungkan total pipeline value Anda tetapi kecil kemungkinan untuk close. Metrik ini memaksa Anda menjaga pipeline hygiene.
Kalkulasi: (Opportunity tanpa aktivitas atau perubahan tahap selama 30+ hari ÷ Total Open Opportunities) × 100
Benchmark: Seharusnya di bawah 20% dari total pipeline
Tanda peringatan: Lebih dari 30% deal stagnan berarti pipeline Anda tergembung dan forecast Anda keliru
Tindakan: Terapkan pipeline review bulanan yang mewajibkan rep untuk mengkualifikasi ulang, menggerakkan, atau mendiskualifikasi deal yang stagnan. Praktik manajemen usia deal yang rutin menjaga pipeline Anda tetap sehat dan akurat.
Value Metrics: Memahami Ekonomi Deal
Value metrics mengungkap karakteristik ekonomi pipeline Anda: ukuran deal, distribusi, dan ekspektasi pendapatan yang disesuaikan dengan probabilitas.
Average Deal Size
Rata-rata nilai deal closed-won.
Mengapa penting: Ukuran deal memengaruhi segalanya: sales cycle, win rate, kapasitas rep, dan prediktabilitas pendapatan. Memantau ini mengungkap pergeseran dalam targeting atau bauran produk.
Kalkulasi: Total Closed-Won Revenue ÷ Jumlah Deal Closed-Won
Pendekatan benchmark: Tetapkan baseline per segmen (enterprise, mid-market, SMB), lalu pantau variansi bulanan.
Tanda peringatan:
- Tren menurun: pergeseran ke pasar bawah atau tekanan diskon
- Variansi meningkat: targeting yang tidak konsisten
- Kompresi segmen: saturasi pasar di sweet spot Anda
Upaya optimasi ukuran deal yang terarah dapat memperbaiki metrik ini secara sistematis.
Deal Size Distribution
Nilai pipeline yang dirinci ke dalam rentang ukuran deal.
Mengapa penting: Ukuran deal rata-rata bisa menyembunyikan pola distribusi. Rata-rata $10 juta terlihat bagus, tetapi bagaimana jika separuh deal Anda di bawah $1 juta dan separuh lainnya di atas $20 juta? Keduanya membutuhkan pendekatan penjualan yang sama sekali berbeda.
Rentang standar:
- Enterprise: <$50 ribu, $50 ribu-$250 ribu, $250 ribu-$1 juta, $1 juta+
- Mid-market: <$10 ribu, $10 ribu-$50 ribu, $50 ribu-$100 ribu, $100 ribu+
- SMB: <$5 ribu, $5 ribu-$25 ribu, $25 ribu-$50 ribu, $50 ribu+
Distribusi ideal: 60-70% deal di segmen target Anda, 20-30% di atasnya, 10-20% di bawahnya
Pemicu tindakan: Jika lebih dari 40% pipeline berada di luar segmen target, Anda punya masalah targeting
Weighted Pipeline Value
Nilai pipeline yang disesuaikan dengan probabilitas win di setiap tahap.
Mengapa penting: Total pipeline memperlakukan setiap deal secara setara. Weighted pipeline memperhitungkan realita bahwa deal di tahap awal lebih kecil kemungkinannya untuk close dibanding deal di tahap akhir.
Kalkulasi: Jumlah dari (Opportunity Value × Stage Win Probability)
Contoh:
- Discovery (probabilitas 20%): $1 juta × 0,20 = $200 ribu
- Proposal (probabilitas 50%): $500 ribu × 0,50 = $250 ribu
- Negotiation (probabilitas 75%): $400 ribu × 0,75 = $300 ribu
- Total Weighted Pipeline: $750 ribu
Benchmark: Weighted pipeline seharusnya 100-125% dari target kuartalan untuk forecast yang meyakinkan
Pelajari lebih lanjut: Weighted Pipeline: Melampaui Nilai Pipeline Kotor
Pipeline Coverage Ratio
Rasio antara total nilai pipeline dan target pendapatan.
Mengapa penting: Satu metrik ini menjawab, "Apakah pipeline kami cukup untuk mencapai target?" Ini adalah hal pertama yang diperiksa revenue leader.
Kalkulasi: Total Pipeline Value ÷ Revenue Target
Rentang benchmark:
- Enterprise: 4-6x coverage
- Mid-market: 3-4x coverage
- SMB/transaksional: 2-3x coverage
Tanda peringatan:
- Di bawah 3x: kesenjangan pipeline yang serius, kecil kemungkinan mencapai target
- Di atas 7x: padding, kualifikasi yang buruk, atau sandbagging
Pelajari lebih lanjut: Pipeline Coverage Analysis: Seberapa Banyak Pipeline yang Benar-Benar Anda Butuhkan?
Expected Revenue (Probability-Adjusted)
Jumlah weighted pipeline value dalam periode waktu tertentu.
Mengapa penting: Ini adalah forecast statistik Anda, yaitu apa yang seharusnya Anda perkirakan akan close berdasarkan pola konversi historis.
Kalkulasi: Jumlah dari (Opportunity Value × Win Probability) untuk opportunity yang close dalam periode tersebut
Benchmark: Seharusnya sesuai dengan 80-90% dari forecast yang telah dikomitmenkan
Analisis variansi:
- Expected revenue > Forecast = konservatif (atau sandbagging)
- Expected revenue < Forecast sebesar 10%+ = agresif (atau masalah pipeline)
Leading vs Lagging Indicators: Apa yang Memprediksi vs Apa yang Melaporkan
Leading indicator membantu memprediksi pendapatan masa depan, sementara lagging indicator menjelaskan apa yang sudah terjadi.
Memahami perbedaan antara leading dan lagging indicator sangat penting untuk pipeline management yang proaktif.
Leading Indicators: Apa yang Akan Segera Terjadi
Leading indicator memprediksi kinerja masa depan. Metrik ini memberi Anda waktu untuk melakukan intervensi.
New pipeline creation: Pipeline yang dibuat hari ini mendorong pendapatan kuartal berikutnya. New pipeline turun 30% bulan ini? Anda akan meleset dari target dalam 60-90 hari.
Early-stage conversion rates: Perubahan pada konversi Discovery ke Qualification akan terlihat pada closed revenue 90-180 hari kemudian.
Activity levels: Discovery call yang selesai, proposal yang terkirim, dan demo yang terjadwal memprediksi kesehatan pipeline 30-60 hari ke depan.
Deal quality scores: Skor kualitas yang meningkat di tahap awal memprediksi win rate yang lebih tinggi 60-90 hari kemudian.
Pipeline coverage trend: Rasio coverage yang menurun memprediksi target yang meleset satu kuartal ke depan. Strategi pipeline generation yang efektif mengatasi kesenjangan coverage sebelum menjadi kekurangan pendapatan.
Lagging Indicators: Apa yang Sudah Terjadi
Lagging indicator melaporkan hasil. Metrik ini penting untuk memahami outcome, tetapi tidak memberi Anda waktu untuk memperbaiki masalah.
Win rate: Menunjukkan apa yang sudah close. Begitu win rate turun, Anda sudah kehilangan deal-nya.
Closed revenue: Lagging indicator paling akhir. Berguna untuk evaluasi kinerja, tidak berguna untuk intervensi.
Average deal size: Mencerminkan deal yang sudah selesai. Berguna untuk analisis pola, bukan manajemen proaktif.
Sales cycle length: Menunjukkan kinerja masa lalu. Baru dapat ditindaklanjuti jika disegmentasikan dan dianalisis berdasarkan deal yang sedang berjalan saat ini.
Pendekatan Dashboard yang Seimbang
Dashboard pipeline yang efektif menyeimbangkan leading dan lagging indicator:
- 60% leading indicator untuk manajemen proaktif
- 40% lagging indicator untuk akuntabilitas kinerja
Contoh set metrik yang seimbang:
- Leading: new pipeline created, early conversion rates, pipeline coverage, activity metrics
- Lagging: win rate, closed revenue, average deal size
Metric Benchmarks by Industry and Segment
Pipeline metrics sangat bervariasi menurut industri dan segmen deal. Benchmark generik hanya menghasilkan target yang keliru.
B2B SaaS Benchmarks
Enterprise SaaS (ACV $100 ribu+):
- Win rate: 25-30%
- Sales cycle: 6-12 bulan
- Pipeline coverage: 4-5x
- Stage-to-stage conversion: 50-60%
Mid-market SaaS (ACV $10 ribu-$100 ribu):
- Win rate: 30-35%
- Sales cycle: 3-6 bulan
- Pipeline coverage: 3-4x
- Stage-to-stage conversion: 55-65%
SMB SaaS (ACV <$10 ribu):
- Win rate: 35-45%
- Sales cycle: 1-3 bulan
- Pipeline coverage: 2-3x
- Stage-to-stage conversion: 60-70%
Enterprise Software and Services
Deal enterprise yang kompleks ($500 ribu+):
- Win rate: 20-25%
- Sales cycle: 9-18 bulan
- Pipeline coverage: 5-6x
- Stage-to-stage conversion: 45-55%
Professional services:
- Win rate: 30-40%
- Sales cycle: 2-4 bulan
- Pipeline coverage: 3-4x
- Stage-to-stage conversion: 60-70%
Variasi Antar Industri
Financial services: Siklus lebih panjang (kepatuhan regulasi), win rate lebih tinggi (didorong hubungan)
Healthcare: Siklus yang diperpanjang (pengadaan), win rate moderat (butuh validasi klinis)
Technology: Siklus lebih singkat (keputusan lebih cepat), win rate lebih rendah (kompetitif)
Manufacturing: Siklus moderat (periode evaluasi), win rate lebih tinggi (alternatif lebih sedikit)
Tindakan: Bandingkan dengan perusahaan di industri dan segmen deal spesifik Anda, bukan rata-rata software generik.
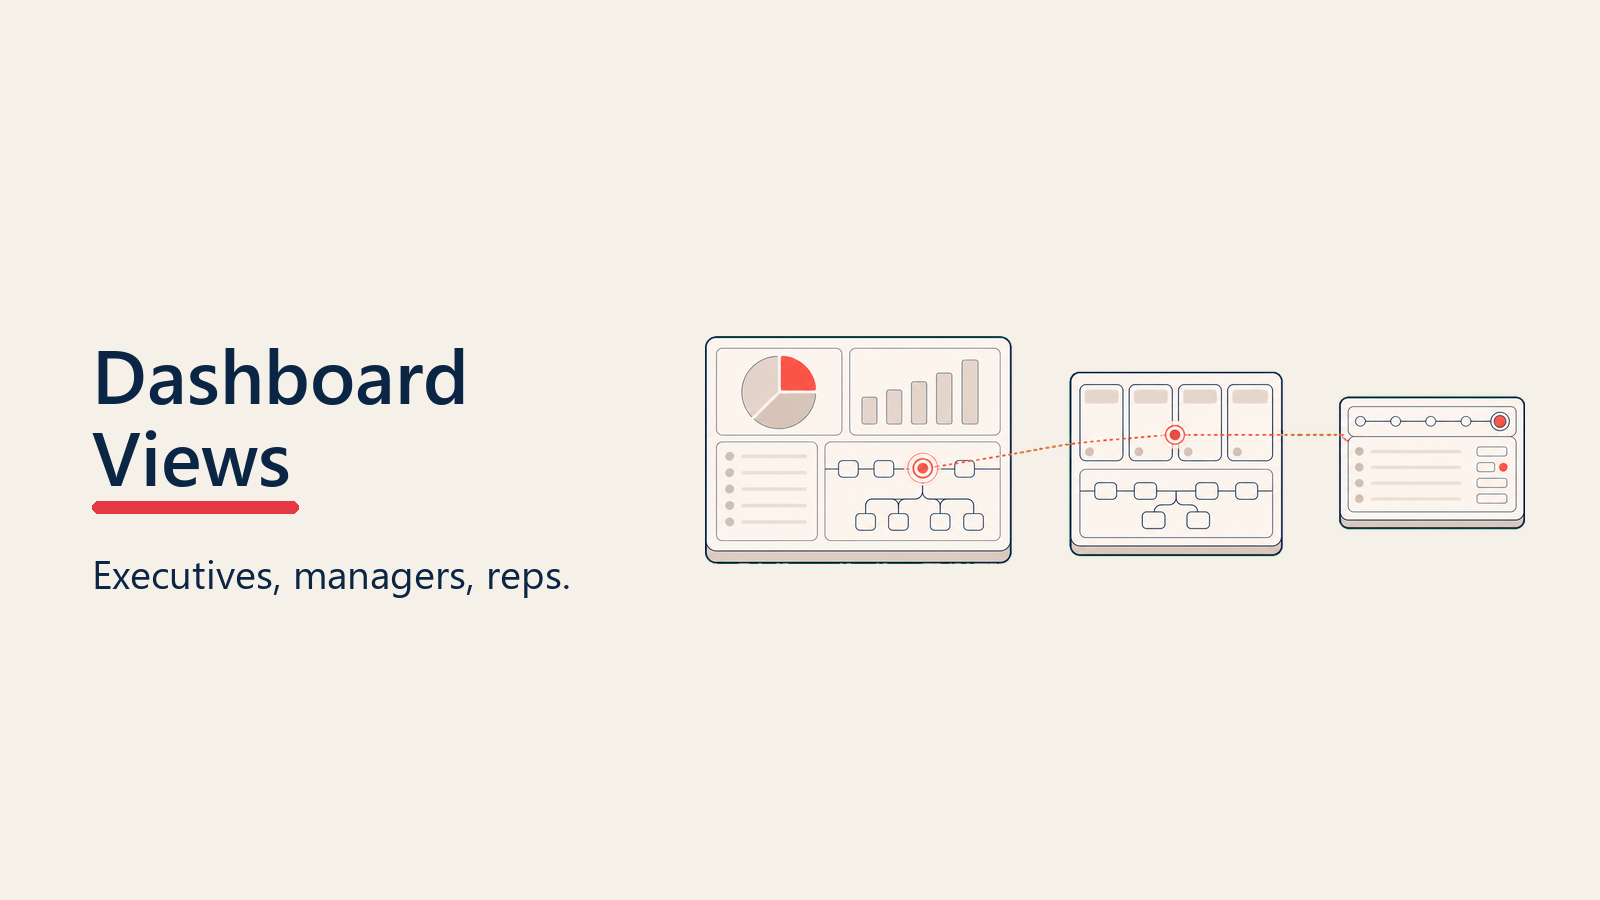
Dashboard Design: Tiga Tampilan untuk Tiga Audiens
Pipeline metrics yang efektif membutuhkan dashboard yang dirancang khusus untuk audiens yang berbeda. Satu dashboard tidak bisa melayani semua orang.
Executive View: Kesehatan Strategis
Audiens: CEO, CRO, Board
Frekuensi update: Bulanan (beberapa metrik mingguan)
Metrik kunci:
- Closed revenue vs target (saat ini dan tren)
- Pipeline coverage ratio
- New pipeline created (periode ke periode)
- Weighted pipeline value
- Win rate (keseluruhan dan per segmen)
- Tren sales velocity
Prinsip desain:
- Ringkasan tingkat tinggi dengan kemampuan drill-down
- Trend line yang menunjukkan riwayat 6-12 bulan
- Indikator status RAG (Merah/Kuning/Hijau)
- Minim gangguan visual, maksimal sinyal
Fokus tindakan: Alokasi sumber daya strategis, investasi demand generation, positioning pasar
Manager View: Kinerja Tim
Audiens: Sales manager, sales operations
Frekuensi update: Mingguan
Metrik kunci:
- Pipeline per rep (total dan weighted)
- Win rate per rep dan segmen
- Stage-to-stage conversion rates
- Rata-rata sales cycle per rep
- Metrik aktivitas (call, meeting, proposal)
- Persentase deal stagnan
- New pipeline creation per rep
Prinsip desain:
- Tampilan komparatif (rep vs rep, tim vs target)
- Drill-down ke daftar opportunity individual
- Tren mingguan dan variansi dari baseline
- Exception reporting (underperformer disorot)
Fokus tindakan: Peluang coaching, deal review, alokasi sumber daya, manajemen kinerja. Pipeline review yang rutin mengubah metrik ini menjadi perbaikan tim yang nyata.
Rep View: Akuntabilitas Individual
Audiens: Sales representative individual
Frekuensi update: Harian/real-time
Metrik kunci:
- Nilai pipeline personal (total dan weighted)
- Jumlah open opportunity per tahap
- Deal yang perlu ditindaklanjuti hari ini
- Durasi tahap untuk deal yang sedang berjalan
- Win rate personal dan pencapaian kuota
- Pipeline coverage untuk kuartal berjalan
- Penyelesaian aktivitas (terhadap target)
Prinsip desain:
- Berorientasi tindakan (apa yang harus dilakukan hari ini)
- Ramah perangkat mobile
- Update real-time
- Elemen gamifikasi (progress bar, pencapaian)
Fokus tindakan: Prioritas harian, kemajuan deal, penyelesaian aktivitas, pelacakan kuota
Metric Pitfalls: Apa yang Harus Dihindari
Bahkan metrik yang baik pun bisa disalahgunakan. Waspadai jebakan umum berikut:
Vanity Metrics
Metrik yang terlihat mengesankan tetapi tidak mendorong keputusan apa pun.
Contoh:
- Total pipeline value tanpa konteks
- Jumlah aktivitas tanpa kaitan dengan konversi
- Jumlah deal tanpa mempertimbangkan value atau kualitas
Solusi: Selalu pasangkan volume metrics dengan quality dan conversion metrics.
Gaming the System
Metrik bisa mendorong perilaku buruk ketika rep mengoptimalkan pengukuran, bukan hasil.
Contoh:
- Sandbagging (menahan deal agar kuartal berikutnya lebih mudah)
- Pipeline padding (menggelembungkan nilai deal atau menambahkan deal yang kecil kemungkinan close)
- Kenaikan tahap yang prematur (memajukan deal sebelum benar-benar terkualifikasi)
Solusi:
- Ukur leading dan lagging indicator secara bersamaan
- Terapkan persyaratan pipeline hygiene (batas usia deal, persyaratan aktivitas)
- Beri bobot metrik secara tepat (win rate lebih penting dibanding volume pipeline)
Over-Optimization
Terlalu fokus pada satu metrik sehingga metrik lain terabaikan.
Contoh:
- Terobsesi dengan response time → follow-up jadi kuantitas di atas kualitas
- Mengoptimalkan win rate → memilih-milih deal, meleset dari target volume
- Memaksimalkan pipeline coverage → menumpuk pipeline yang tidak berkualitas
Solusi: Terapkan balanced scorecard yang mengukur di seluruh kategori (volume, quality, velocity, value).
Measurement Without Action
Memantau metrik secara rutin tetapi tidak pernah bertindak atas insight yang didapat.
Contoh:
- Menyadari conversion rate menurun tetapi tidak menyelidiki akar masalahnya
- Melihat pipeline coverage turun tetapi tidak menyesuaikan demand gen
- Mengidentifikasi variansi antar rep tetapi tidak melakukan coaching
Solusi: Setiap metric dashboard seharusnya memicu tindakan yang jelas pada ambang batas tertentu.
Ignoring Segmentation
Metrik agregat menyembunyikan pola penting.
Contoh:
- Win rate keseluruhan padahal enterprise dan SMB berkinerja sangat berbeda
- Rata-rata sales cycle padahal lini produk punya pola yang berbeda-beda
- Total pipeline padahal wilayah yang berbeda berada dalam kondisi yang berbeda
Solusi: Selalu segmentasikan berdasarkan dimensi yang relevan (segmen, rep, produk, wilayah, sumber). Segmentasi pipeline yang cermat memungkinkan analisis komparatif yang bermakna.
Conversion Rate Analysis: The Deep Dive
Meski sudah dibahas sekilas dalam quality metrics, conversion rate analysis layak mendapat perhatian khusus sebagai salah satu praktik analitis dengan daya ungkit tertinggi.
Pelajari lebih lanjut: Conversion Rate Analysis: Menemukan Kebocoran dalam Pipeline Anda
Kesimpulan: Ukur Apa yang Menggerakkan Revenue
Pipeline metrics bukan sekadar latihan akademis. Metrik ini adalah alat diagnostik yang mengungkap persis di mana mesin pendapatan Anda berhasil dan di mana ia mulai rusak.
Perusahaan yang konsisten mencapai target tidak punya tim penjualan ajaib atau keberuntungan waktu. Mereka punya disiplin pengukuran: memantau metrik yang tepat, menyegmentasikannya dengan benar, dan bertindak atas apa yang diungkapkannya.
Mulailah dengan yang mendasar:
- Volume metrics menjawab "Apakah pipeline kami sudah cukup?"
- Quality metrics menjawab "Apakah ini nyata?"
- Velocity metrics menjawab "Apakah kami efisien?"
- Value metrics menjawab "Berapa nilainya?"
Bangun dashboard untuk tiga audiens Anda. Eksekutif butuh sinyal strategis, manajer butuh analitik kinerja, rep butuh akuntabilitas harian.
Yang paling penting, hindari measurement theater. Pantau metrik karena metrik itu mendorong keputusan, bukan karena terlihat bagus di board deck.
Pipeline metrics yang Anda pantau menentukan hasil pendapatan yang Anda capai. Pilihlah dengan bijak.
Siap mengoptimalkan pipeline metrics Anda? Jelajahi bagaimana fundamental apa itu sales pipeline terhubung dengan kerangka pengukuran, dan pelajari bagaimana pipeline coverage analysis mengungkap apakah pipeline Anda sudah cukup untuk mencapai target.
Pelajari lebih lanjut:
- Pipeline Velocity: Metrik yang Menggabungkan Volume, Value, dan Kecepatan
- Weighted Pipeline: Melampaui Nilai Pipeline Kotor
- Conversion Rate Analysis: Menemukan Kebocoran dalam Pipeline Anda
- Forecasting Fundamentals: Membangun Prediksi Pendapatan yang Akurat
- Pipeline Bottleneck Analysis: Mengidentifikasi dan Mengatasi Hambatan

Senior Operations & Growth Strategist
On this page
- Apa yang Membuat Pipeline Metric Benar-Benar Berguna?
- Empat Kategori yang Mencakup Semuanya
- Volume Metrics: Kuantitas dan Aliran
- Quality Metrics: Konversi dan Win Rate
- Velocity Metrics: Kecepatan dan Efisiensi
- Value Metrics: Ukuran dan Potensi Pendapatan
- Volume Metrics: Memahami Kuantitas Pipeline
- Total Pipeline Value
- Pipeline by Stage
- New Pipeline Created (Periode ke Periode)
- Pipeline Adds vs Exits
- Open Opportunities Count
- Quality Metrics: Mengukur Konversi dan Win Rate
- Stage-to-Stage Conversion Rates
- Overall Win Rate
- Win Rate by Segment, Rep, dan Product
- Loss Analysis and Reasons
- Deal Quality Score
- Velocity Metrics: Melacak Kecepatan dan Efisiensi
- Average Sales Cycle Length
- Time in Each Stage
- Pipeline Velocity
- Deal Acceleration and Deceleration
- Stagnant Deal Percentage
- Value Metrics: Memahami Ekonomi Deal
- Average Deal Size
- Deal Size Distribution
- Weighted Pipeline Value
- Pipeline Coverage Ratio
- Expected Revenue (Probability-Adjusted)
- Leading vs Lagging Indicators: Apa yang Memprediksi vs Apa yang Melaporkan
- Leading Indicators: Apa yang Akan Segera Terjadi
- Lagging Indicators: Apa yang Sudah Terjadi
- Pendekatan Dashboard yang Seimbang
- Metric Benchmarks by Industry and Segment
- B2B SaaS Benchmarks
- Enterprise Software and Services
- Variasi Antar Industri
- Dashboard Design: Tiga Tampilan untuk Tiga Audiens
- Executive View: Kesehatan Strategis
- Manager View: Kinerja Tim
- Rep View: Akuntabilitas Individual
- Metric Pitfalls: Apa yang Harus Dihindari
- Vanity Metrics
- Gaming the System
- Over-Optimization
- Measurement Without Action
- Ignoring Segmentation
- Conversion Rate Analysis: The Deep Dive
- Kesimpulan: Ukur Apa yang Menggerakkan Revenue