What is eNPS (Employee Net Promoter Score)? How to Measure and Use It
Turn this article into takeaways for your work.


Each assistant summarizes the article only for you and suggests best practices for your work.
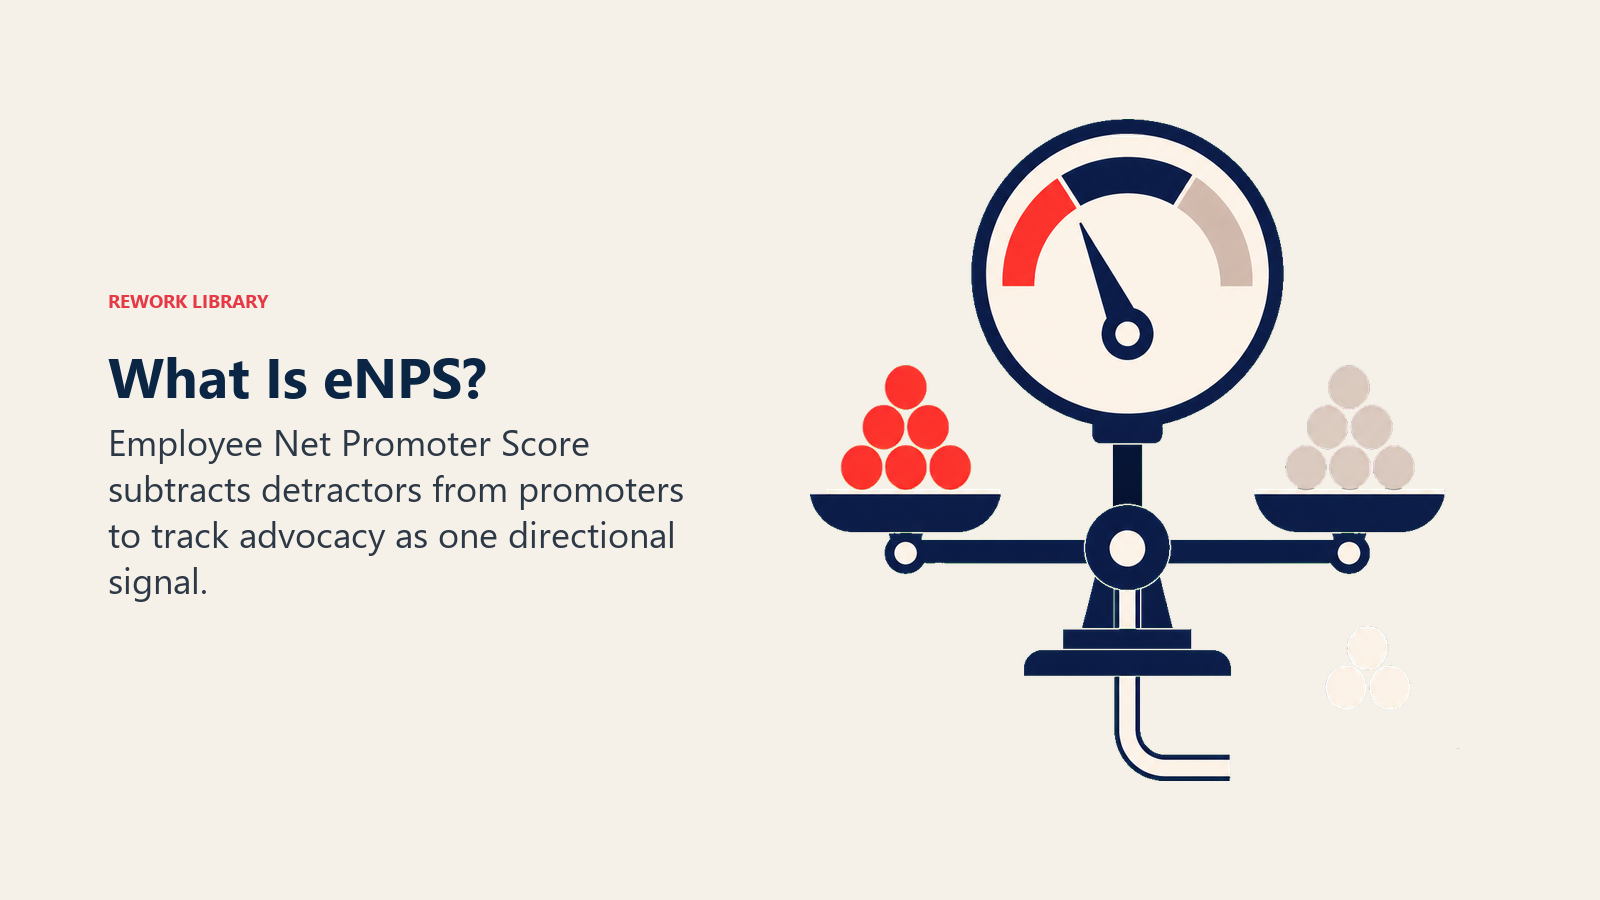
eNPS, or Employee Net Promoter Score, is a single-question survey metric that asks employees how likely they are to recommend their company as a place to work, on a scale of 0 to 10. Subtract the percentage of detractors (people who answer 0 to 6) from the percentage of promoters (9 to 10), and the result is a score from negative 100 to positive 100.
That's the whole instrument. No section on management, no questions about pay, just one number trying to compress an entire employee experience into a single, trackable data point. It's popular for exactly that reason: cheap to run, fast to answer, easy to put on a slide. It's also, on its own, close to useless for figuring out what to actually fix, which is the part most eNPS explainers skip.
Where eNPS Comes From
eNPS is a direct adaptation of Net Promoter Score, the customer loyalty metric Fred Reichheld introduced at Bain & Company in a 2003 Harvard Business Review article titled "The One Number You Need to Grow." Reichheld's insight was that one question, "how likely are you to recommend us to a friend or colleague," predicted repeat business better than long, complicated satisfaction surveys did.
HR teams borrowed the same logic and pointed it inward: instead of asking customers whether they'd recommend a product, eNPS asks employees whether they'd recommend the employer. The math is identical. Only the audience changed.
How to Calculate eNPS
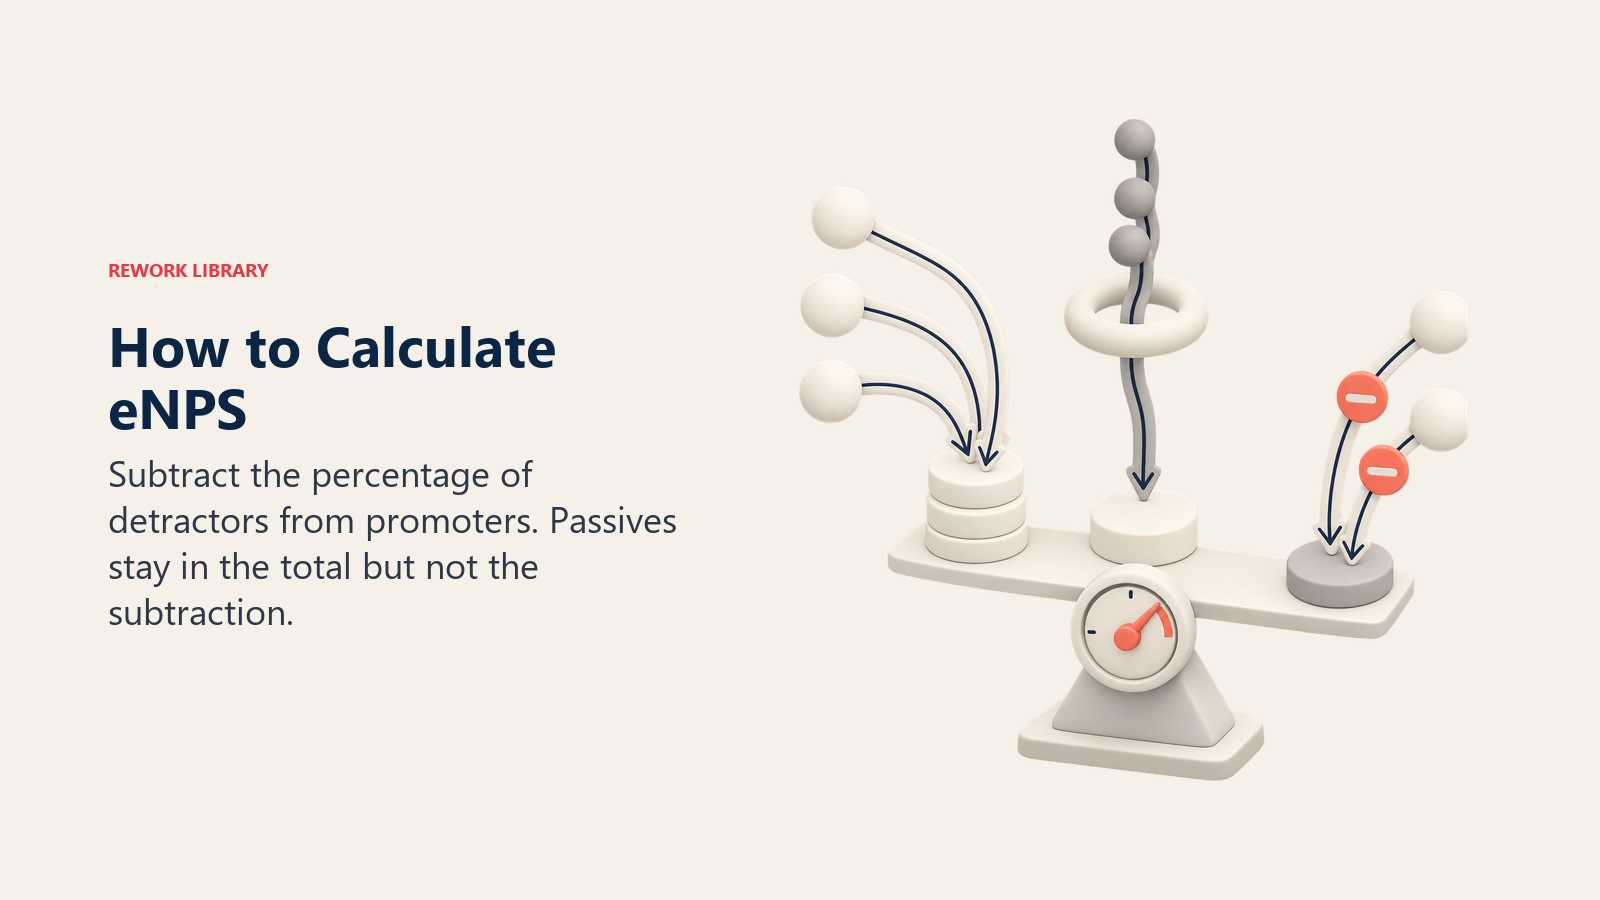
Every eNPS survey starts with the same core question, usually phrased something close to: "On a scale of 0 to 10, how likely are you to recommend [company] as a place to work?" Every respondent lands in one of three buckets based on that answer.
| Group | Score given | What it means |
|---|---|---|
| Promoters | 9 or 10 | Enthusiastic advocates who'd actively recommend the company |
| Passives | 7 or 8 | Satisfied enough, but not enthusiastic; won't hurt the score, won't help it either |
| Detractors | 0 to 6 | Unhappy enough that they wouldn't recommend the company, and may actively discourage others |
The formula is simple:
eNPS = % Promoters − % Detractors
Passives are counted in the total respondent pool (they affect what percentage everyone else represents) but they don't appear in the final subtraction. That's a deliberate design choice inherited from customer NPS: a "meh" answer isn't treated as a vote either way.
A Worked Example
Say 100 employees respond to the survey. Fifty answer 9 or 10, thirty answer 7 or 8, and twenty answer 0 to 6.
| Group | Respondents | % of total |
|---|---|---|
| Promoters (9-10) | 50 | 50% |
| Passives (7-8) | 30 | 30% |
| Detractors (0-6) | 20 | 20% |
eNPS = 50% − 20% = 30
That 30 is the score you'd report and track over time. Notice what disappeared from the calculation: the thirty passive respondents, a third of the company, contribute nothing beyond shrinking the denominator. eNPS is already flattening most of the room into a single silent group.
What Is a Good eNPS Score?
There's no single, universally agreed cutoff, and anyone who quotes one number as "the" industry standard is oversimplifying a metric that varies a lot by data source, industry, and company size. That said, most benchmark sources converge on a similar shape:
| Score range | General interpretation |
|---|---|
| Below 0 | More detractors than promoters; treat as a warning sign |
| 0 to 10 | A modest positive balance, nothing to celebrate yet |
| 10 to 30 | Healthy advocacy; a generally positive employee experience |
| 30 to 50 | Strong engagement |
| Above 50 | Exceptional, with a clear majority of employees actively recommending the company |
The actual averages cited vary more than those bands suggest, which is itself the lesson. Perceptyx, drawing on more than 20 million employee responses, puts the global average in the low-to-mid 20s. SurveyMonkey's industry benchmarking found an overall average of 27, with technology at 28 and hospitality at 30 on one end, retail at negative 5 and government at negative 15 on the other. Company size mattered too: small companies under 250 employees averaged 30, versus just 9 at organizations above 5,000 employees.
A single "good eNPS" doesn't exist across industries, sizes, and sources with enough consistency to chase as a target. Your own trend, quarter over quarter, tells you far more than any cross-industry average.
Key Facts
- The global eNPS benchmark has stabilized in the low-to-mid 20s, across a database of more than 20 million employee responses. Source: Perceptyx
- SurveyMonkey's industry benchmarking found an overall average eNPS of 27, from 30 in hospitality down to negative 15 in government. Source: SurveyMonkey
- Small companies (fewer than 250 employees) averaged an eNPS of 30, versus just 9 at organizations above 5,000 employees. Source: SurveyMonkey
- Net Promoter Score, the model eNPS adapts, was introduced by Fred Reichheld and Bain & Company in a 2003 Harvard Business Review article, "The One Number You Need to Grow." Source: Bain & Company
- Managers account for at least 70% of the variance in team engagement scores, a big reason a single company-wide eNPS can hide problems concentrated under specific managers. Source: Gallup
Why eNPS Is Popular: The Real Strengths
eNPS earns its place in a measurement toolkit for practical reasons, not because it's the most rigorous instrument available.
It's fast. One question takes seconds to answer, compared to the ten or fifteen minutes a full engagement survey demands, so you can run it far more often without wearing people out.
It's cheap to run continuously. Low response burden makes eNPS a workable monthly or biweekly pulse, something a full engagement survey is too heavy to sustain at that frequency.
It's easy to communicate. A single number that moves up or down is simple to put in front of a leadership team or a manager with five minutes between meetings, which is exactly why it gets adopted so widely.
It's a decent early-warning trigger. A sharp drop after a reorg, a return-to-office mandate, or a leadership change is a legitimate signal to look closer, even if the number itself can't tell you what to look at.
The Real Limitations of eNPS
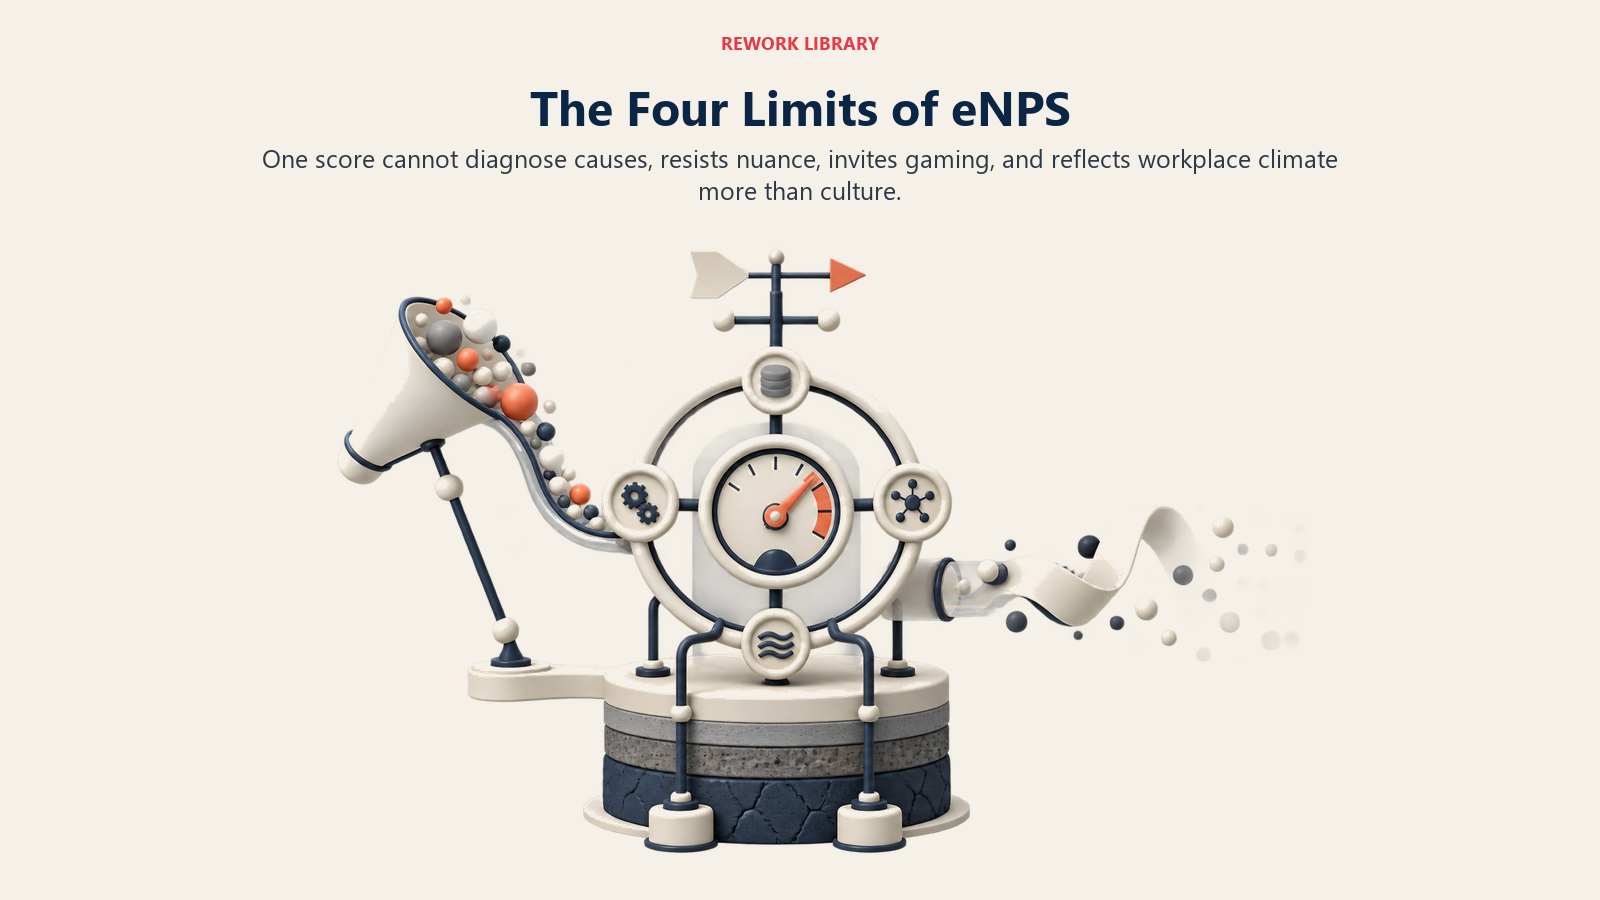
The strengths above are also, almost exactly, the sources of its weaknesses. What makes eNPS fast and simple also makes it shallow, and treating it as more than a pulse check is where most companies get into trouble.
One Number Can't Diagnose Anything
An eNPS score tells you the temperature is rising or falling. It cannot tell you why. A drop from 25 to 10 could mean a bad manager, a canceled benefit, or an unrelated industry downturn making everyone anxious, and the number looks identical in every case. Used alone, eNPS is a smoke alarm with no way to tell you which room is on fire.
The fix is structural: pair the 0-to-10 question with a short open-text follow-up, something as simple as "what's the main reason for your score?" Without that follow-up, eNPS becomes a vanity metric that looks good on a dashboard and explains nothing when someone asks what to do next.
It Can Be Gamed
Because eNPS is a single, high-visibility number, it attracts the same manipulation pressures customer-facing NPS programs have documented for years: managers nudging teams toward higher answers, leadership tying bonuses to the score, or quietly sampling only the most engaged employees. None of that requires bad intent. A manager who genuinely believes their team is fine can still create an environment where a 4 feels riskier to submit than a 7.
The safeguards are the same ones that protect any honest survey: real anonymity and never tying eNPS to individual manager bonuses. A team that has learned raising concerns carries a cost, the same dynamic covered in why teams stay silent in meetings, will produce an inflated eNPS that measures fear of candor more than actual satisfaction.
It Erases the Passives
A third of respondents in the worked example above, the passives, contributed nothing to the final score beyond shrinking the denominator. A workforce that's mostly passive can post the exact same eNPS as one split cleanly between fervent promoters and fervent detractors, and those are very different organizations to manage. eNPS collapses distribution into a single point, efficient for tracking but blind to shape.
It Measures Climate, Not Culture
"Would you recommend working here right now" is closer to a weather report than a climate reading, a current-mood question rather than a durable-values one, a distinction covered in more depth in organizational culture vs. climate vs. values. A company can have deep, well-functioning culture and still post a rough eNPS the month after a difficult layoff, and the reverse is just as possible.
How to Use eNPS Well
None of the limitations above mean eNPS is a bad metric. They mean it's a narrow one, and narrow tools work fine as long as you don't ask them to do a broad tool's job.
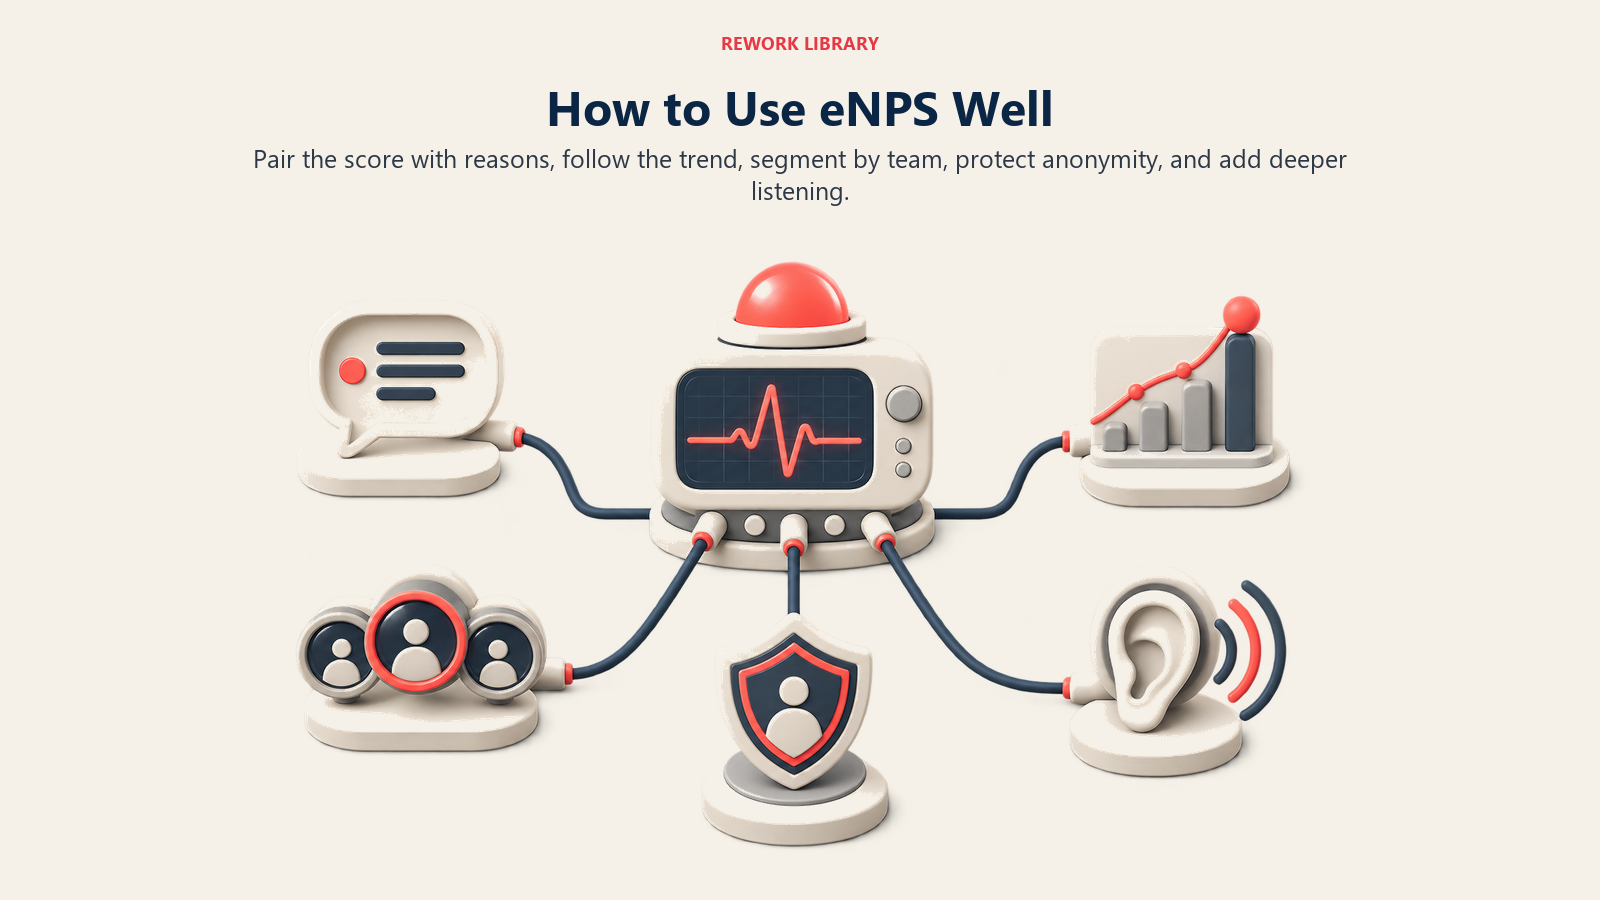
Always pair it with a "why." A one-line open-text field after the 0-to-10 question turns a mystery number into an actual signal.
Track the trend, not the absolute number. Given how much benchmark averages swing between sources, from the low-to-mid 20s Perceptyx reports to the 27 SurveyMonkey found, chasing an externally set target is close to meaningless. Your own eNPS three months ago is the fair comparison for your own eNPS today.
Cut it by team and manager, not just company average. A flat, healthy company-wide score can hide two or three teams in real trouble, the same blind spot that shows up across most company culture measurement. Since managers drive most of the variance in engagement, a manager-level breakdown is where it becomes actionable.
Keep it anonymous and disconnected from performance reviews. The moment eNPS feeds into a manager's bonus or a public ranking, expect the gaming pressure described above to show up, whether anyone intends it or not.
Run it often, but don't let it replace deeper listening. A monthly or quarterly pulse complements a periodic engagement survey, a feedback culture that catches nuance day to day, and the psychological safety that makes an honest answer feel safe to give. On its own, eNPS is a thermometer. Combined with the rest, it's a real diagnostic system, the layered approach culture and performance research consistently points to.
eNPS vs. Employee Engagement Survey
These two get confused constantly, partly because eNPS is sometimes bundled inside a longer engagement survey as one of its questions. They're not the same instrument, and they're not interchangeable.
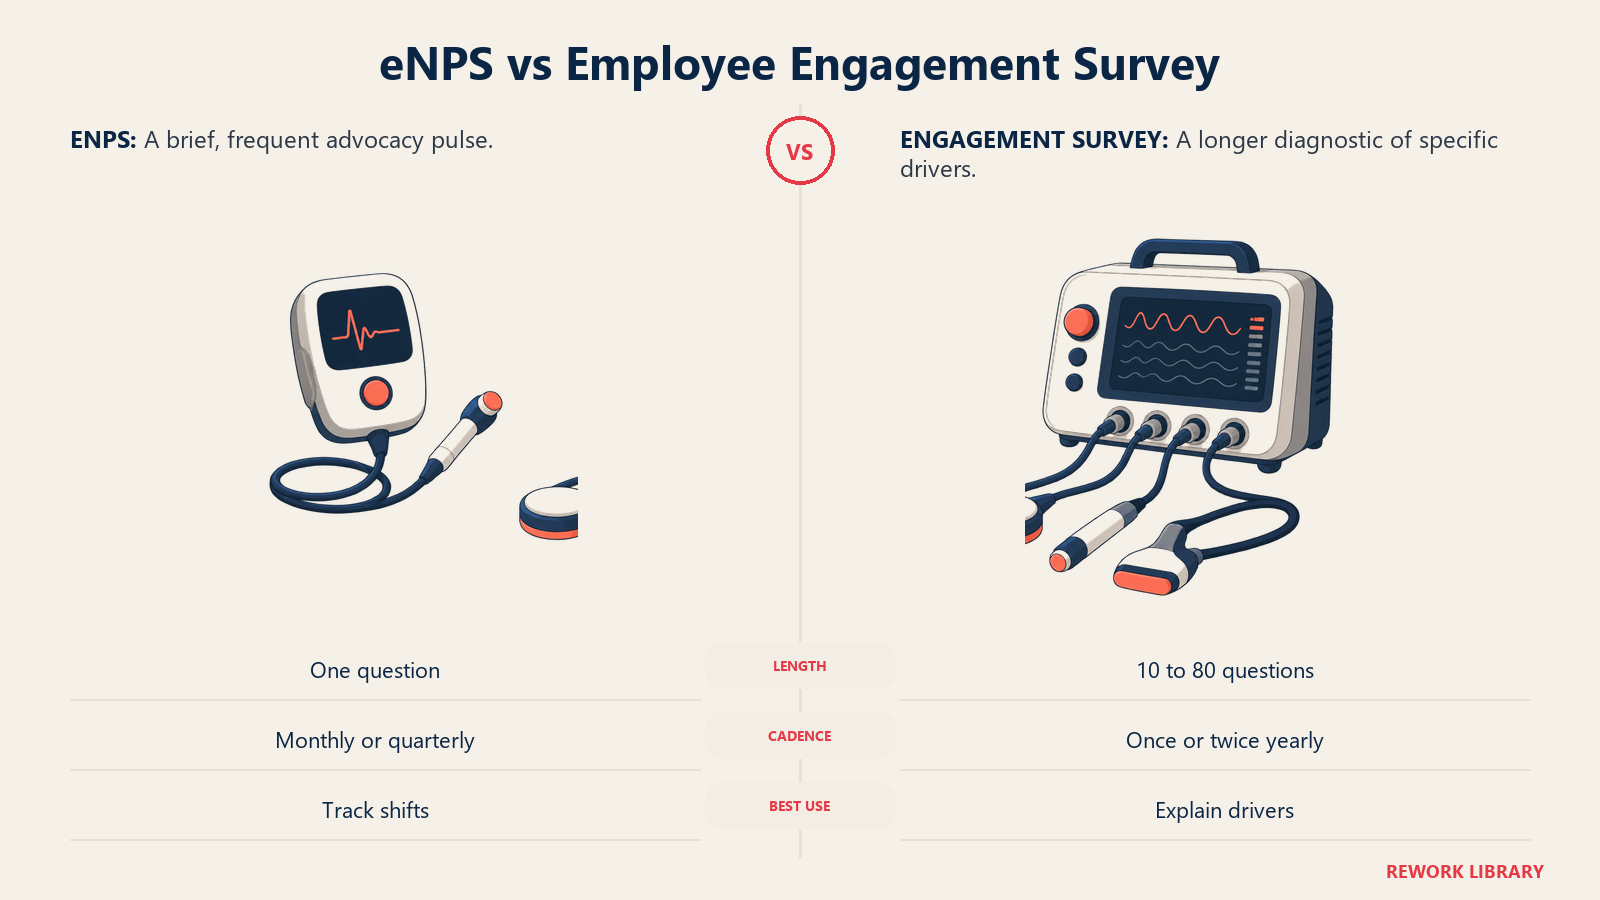
| Dimension | eNPS | Engagement survey |
|---|---|---|
| Length | One question, plus an optional follow-up | Typically 10 to 80 questions |
| Time to complete | Seconds | 5 to 20 minutes, sometimes longer |
| Ideal frequency | Monthly or quarterly pulse | One or two times a year, or shorter pulses in between |
| What it's good for | Fast trend-tracking, catching sudden shifts | Diagnosing specific drivers: management, growth, recognition, workload |
| What it misses | The "why" behind any movement | Frequency; too heavy to run every month without fatigue |
| Risk of gaming | Higher, given visibility and simplicity | Lower, but still present if results are never acted on |
The practical answer isn't "pick one." It's using eNPS as the fast, frequent pulse and a proper engagement survey as the periodic deep dive that explains what the pulse has been showing you all along. Most methods for measuring company culture work the same way: cheap and frequent, paired with occasional and thorough.
eNPS in the Age of AI
The one-question format was built for a workplace where every colleague being recommended is a person. That's starting to wobble. As AI copilots and agents take on more daily work, "would you recommend working here" quietly folds in a second question: would you recommend working somewhere that treats AI-assisted output as trustworthy and credits it fairly.
A few forward-looking teams now track a matched second question, something like "how likely are you to recommend how this company uses AI to a peer," alongside classic eNPS rather than folded into it. That surfaces a genuinely new source of dissatisfaction before it drags the main number down, and it connects directly to the harder problem covered in AI cultural debt: trust and fairness norms that erode quietly, long before any survey captures the damage.
Where to Go Next
eNPS is one instrument in a larger toolkit, not a replacement for it. From here:
- How to measure company culture, for the full method set eNPS fits inside: engagement surveys, the OCAI, focus groups, and behavioral signals
- What is business culture?, for the underlying models a metric like eNPS is trying to approximate
- Building a feedback culture, for the conditions that make an honest eNPS answer likely in the first place
- Talent density and psychological safety, for the leading-indicator behaviors worth watching alongside any pulse score
- An engagement survey agent can run the pulse and route the open-text follow-ups to the right manager automatically, which is most of the operational lift eNPS otherwise adds to an HR team's plate
Frequently Asked Questions about eNPS
What does eNPS stand for?
eNPS stands for Employee Net Promoter Score, a single-question metric adapted from customer Net Promoter Score. It asks employees how likely they are to recommend their company as a place to work on a 0-to-10 scale, then subtracts the percentage of detractors from the percentage of promoters.
What is a good eNPS score?
Most benchmark sources treat scores from 10 to 30 as healthy, 30 to 50 as strong, and above 50 as exceptional, though the exact averages vary a lot by industry, company size, and data source. Perceptyx puts the global average in the low-to-mid 20s, while SurveyMonkey's industry data found an overall average of 27 with a wide range underneath it. Comparing your own trend over time matters more than chasing any single external benchmark.
How do you calculate eNPS?
Group survey responses into promoters (scores of 9 or 10), passives (7 or 8), and detractors (0 to 6). The formula is eNPS equals the percentage of promoters minus the percentage of detractors. Passives count toward the total respondent pool but are not part of the final subtraction.
What's the difference between eNPS and an employee engagement survey?
eNPS is a single question designed for fast, frequent pulse-checking. An engagement survey is typically 10 to 80 questions designed to diagnose specific drivers like management quality, growth opportunities, and recognition. They serve different purposes and work best used together, not as substitutes for each other.
Can eNPS be manipulated or gamed?
Yes. Because it's a single, highly visible number, eNPS is vulnerable to the same pressures documented in customer-facing NPS programs: managers nudging teams toward higher answers, leadership tying bonuses to the score, or surveys effectively sampling only the most engaged employees. Real anonymity and keeping the score disconnected from individual performance reviews reduce that risk.
Is eNPS enough to diagnose a culture problem by itself?
No. eNPS tells you a number is moving, not why it's moving. It needs to be paired with an open-text follow-up question, cut by team and manager rather than company average, and supported by richer methods like focus groups or a full engagement survey to actually explain what's driving the trend.
Where did eNPS come from?
eNPS is adapted from Net Promoter Score, the customer loyalty metric Fred Reichheld introduced with Bain & Company in a 2003 Harvard Business Review article called "The One Number You Need to Grow." HR teams later applied the same one-question logic to employees instead of customers.
How often should a company run an eNPS survey?
Monthly or quarterly works well for most organizations, since the single-question format creates very little response fatigue compared to a full engagement survey. Use that frequent pulse to catch shifts early, and reserve a longer, more diagnostic survey for once or twice a year.
A single number was never going to capture something as layered as how people feel about where they work, and eNPS was never built to try. It's a fast pulse, useful because it's narrow: quick to run, easy to trend, honest about being a symptom check rather than a diagnosis. Paired with a "why," cut by team, and never tied to a bonus, it earns its place in a measurement toolkit. Used as the only instrument in the box, it tells you something is wrong long after everyone on the team already knew.

Co-Founder, Rework.com
On this page
- Where eNPS Comes From
- How to Calculate eNPS
- A Worked Example
- What Is a Good eNPS Score?
- Key Facts
- Why eNPS Is Popular: The Real Strengths
- The Real Limitations of eNPS
- One Number Can't Diagnose Anything
- It Can Be Gamed
- It Erases the Passives
- It Measures Climate, Not Culture
- How to Use eNPS Well
- eNPS vs. Employee Engagement Survey
- eNPS in the Age of AI
- Where to Go Next