How to Measure Company Culture: Methods, Metrics, and Surveys
Turn this article into takeaways for your work.


Each assistant summarizes the article only for you and suggests best practices for your work.
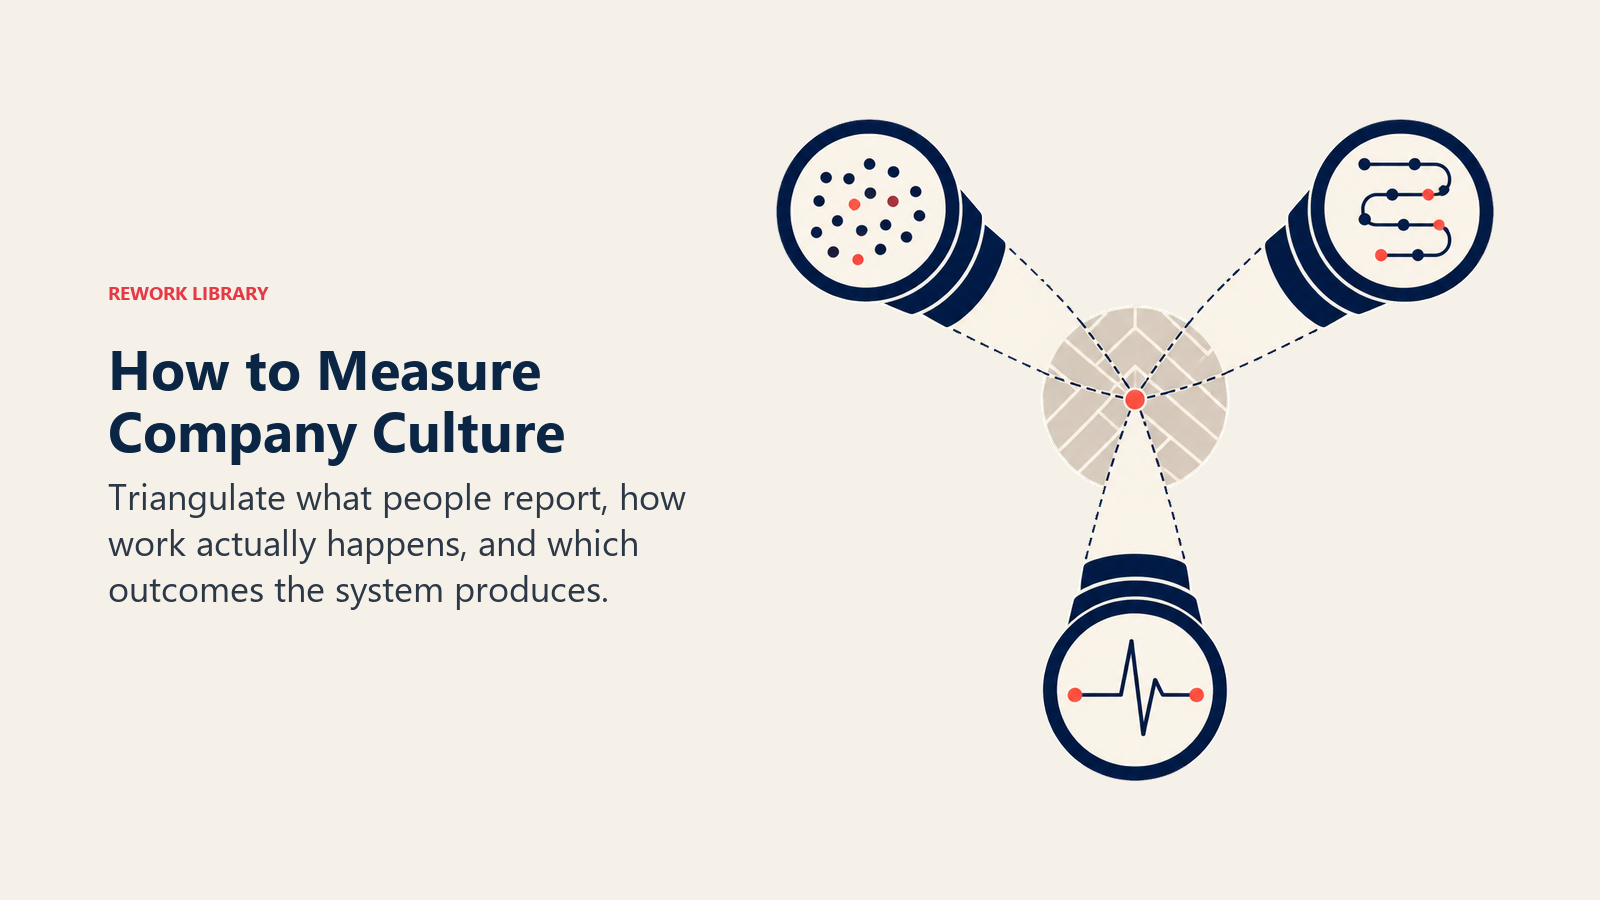
Measuring company culture means tracking the behaviors, attitudes, and outcomes that reveal how people actually work together, not just what the values poster says. In practice, that means combining a few tools: engagement and culture surveys, eNPS, structured diagnostics like the OCAI, focus groups, and behavioral signals such as turnover and meeting participation.
No single number captures culture, which is why so many companies measure nothing beyond an annual survey nobody reads the results of. That's a mistake. Business culture is a system of hiring, promotion, feedback, and unwritten rules, and systems can be observed even when they can't be reduced to one score. The goal here isn't a perfect instrument, it's a small, honest set of methods that tell you what's actually happening, against the noise of engagement theater and vanity dashboards.
Why Measure Culture at All
The short answer: you manage what you measure, and you drift on what you don't. Leaders who never formally measure culture still form an opinion about it, usually from the last hallway conversation or the last resignation letter that stung. That's not measurement, it's anecdote dressed up as intuition, and it consistently misses the parts of the organization furthest from the leader's own desk.
A team can look fine on every dashboard finance cares about (revenue on target, headcount on plan, no visible fires) while quietly rotting underneath: people stop raising problems in meetings, good performers start updating resumes months before anyone notices, and one manager's style drives out three capable hires in a row while nobody connects the dots. Measurement turns "something feels off" into "here's specifically what's off, and who owns fixing it."
There's a harder truth too: measuring culture is uncomfortable, because it surfaces things leadership would rather not confront, like a high performer whose team keeps quietly churning. That discomfort is the point. A system that only ever confirms what leadership already believes isn't measuring culture, it's measuring leadership's own blind spot back at them.
Key Facts
- Only 20% of employees worldwide were engaged at work in 2025, Gallup's lowest reading in over a decade, a gap the firm estimates costs the global economy roughly $10 trillion in lost productivity. Source: Gallup, State of the Global Workplace
- Managers account for at least 70% of the variance in team engagement scores, which is why measurement that stops at a company-wide average misses where the real problem lives. Source: Gallup
- The global average eNPS sits in the low-to-mid teens across Perceptyx's benchmark database of over 20 million responses, with scores above 30 considered strong and above 50 exceptional. Source: Perceptyx
- Just 7% of employees say their company sends too many surveys. The bigger driver of survey fatigue is the belief that answering never leads to visible change. Source: Culture Amp
- 65% of organizations say their culture needs to change significantly because of AI, but only 5% report great progress, a gap that starts with most companies never measuring AI's effect on people. Source: Deloitte, 2026 Global Human Capital Trends
- 40% of workers received AI-generated "workslop" in the past month, and senders were rated less trustworthy by the colleagues who had to clean it up, a hidden trust cost no adoption dashboard catches. Source: Harvard Business Review, September 2025
The Methods: What Each One Actually Measures
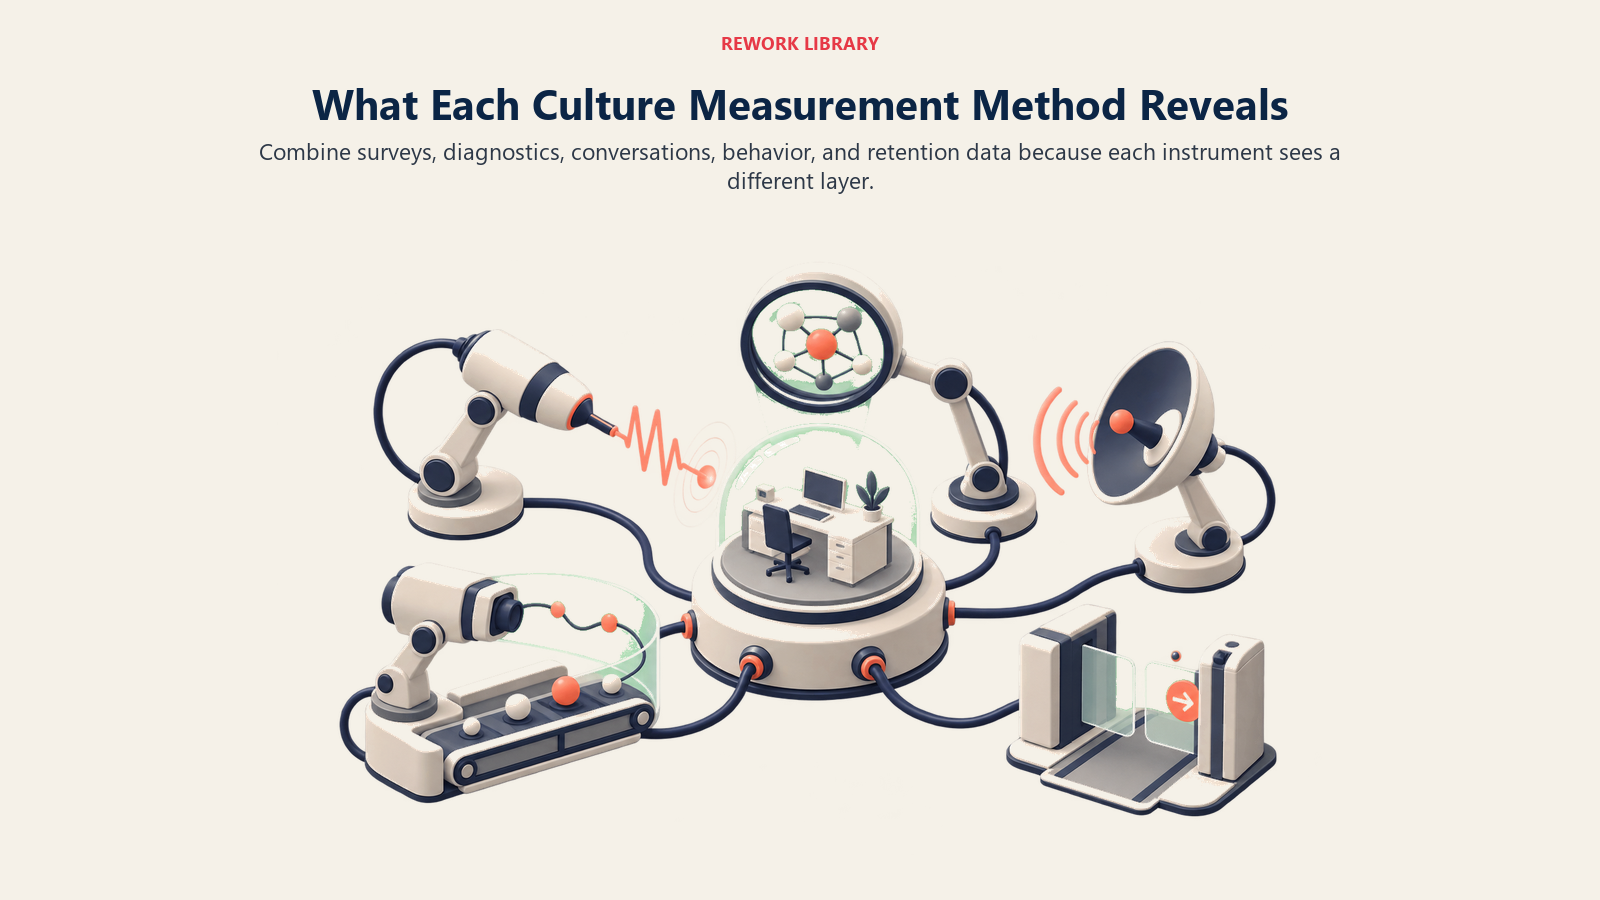
Culture shows up in different places: what people say when asked directly, what they do when nobody's watching, and what happens after they leave. A working measurement system pulls from all three.
Engagement and Culture Surveys
The most common tool, and the most misused. A well-built engagement survey asks a small, stable set of questions (Gallup's Q12 is the best-known example) about whether people know what's expected of them, have what they need to do their job, feel their opinions count, and have a chance to grow. Run consistently, the trend line matters more than any single score.
The trap is treating the survey as the whole system. An annual, 80-question survey that takes six weeks to analyze and never gets discussed with the team that filled it out is worse than no survey, because it teaches people feedback goes nowhere. Shorter, more frequent pulse surveys (quarterly or monthly, five to ten questions) hold response quality better than one long annual instrument, and they catch a problem while it's still small instead of a year later.
eNPS (Employee Net Promoter Score)
Adapted from customer NPS, eNPS asks one question: "How likely are you to recommend this company as a place to work, on a scale of 0 to 10?" Subtract the percentage of detractors (0 to 6) from the percentage of promoters (9 to 10) for a score from negative 100 to positive 100.
eNPS is cheap and easy to run often, which is its real value as a lightweight pulse you can track monthly without fatigue. It's a bad tool for diagnosis on its own: a single number tells you the temperature is dropping without telling you why. Pair it with a short open-text follow-up ("what's the main reason for your score?") or it becomes a vanity metric that looks good on a slide and explains nothing.
OCAI (Organizational Culture Assessment Instrument)
Built by Kim Cameron and Robert Quinn around their Competing Values Framework, the OCAI asks people to split 100 points across four culture types (clan, adhocracy, market, hierarchy) twice: once for how the organization operates now, and once for how it should operate. The gap between those two answers is the diagnostic, and it's one of the few instruments built to surface whether the current culture fits the strategy, rather than just whether people feel good about work.
Where a satisfaction survey tells you the mood, the OCAI tells you the shape. It's especially useful when leadership senses a mismatch (the company needs adhocracy-style speed, but everything about how it operates is stuck in hierarchy) but can't yet name it precisely.
Focus Groups and Listening Sessions
Small-group conversations, usually 6 to 10 people, run by someone the group trusts enough to be candid with, ideally not the group's own manager. Focus groups are where the "why" behind a survey number surfaces: a dip in a question about feeling heard means something specific happened, and a well-run session is often the fastest way to find out what, in language too nuanced for a rating scale.
The catch is selection bias and safety. If attendance is optional and the loudest voices dominate, or people suspect anything they say gets traced back to them, a focus group produces a comfortable story instead of an honest one, the same trust problem behind why teams stay silent in meetings.
Behavioral and Operational Signals
The methods above ask people what they think. This category watches what actually happens, which is harder to game and often more honest: voluntary turnover by team and manager (not just company-wide), internal mobility and promotion rates, who transfers away from a specific manager, meeting participation, offer-acceptance rates, and how often decisions get escalated versus made at the level closest to the work.
These signals rarely move in isolation. A manager whose team has low internal mobility, high voluntary attrition, and quiet meetings is showing you the same underlying problem three different ways. That triangulation, several independent signals pointing the same direction, is more reliable than any single number, survey or otherwise.
Exit Data and Stay Interviews
Exit interviews are the most commonly run and least commonly trusted culture data source, since people leaving have limited incentive to give brutally specific feedback to an employer they might need a reference from later. Treat exit themes as a lagging, directional signal: useful in aggregate across dozens of departures, unreliable as a verdict on any single manager from any single exit.
Stay interviews, the same structured conversation but with people who haven't decided to leave, tend to produce more actionable data, because the person still has a stake in the answer changing something. Asking a strong performer "what would make you consider leaving" while they're still engaged surfaces problems early enough to fix.
| Method | What it's good for | What it misses |
|---|---|---|
| Engagement survey | Trend over time, broad coverage, standardized benchmarking | The "why" behind a number; needs qualitative follow-up |
| eNPS | Fast, frequent pulse; easy to run often without fatigue | Diagnosis; one number can't explain a shift |
| OCAI | Whether current culture fits current strategy | Day-to-day experience; it measures type, not mood |
| Focus groups | Nuance and context behind a survey signal | Selection bias; requires real psychological safety to be honest |
| Behavioral signals | Hard to fake; catches what people won't say out loud | Requires manager-level data, not just company averages |
| Exit data | Aggregate patterns across many departures | Individual accounts are biased and often incomplete |
| Stay interviews | Early warning while someone can still be retained | Only covers people willing to have the conversation |
Leading vs. Lagging Indicators of Culture
Treating every culture metric the same way is a common and costly mistake. Some numbers tell you where you've already been. Others tell you where you're headed, in time to change course.
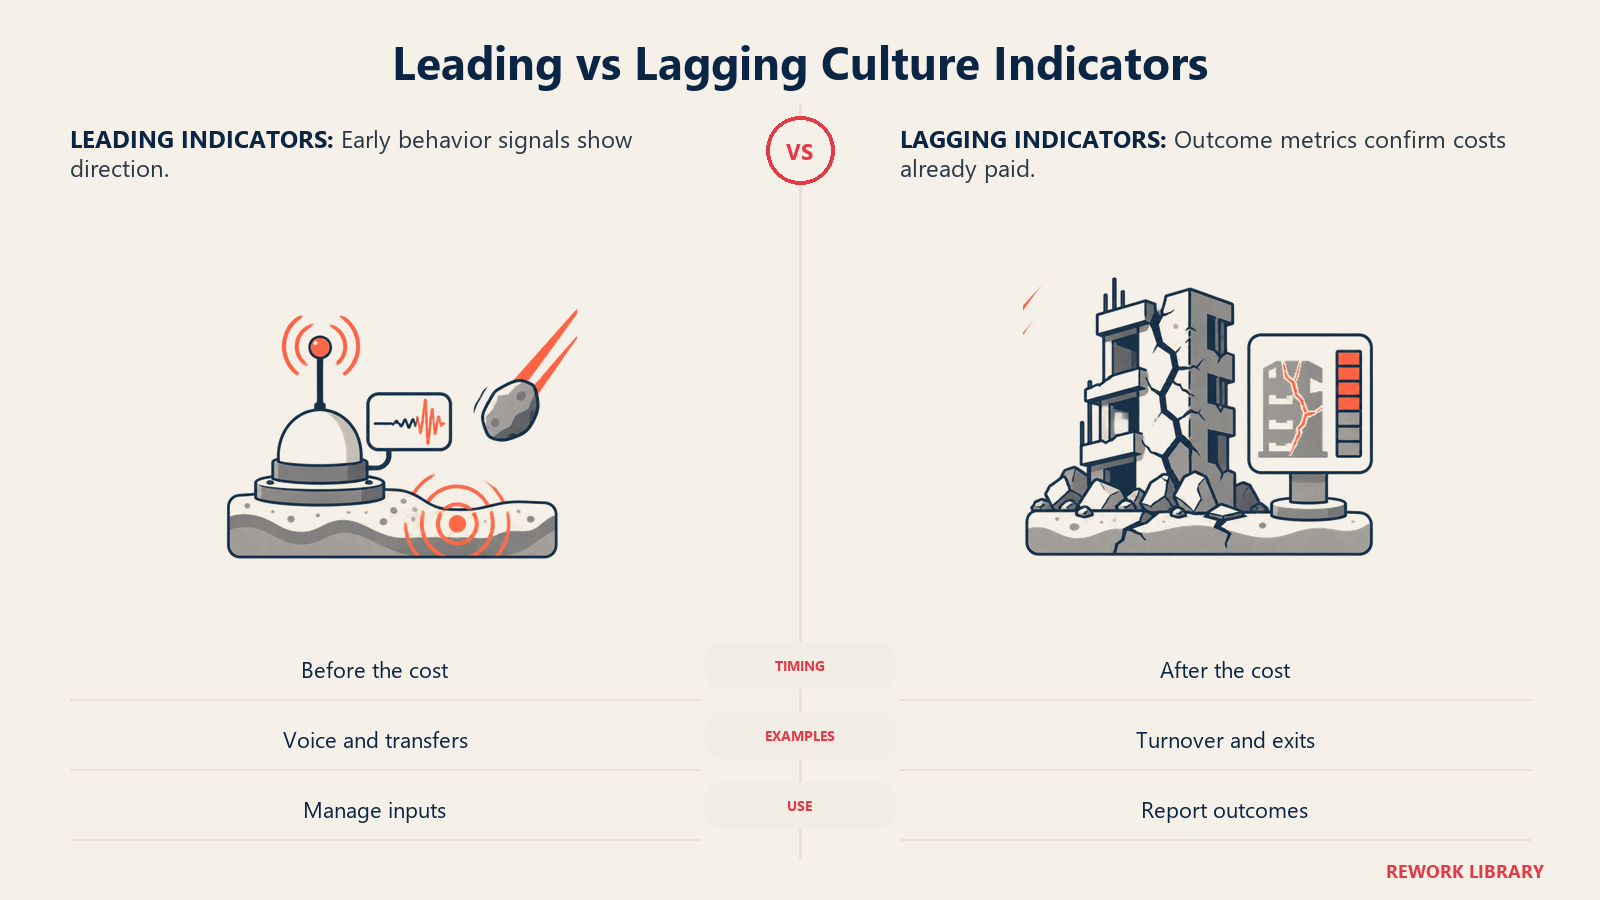
Lagging indicators confirm a problem after it has already cost you something: voluntary turnover, eNPS after a bad quarter, exit interview themes, an annual engagement score. Still worth tracking, since a trend across periods is real evidence, but by the time one moves, the cause has usually been building for months.
Leading indicators move earlier, closer to the behaviors that eventually produce the lagging result: transfer requests away from a specific manager, a drop in meeting participation, a declining pulse-survey score on "I feel comfortable raising concerns," or rising time-to-decision. Talent density and candor is a good example: teams where people speak up early tend to catch issues before they compound into the kind of dysfunction that eventually shows up as attrition.
The practical version, borrowed from how teams already think about OKRs versus KPIs: lagging indicators are the scoreboard you report on; leading indicators are the inputs you can actually manage week to week. A good metrics practice tracks both, rather than defaulting to whichever number is easiest to pull from an HRIS export.
Turning Culture Data Into Action
Data that never changes a decision is worse than no data, because it burns the trust needed to collect data honestly next time. The single biggest predictor of whether a measurement program helps or backfires is whether people can see a line from "I answered a survey" to "something visibly changed."
Close the loop, every time, even when the answer is no. Tell people what the data showed and what you're doing, or explicitly not doing, about it. Silence after a survey reads as "nothing happened," even when something did.
Push accountability to the level that can act. A company-wide score is nearly useless for driving change, since no one owns it. A team-level score, reviewed with that manager, is something a specific person can respond to, the same logic behind culture architecture: culture change happens through the systems a person controls, not a company-wide announcement.
Triangulate before you act on one number. A single bad survey question, exit interview, or eNPS dip is a prompt to look closer, not a verdict. Pair it with a focus group or stay interviews before committing to an expensive fix.
Build the cadence into the operating rhythm. Culture data reviewed once a year during a values refresh loses to this week's agenda every time. Lightweight, recurring listening (a five-question monthly pulse, a standing line in the quarterly business review) catches problems while they're cheap to fix. An engagement survey agent that runs pulse checks and routes themes to the right manager makes that cadence sustainable without added headcount.
Common Pitfalls
Survey fatigue that isn't really about surveys. Employees don't usually quit answering because they've been asked too often. They quit because the last three times told the organization something and nothing changed. Fix the action gap before the survey length.
Vanity metrics that measure participation, not truth. A 95% completion rate feels good in a leadership deck and tells you almost nothing about honesty, especially if people don't trust their answers are anonymous. Flat, uniformly positive scores paired with high response rates are often a sign of caution, not health.
One instrument standing in for the whole system. eNPS alone, or an annual survey alone, will eventually mislead you, because each method has a specific blind spot. Combine them and cross-check rather than choosing one as a replacement for the last.
Measuring the company average and ignoring the manager-level spread. Culture problems concentrate under specific managers more often than they spread evenly. Cut every metric by team and manager, or a flat, healthy average will keep hiding two or three teams in real trouble.
Treating the measurement as the intervention. A culture audit changes nothing by itself. It only pays off when followed by the harder work of adjusting hiring, promotion, and accountability systems.
Measuring AI Cultural Debt: The Metric Most Leaders Forget
Every method above was built for a workplace where the person producing the work was, by default, a person. That assumption is shakier than most measurement systems have caught up to.
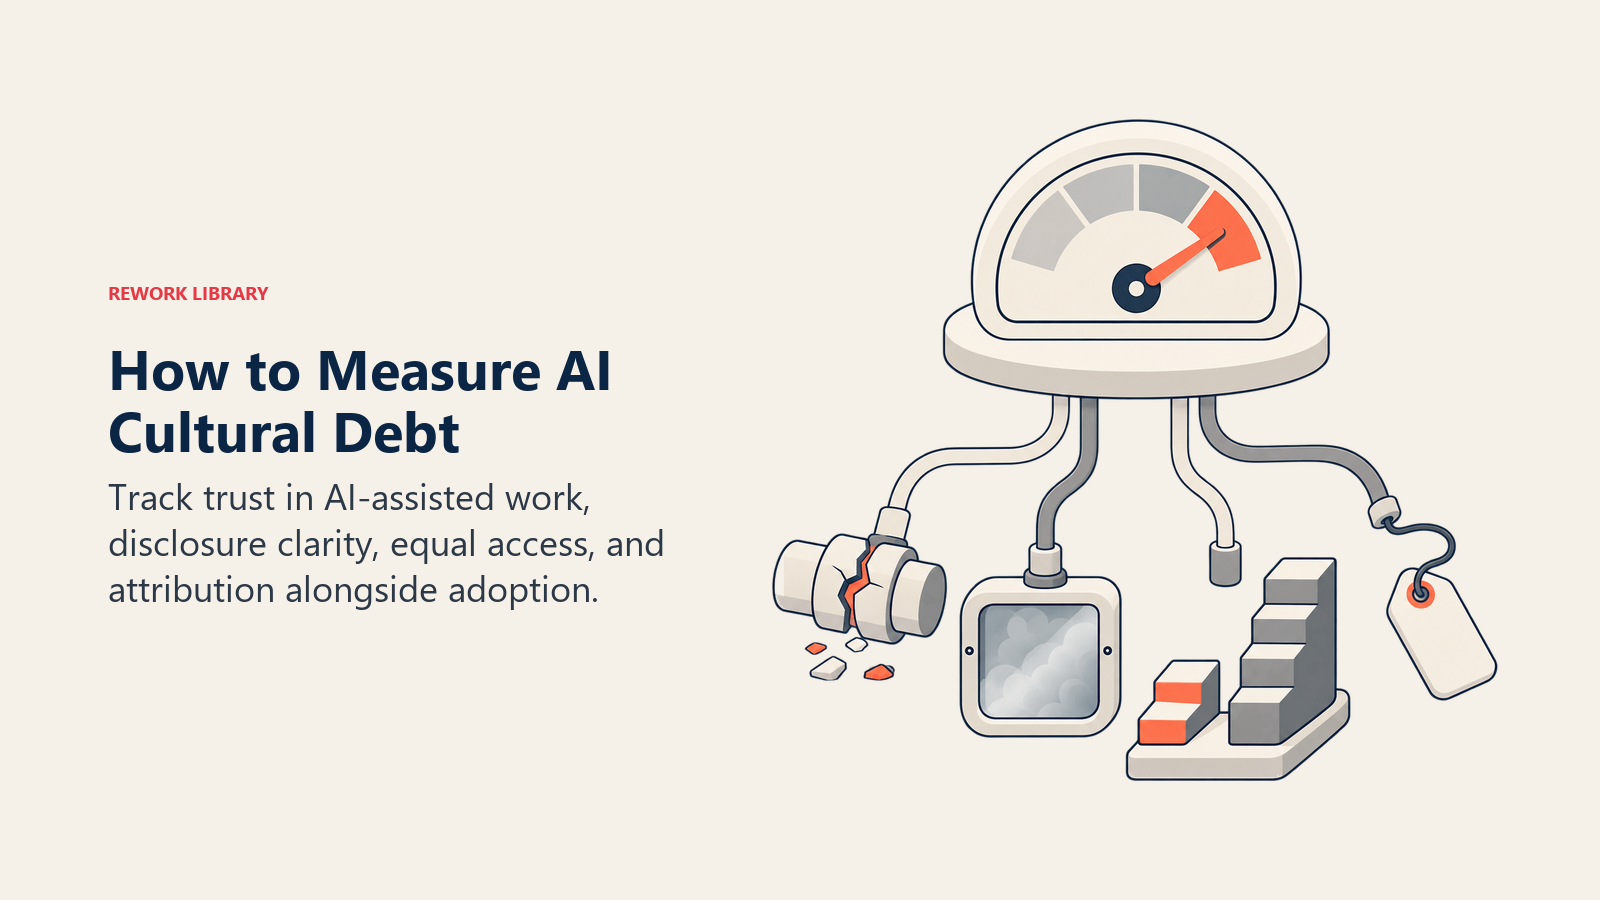
AI cultural debt is the quiet erosion of trust, fairness, ownership, and accountability norms that builds up when AI tools roll out without anyone tracking their effect on how people work together. It doesn't show up on an adoption dashboard, because adoption rate and productivity metrics were never built to catch it. A team can hit every AI rollout target on the scorecard while trust between teammates quietly frays underneath.
Four specific things are worth adding to whatever measurement a team already runs: trust in AI-assisted work (do people trust a colleague's output the same amount when they suspect it's AI-assisted, a gap most engagement surveys never ask about), disclosure norms (is there a clear, shared answer to when AI use gets flagged, since ambiguity here erodes fairness more than the AI use itself), unequal access (does everyone have the same AI tools, licenses, and training, or has access quietly become a new axis of inequality), and attribution and credit (when a proposal reads well, is it clear whose judgment produced it, since murky attribution erodes the psychological safety that lets people take real intellectual risks).
None of this requires a new platform. It requires adding a few specific questions to a pulse survey or focus-group agenda that already exists, and actually reviewing the answers instead of assuming a healthy adoption number means the human side of the rollout is healthy too. The organizations paying down AI cultural debt early are the ones who measured it before an engagement survey forced the issue a year later.
Where to Go Next
Measuring culture is the diagnostic step, not the fix. Once you have a real read on what's happening, the harder work is changing the systems that produced it:
- What is business culture?, for the underlying models (Schein's three levels, the Competing Values Framework) this whole measurement toolkit is built to assess
- Culture architecture, for how leaders redesign the systems, hiring, promotion, recognition, that measurement tells you need to change
- Talent density and psychological safety, for the leading-indicator behaviors worth tracking before they show up as a lagging attrition number
- AI cultural debt, for the fuller playbook on measuring and paying down AI's effect on trust and fairness norms
Measuring culture will never produce a single, clean number the way a revenue dashboard does, and leaders who go looking for one usually end up with a metric that flatters them instead of one that tells them the truth. The methods above aren't a scorecard to fill out once a year. They're a set of instruments, each with a specific blind spot, that only become trustworthy when you run several together, cut the results by team instead of averaging them into comfort, and act on what they show you.

Co-Founder, Rework.com
On this page
- Why Measure Culture at All
- Key Facts
- The Methods: What Each One Actually Measures
- Engagement and Culture Surveys
- eNPS (Employee Net Promoter Score)
- OCAI (Organizational Culture Assessment Instrument)
- Focus Groups and Listening Sessions
- Behavioral and Operational Signals
- Exit Data and Stay Interviews
- Leading vs. Lagging Indicators of Culture
- Turning Culture Data Into Action
- Common Pitfalls
- Measuring AI Cultural Debt: The Metric Most Leaders Forget
- Where to Go Next