The Denison Organizational Culture Model: The 4 Traits Explained
Turn this article into takeaways for your work.


Each assistant summarizes the article only for you and suggests best practices for your work.
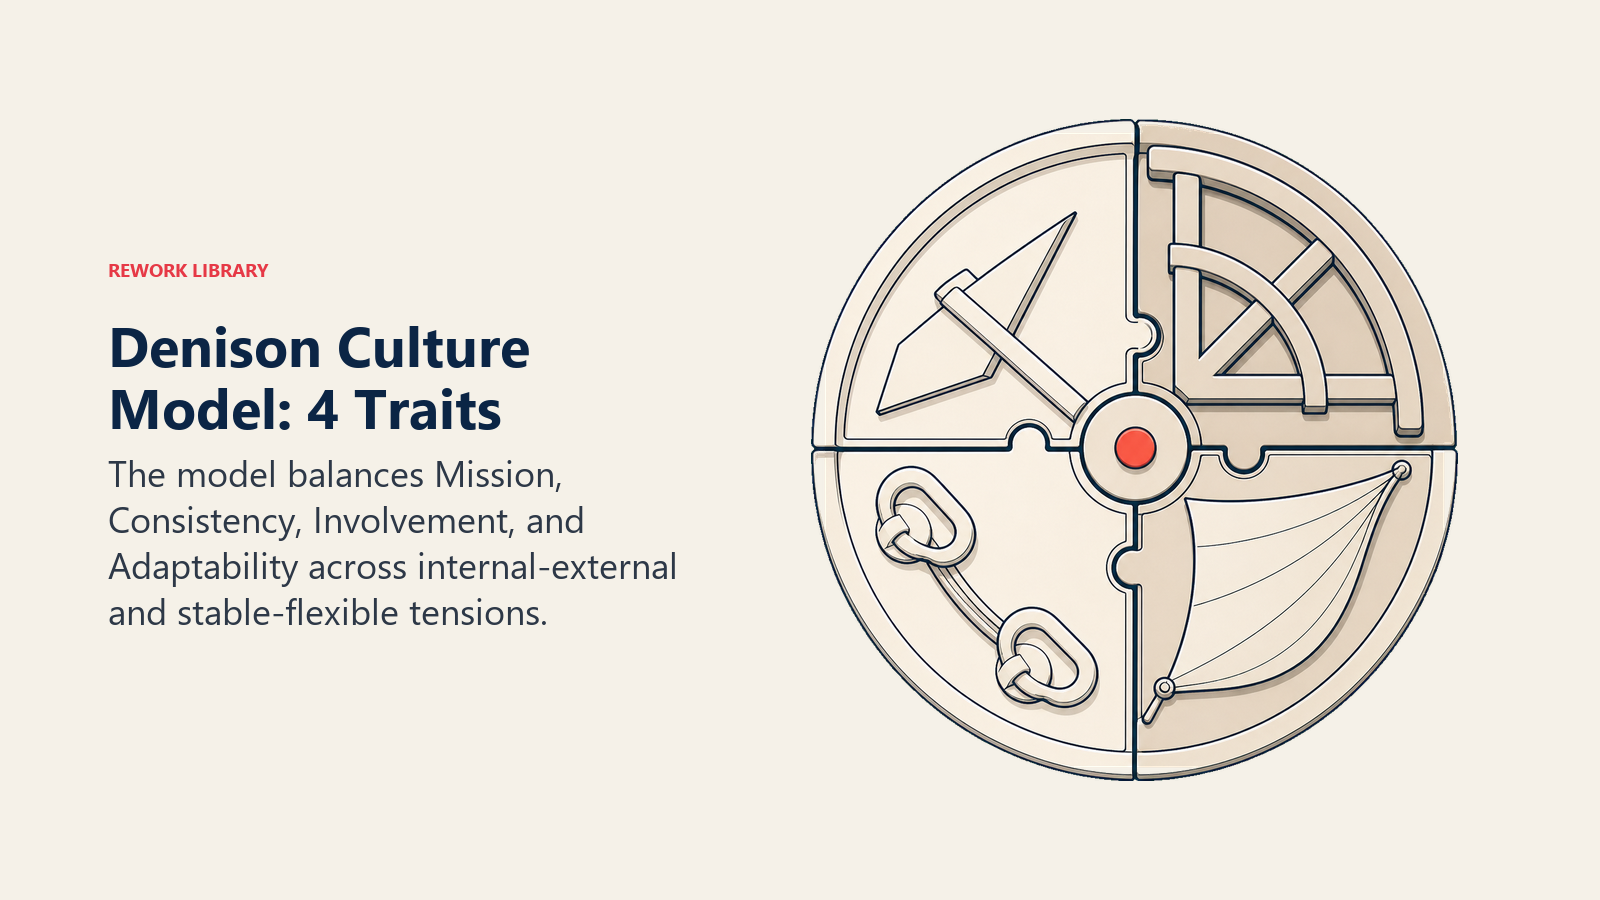
The Denison Organizational Culture Model measures culture across four traits, Mission, Consistency, Involvement, and Adaptability, plotted on two axes: internal versus external focus, and stable versus flexible. Built by researcher Daniel Denison, it argues effective organizations score well on all four, even though two of them pull in opposite directions.
That last part is the reason the model is worth knowing beyond the four-box diagram. Most culture frameworks describe a static type: you are a clan, you are a hierarchy, pick your quadrant and move on. Denison's model instead describes a running tension that never fully resolves. A company can have a rock-solid sense of mission and airtight internal consistency while its adaptability trait quietly withers, and the survey will show you exactly that gap in a number, not a vibe.
Where the Denison Model Came From
Daniel Denison built the model out of research, not a consulting workshop. His 1990 book Corporate Culture and Organizational Effectiveness laid the groundwork, and the theoretical case was formalized five years later in a peer-reviewed paper with Aneil Mishra, "Toward a Theory of Organizational Culture and Effectiveness," published in Organization Science in 1995. That paper is still the academic anchor researchers cite when they use the model in their own studies.
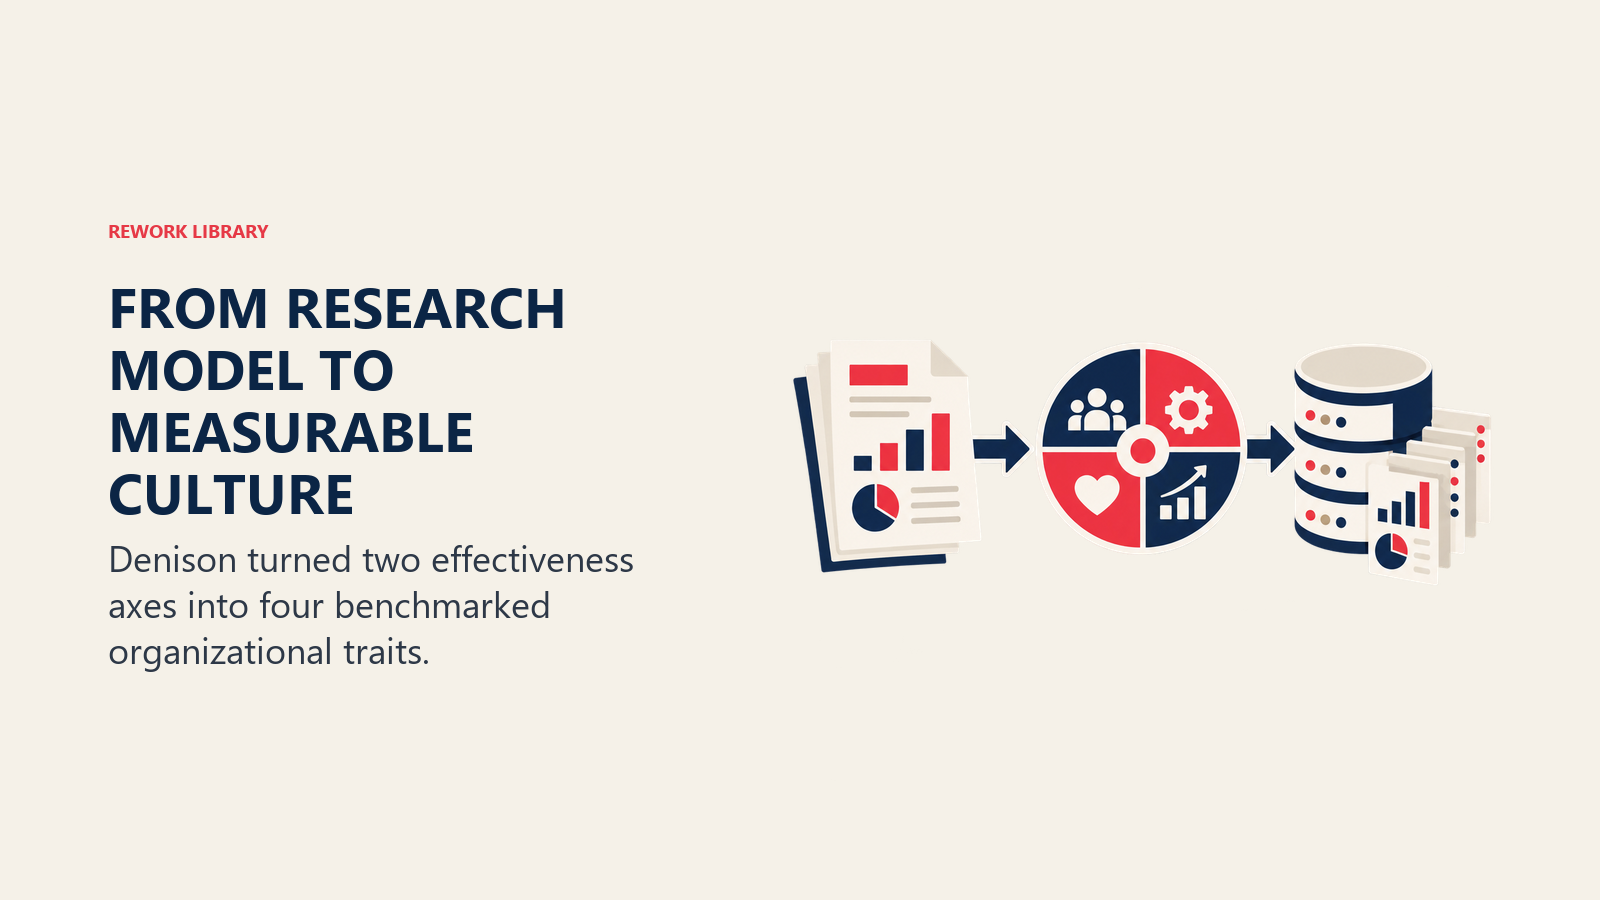
The model shares intellectual DNA with the Competing Values Framework. Both trace back to the same underlying insight from organizational effectiveness research: culture can be mapped along a stability-versus-flexibility axis and an internal-versus-external-focus axis. Where the Competing Values Framework uses those axes to sort culture into four named types (clan, adhocracy, market, hierarchy), Denison used them to build four measurable traits, each broken into indices you can score and benchmark. Same map, different instrument built on top of it.
Denison later founded Denison Consulting with William Neale to commercialize the survey, and the firm has spent more than two decades running it against real financial and operational outcomes across thousands of client engagements. That applied, benchmarked history is the model's main selling point over a purely academic framework: it was built to be measured against a database, not just discussed in a workshop.
The Two Axes and Four Traits
Everything in the model comes from crossing two questions about an organization.
Internal focus versus external focus. Does the culture's energy point inward, toward integration, systems, and how people work together, or outward, toward the market, customers, and competitors?
Stability versus flexibility. Does the culture prize consistency and predictable process, or does it prize the capacity to adapt and change quickly?
Cross those two axes and you get four quadrants, each anchored by one trait and one plain-language question:
| Trait | Axis position | Core question | Business link |
|---|---|---|---|
| Mission | External focus, stable | Do we know where we are going? | Profitability (ROI, ROS, ROE) |
| Adaptability | External focus, flexible | Are we listening to the marketplace? | Innovation, sales growth, market share |
| Involvement | Internal focus, flexible | Are our people aligned and engaged? | Quality, employee satisfaction |
| Consistency | Internal focus, stable | Does our system create leverage? | Coordination and predictable execution |
Each trait then breaks into three indices, each measured by four survey items, for 12 indices and 48 total questions across the instrument.
Mission: Direction, Purpose, and Blueprint
Mission covers whether the organization has a clear, shared sense of purpose and where it is headed. Its three indices are Strategic Direction and Intent, Goals and Objectives, and Vision. A weak Mission score usually shows up as strategy that changes every quarter, teams that cannot explain how their work ladders up to a company goal, and decisions that get relitigated because nobody agreed on the destination in the first place.
Consistency: Systems, Structures, and Processes
Consistency measures whether an organization's values, systems, and processes create real internal leverage rather than friction. Its indices are Core Values, Agreement, and Coordination and Integration. High Consistency looks like decisions made the same way across departments and a shared vocabulary for how things get done. Low Consistency looks like every team reinventing its own process and near-identical disputes resurfacing in every reorg.
Involvement: Commitment, Ownership, and Responsibility
Involvement measures how much the organization builds capability, empowers people, and organizes around teams rather than silos. Its indices are Empowerment, Team Orientation, and Capability Development. This is the trait most directly tied to whether people feel like owners of outcomes or just executors of instructions handed down from above.
Adaptability: Patterns, Trends, and the Market
Adaptability measures whether the organization is actually listening to its environment and can act on what it hears. Its indices are Creating Change, Customer Focus, and Organizational Learning. A culture can be internally cohesive and still miss a shifting market entirely if this trait is weak, because cohesion without external sensing just means everyone agrees confidently on the wrong thing.
Key Facts
- The Denison Organizational Culture Survey uses 48 items across 12 indices (three per trait, four items each) to produce a percentile score for every index against a global normative database. Source: Denison Consulting, Introduction to the Denison Model
- Denison Consulting's normative database includes more than 1,100 organizations and over 5 million survey participants across every major industry and inhabited continent. Source: Denison Consulting
- A study of 88,879 individuals across 137 public companies found Consistency interacts significantly with Mission, Adaptability, and Involvement in predicting market-to-book ratio and sales growth, evidence that the traits' effects on performance are not independent of each other. Source: Kotrba et al., Human Relations, 2012
- The model's theoretical foundation was formalized in Denison and Mishra's 1995 paper in Organization Science, one of the most cited papers linking culture traits to organizational effectiveness. Source: Denison & Mishra, Organization Science, 1995
- A published critique of the Denison Organizational Culture Survey notes it has no dedicated national-culture component and remains a proprietary instrument sold through Denison Consulting, both real limits on how it gets used. Source: The Denison Organizational Culture Survey (DOCS): A Culture Measurement Critique
- The rival Competing Values Framework's own diagnostic tool, the OCAI, has been used in more than 10,000 organizations and by over 100,000 individuals worldwide, a useful scale comparison for the two models. Source: Regent University
The Built-In Tension: Mission Against Involvement and Adaptability
Here is the part that makes Denison's model more than a four-box poster. It names two tensions leaders have to actively manage rather than resolve once and move on.
The first is between top-down direction and bottom-up ownership, represented by Mission on one side and Involvement on the other. Mission pulls toward a clear, stable, externally anchored sense of direction, usually set from the top. Involvement pulls toward empowerment and shared ownership at every level, which by definition means giving up some of that top-down control. Push too hard on Mission alone and you get a company that executes a clear strategy with a disengaged workforce that never internalizes why the strategy matters. Push too hard on Involvement alone and you get an empowered, engaged team with no shared direction to point that energy at.
The second tension sits between Adaptability and Consistency, the model's other diagonal. Adaptability wants change, experimentation, and fast response to the market. Consistency wants stable systems, shared values, and predictable execution. An organization that maximizes Adaptability without Consistency behind it turns into constant reinvention with no institutional memory, every project starting from zero. An organization that maximizes Consistency without Adaptability calcifies into a well-run machine building the wrong thing for a market that already moved on.
Denison's own research finding is that effective organizations do not resolve these tensions by picking a side. They score reasonably well on all four traits at once, which is a harder, less glamorous management task than declaring "we're an innovation culture" and calling it done. It is the same argument the Competing Values Framework makes from its own four-quadrant angle: every dimension genuinely costs you something on the opposite dimension, and the healthiest profile is a deliberate balance rather than a maximized extreme.
How the Denison Survey Actually Works
The Denison Organizational Culture Survey (DOCS) is the instrument built on top of the model. Employees answer all 48 items on a rating scale, and responses aggregate up into a circumplex report, the same four-quadrant, twelve-slice wheel shown in the model diagram, with each index displayed as a percentile score against the normative database.
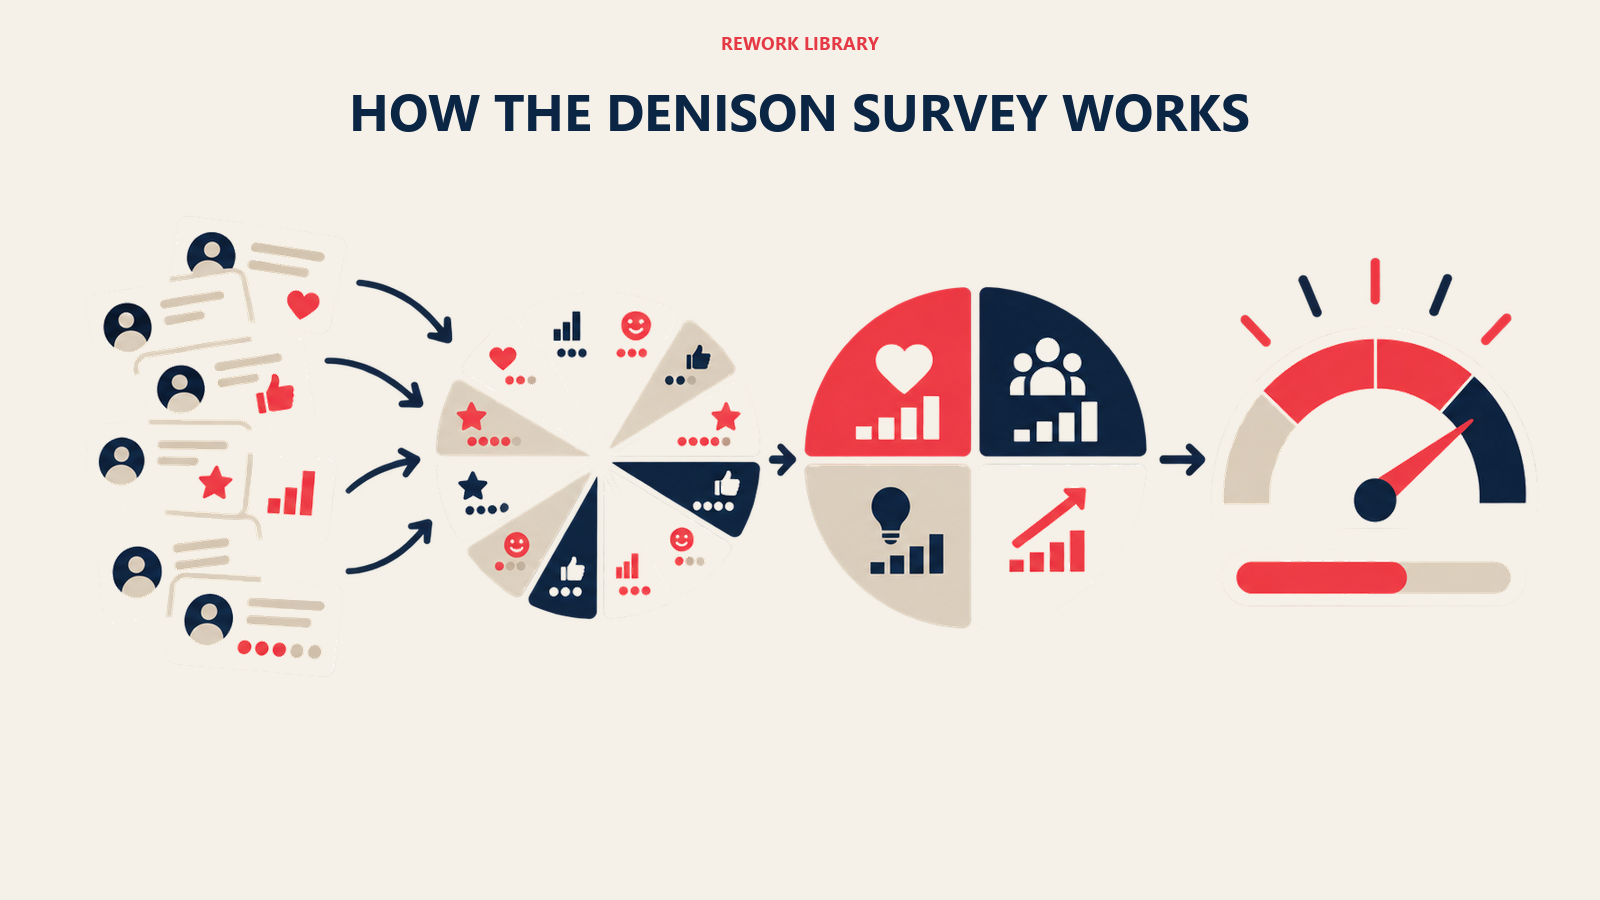
A percentile score of 58 on the Vision index means the organization scored higher than 58% of the organizations in Denison's database on that specific index, not that 58% of employees agreed with a statement. That distinction matters because it is what makes the results comparable across industries and company sizes: a raw average of 2.5 out of 5 tells you almost nothing on its own, but a percentile of 34 immediately tells a leadership team "this is a vulnerable area relative to peers, not just a subjective average."
Two practical details shape how the survey gets used. First, it is typically administered and interpreted through Denison Consulting or a licensed partner, which is why organizations rarely run it as a free, self-service tool the way some engagement pulse surveys work. Second, results can be segmented by function, level, and geography, which is usually where the real insight lives. A company-wide Involvement score of 55 can hide an engineering org at 75 and a frontline operations team at 30, and averaging those away is exactly how leadership stays surprised by a problem the data already flagged.
Denison Model vs. Competing Values Framework
Both models come from the same academic family tree, but they answer different questions and suit different moments in a culture initiative.
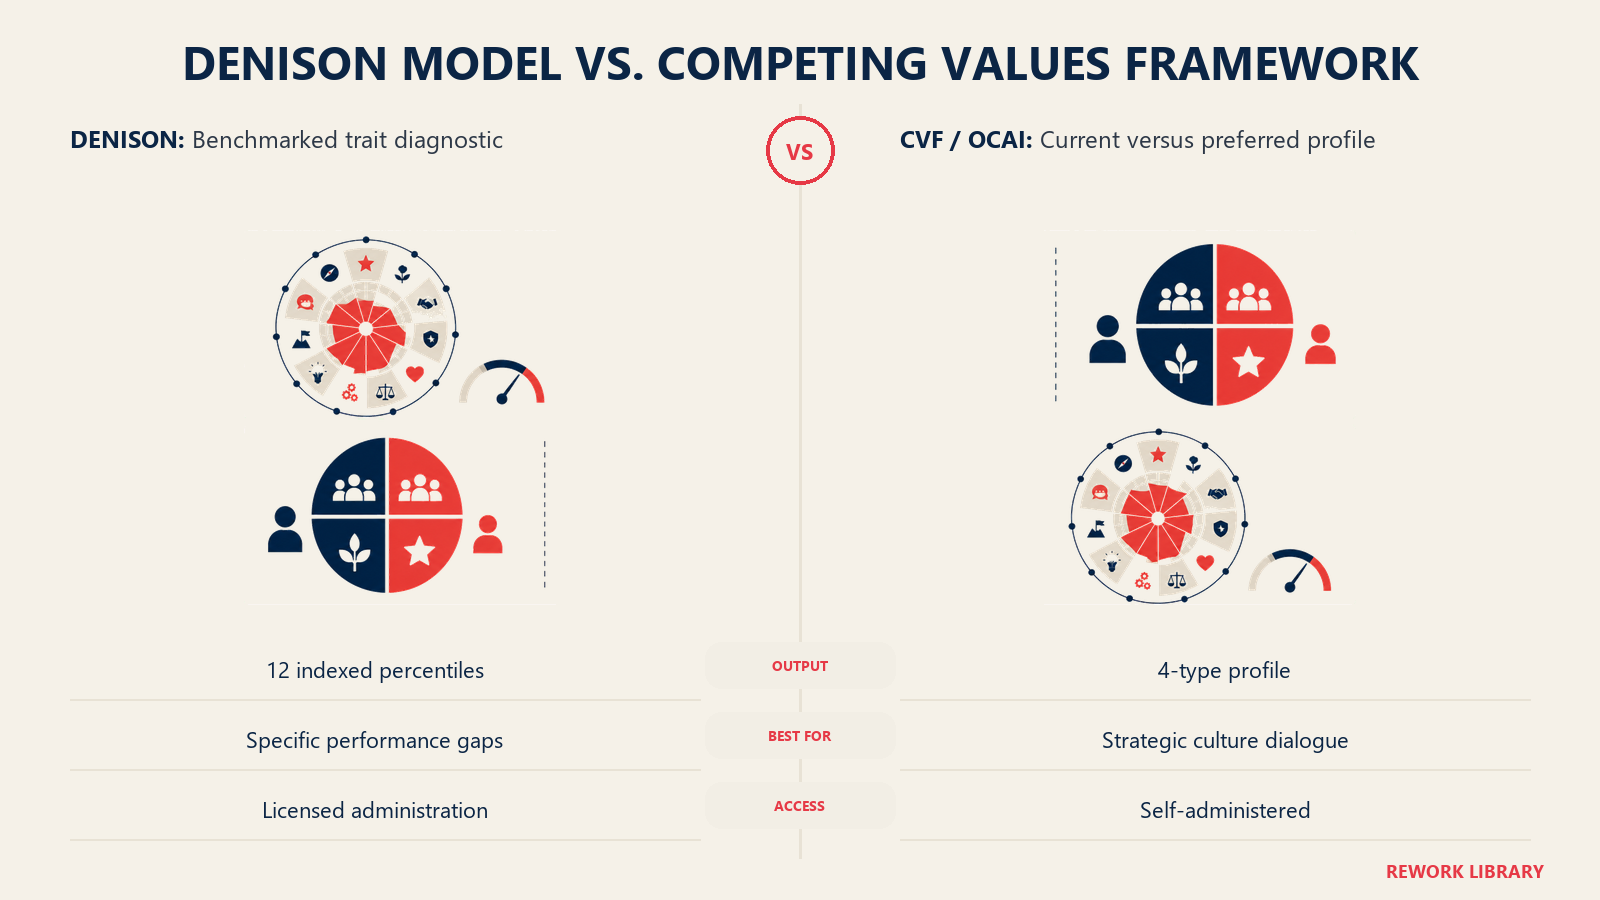
| Denison Model | Competing Values Framework (CVF/OCAI) | |
|---|---|---|
| What it produces | Percentile scores across 12 indices benchmarked to a global database | A current-versus-preferred profile across 4 culture types (clan, adhocracy, market, hierarchy) |
| Best used for | Diagnosing specific, measurable gaps tied to performance outcomes | Starting a conversation about which culture type fits the strategy |
| Administration | Typically run through Denison Consulting or a licensed partner | Can be self-administered with the free OCAI instrument |
| Output granularity | Deep: 48 items, segmentable by function, level, geography | Broader: one quadrant mix, easy to explain in a single slide |
| Underlying research | Denison & Mishra (1995), plus a large ongoing client benchmark database | Quinn & Rohrbaugh (1983) organizational effectiveness study, adapted by Cameron & Quinn |
Neither model is strictly better. Many organizations use the Competing Values Framework first to set direction in plain language everyone in the room can debate, then bring in something like the Denison survey when they need to diagnose exactly which system or behavior is holding a specific trait back. If your immediate need is a shared vocabulary for "what kind of culture are we," start with the Competing Values Framework. If your need is a benchmarked, statistically validated read on where a specific trait is underperforming and what's driving it, the Denison model is built for that.
It is also worth reading Denison's model next to Schein's three levels of culture. Schein explains why culture is hard to see in the first place, artifacts, espoused values, and underlying assumptions. Denison assumes you have already accepted that premise and gives you a way to measure the behavioral layer Schein calls artifacts and enacted values, without claiming to reach the deepest, hardest-to-access assumptions underneath.
How Leaders Actually Read a Denison Profile
A circumplex report full of percentiles is easy to misread if you treat it like a school report card. A few rules keep leaders from drawing the wrong conclusion.
Read the gaps, not just the highs. A profile with Mission at the 80th percentile and Involvement at the 25th percentile is not a strong-culture profile with one weak spot. It is a command-and-control pattern: clear direction from the top, low ownership underneath it, which usually shows up as strategy that never quite lands the way leadership intended.
Check for the diagonal imbalance. Because Mission and Involvement sit on opposite sides of the top-down/bottom-up tension, and Adaptability and Consistency sit on opposite sides of the change/stability tension, a lopsided profile on either diagonal is the signal worth chasing first, more than any single low index.
Segment before you diagnose. A flat, moderate company-wide score almost always hides sharper highs and lows by function or region. Pull the segmented view before assuming the whole organization has the same problem, because the fix for a struggling regional office looks nothing like the fix for a struggling product org.
Treat the score as a starting question, not a verdict. The number tells you where to look, not why it's low or what to do about it. A weak Customer Focus index could mean the sales team never talks to product, or it could mean product genuinely does not have a channel to hear what sales is learning. Those are different fixes wearing the same percentile.
Watch the trend, not one snapshot. A single administration tells you where you stand today. Re-running the survey after a leadership change, a merger, or a major process rollout is what tells you whether an intervention actually moved the underlying behavior, versus just moved the mood for one survey cycle.
Adaptability in the Age of AI
The Adaptability trait, are we listening to the marketplace and can we act on what we hear, is the one most directly tested by the current AI moment. The core Adaptability behaviors the model measures, creating change, staying close to customer signal, and turning lessons into updated practice, are exactly the muscles an organization needs to adopt AI tools and agentic workflows without letting the effort stall out in pilots that never scale.
The honest data here is mixed rather than triumphant. Deloitte's 2026 Global Human Capital Trends research found 65% of organizations say their culture needs to change significantly because of AI's impact, but only 5% report making real progress on that change, and 34% say culture is actively holding back their AI transformation goals. That gap between recognizing the need to adapt and actually doing it is a live example of what Denison's model predicts: an organization can score well on Mission (clear AI ambition in the strategy deck) while Adaptability quietly lags, because the systems for capturing what's working and retiring what isn't haven't caught up to the ambition.
There's a genuine leadership signal in this too. SHRM's 2026 workforce research found 31% of CHROs now name workplace culture a top priority, up from 15% the year before, even as 92% expect AI integration to deepen, which reads as leaders recognizing that the Adaptability and Involvement traits, not just the technology rollout plan, are what determine whether AI adoption actually sticks. We cover the deeper version of this shift, including where AI adoption quietly erodes trust and ownership norms, in AI cultural debt.
Strengths and Real Limits of the Model
Denison's model earns its place for a specific reason: it is one of the few culture frameworks with a direct, published, peer-reviewed line to financial and operational outcomes, not just employee sentiment. The 2012 Kotrba study in Human Relations, run against 137 public companies' actual market-to-book ratios and sales growth, is the kind of external validation most culture instruments never get.
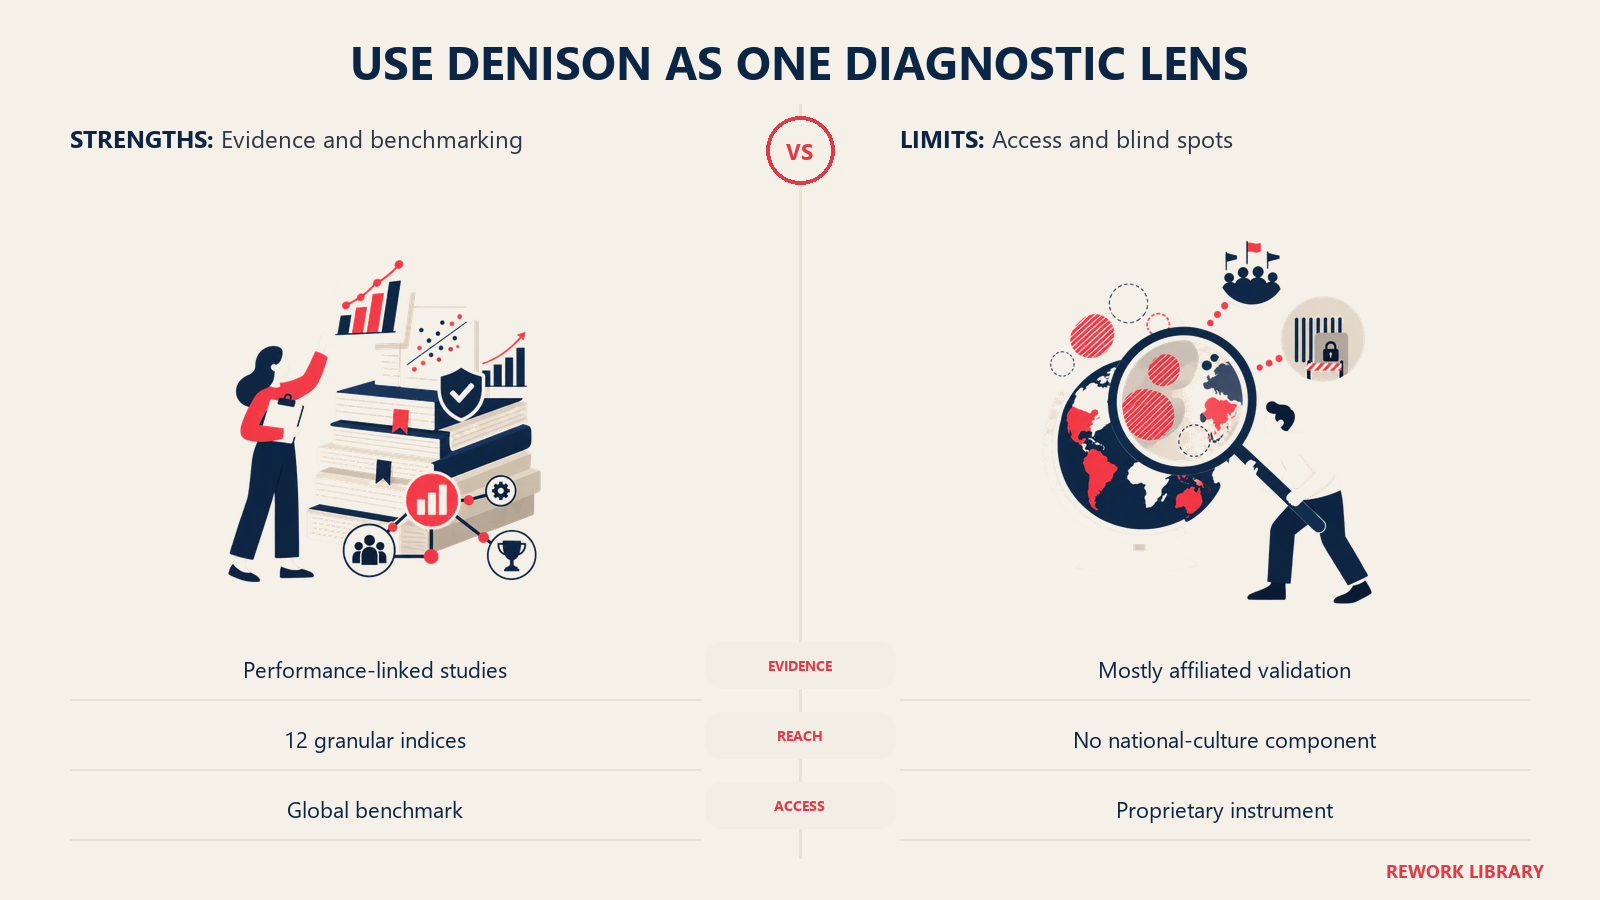
It also has real limits worth naming honestly rather than glossing over. A published critique of the instrument points out it has no dedicated component for national or cross-cultural differences, which matters for any organization managing teams across countries with very different high-context or low-context communication norms. The survey is also proprietary, sold and administered through Denison Consulting or its partners, unlike the freely available OCAI, which limits how easily a smaller company can run it without budget for outside support. And like most culture-effectiveness research, most of the validation work has been conducted by researchers affiliated with the consultancy itself, which is worth knowing even though the underlying 1995 theoretical paper and the 2012 Kotrba study were published through independent peer review.
None of that erases the model's usefulness. It means the smart use of it is as one diagnostic tool among several, not a single source of truth, the same caveat that applies to how you measure company culture more broadly: no single survey, Denison's included, replaces looking at what actually happens when a promotion decision gets made or a bad quarter hits.
Where to Go Next
This article sits in Section 1 of the collection, alongside the other core models for understanding what culture actually is and how to read it.
- What is business culture?, the pillar article this model fits into
- The Competing Values Framework, the sibling model built on the same two axes, sorted into four culture types instead of four measured traits
- Schein's three levels of culture, for why culture is hard to see in the first place, before you try to measure it
- How to measure company culture, for the fuller toolkit beyond any single instrument
- The link between culture and performance, for more on how culture traits translate into business outcomes
- How to change organizational culture, for what to actually do once a profile shows you where the gaps are
- AI cultural debt, for the deeper look at what happens when Adaptability lags behind AI ambition
Frequently Asked Questions about the Denison Organizational Culture Model
What is the Denison Organizational Culture Model?
It's a framework, developed by researcher Daniel Denison, that measures organizational culture across four traits, Mission, Consistency, Involvement, and Adaptability, mapped on two axes: internal versus external focus, and stability versus flexibility. Effective organizations, according to Denison's research, score well on all four traits rather than maximizing just one.
What are the four traits of the Denison model?
Mission (a clear, stable sense of direction and purpose), Consistency (internal systems and values that create leverage), Involvement (empowerment, ownership, and team orientation), and Adaptability (listening to the market and turning that into change). Each trait breaks down into three measurable indices.
How is the Denison model different from the Competing Values Framework?
Both use the same underlying stability-versus-flexibility and internal-versus-external axes, but the Competing Values Framework sorts culture into four named types (clan, adhocracy, market, hierarchy) for a quick strategic conversation, while the Denison model produces 48 benchmarked survey items across 12 indices for a deeper, statistically validated diagnostic.
What is the Denison Organizational Culture Survey (DOCS)?
DOCS is the 48-item survey built directly on the model, with four items per index and three indices per trait. Results come back as percentile scores against a global normative database of more than 1,100 organizations, letting a company compare its own culture profile to industry peers rather than judging a raw average in isolation.
What is the built-in tension in the Denison model?
Two tensions. Mission and Involvement sit on opposite sides of a top-down-versus-bottom-up axis: strong top-level direction can crowd out grassroots ownership, and vice versa. Adaptability and Consistency sit on opposite sides of a change-versus-stability axis: too much adaptation without consistency creates chaos, and too much consistency without adaptability creates a well-run machine that misses the market.
Does the Denison model actually predict financial performance?
There's real peer-reviewed evidence for it. A 2012 study in Human Relations, covering 88,879 individuals across 137 public companies, found Consistency interacts significantly with the other three traits in predicting market-to-book ratio and sales growth, one of the stronger empirical links between a culture survey and objective financial outcomes in the literature.
What are the main criticisms of the Denison model?
A published critique notes it lacks a dedicated national-culture component, which matters for global teams, and that it remains a proprietary instrument sold through Denison Consulting rather than a free, self-administered tool like the OCAI. Much of the validation research has also come from researchers affiliated with the consultancy itself, alongside independently peer-reviewed work.
How should a leader read a Denison culture profile?
Look at the gaps between traits, especially across the two diagonals, before reacting to any single high or low score. Segment the results by function and geography rather than trusting one company-wide average, and treat a low index as the start of a diagnostic conversation, not a verdict on what's wrong or how to fix it.
How does Adaptability connect to how companies are handling AI right now?
Adaptability measures exactly the behaviors AI adoption tests most: sensing what's actually working, changing practice based on it, and staying close to real customer and employee signal instead of the plan on a slide. Deloitte's 2026 research found 65% of organizations say their culture needs to change significantly because of AI, but only 5% report real progress, a live example of Mission (stated ambition) outrunning Adaptability (the capacity to actually act on it).
The Denison model's real contribution is not the four-box diagram, plenty of frameworks have one of those. It's the insistence that a genuinely effective culture holds two real tensions at once instead of resolving them: a clear, stable sense of where you're going, and a flexible, listening posture that keeps you from marching confidently in the wrong direction. Most cultures are better at one half of that than the other. The percentile score just tells you which half, and by how much.

Co-Founder, Rework.com
On this page
- Where the Denison Model Came From
- The Two Axes and Four Traits
- Mission: Direction, Purpose, and Blueprint
- Consistency: Systems, Structures, and Processes
- Involvement: Commitment, Ownership, and Responsibility
- Adaptability: Patterns, Trends, and the Market
- Key Facts
- The Built-In Tension: Mission Against Involvement and Adaptability
- How the Denison Survey Actually Works
- Denison Model vs. Competing Values Framework
- How Leaders Actually Read a Denison Profile
- Adaptability in the Age of AI
- Strengths and Real Limits of the Model
- Where to Go Next