Culture Metrics That Matter (And the Vanity Ones to Drop)
Turn this article into takeaways for your work.


Each assistant summarizes the article only for you and suggests best practices for your work.
Culture metrics that matter are the small set of leading and lagging indicators, typically regretted attrition, internal mobility, psychological safety, values-behavior alignment, and a pulse engagement score, that predict or confirm real organizational health, rather than the survey-completion rates and headline satisfaction scores most dashboards optimize instead.
Most companies don't have a culture measurement problem. They have a metric-selection problem. They track what's easy to pull from an HRIS export, put it on a slide, and call it a scorecard, while the numbers that would actually tell leadership something uncomfortable never make the deck. This article is about the difference: which metrics predict trouble early enough to act on, which ones only confirm it after the damage is done, and which ones are pure vanity, numbers that go up while the underlying problem gets worse.
Leading vs. Lagging Indicators: The Split That Matters Most
Before picking any individual metric, get the leading-versus-lagging distinction straight, because it changes how you use every number that follows.
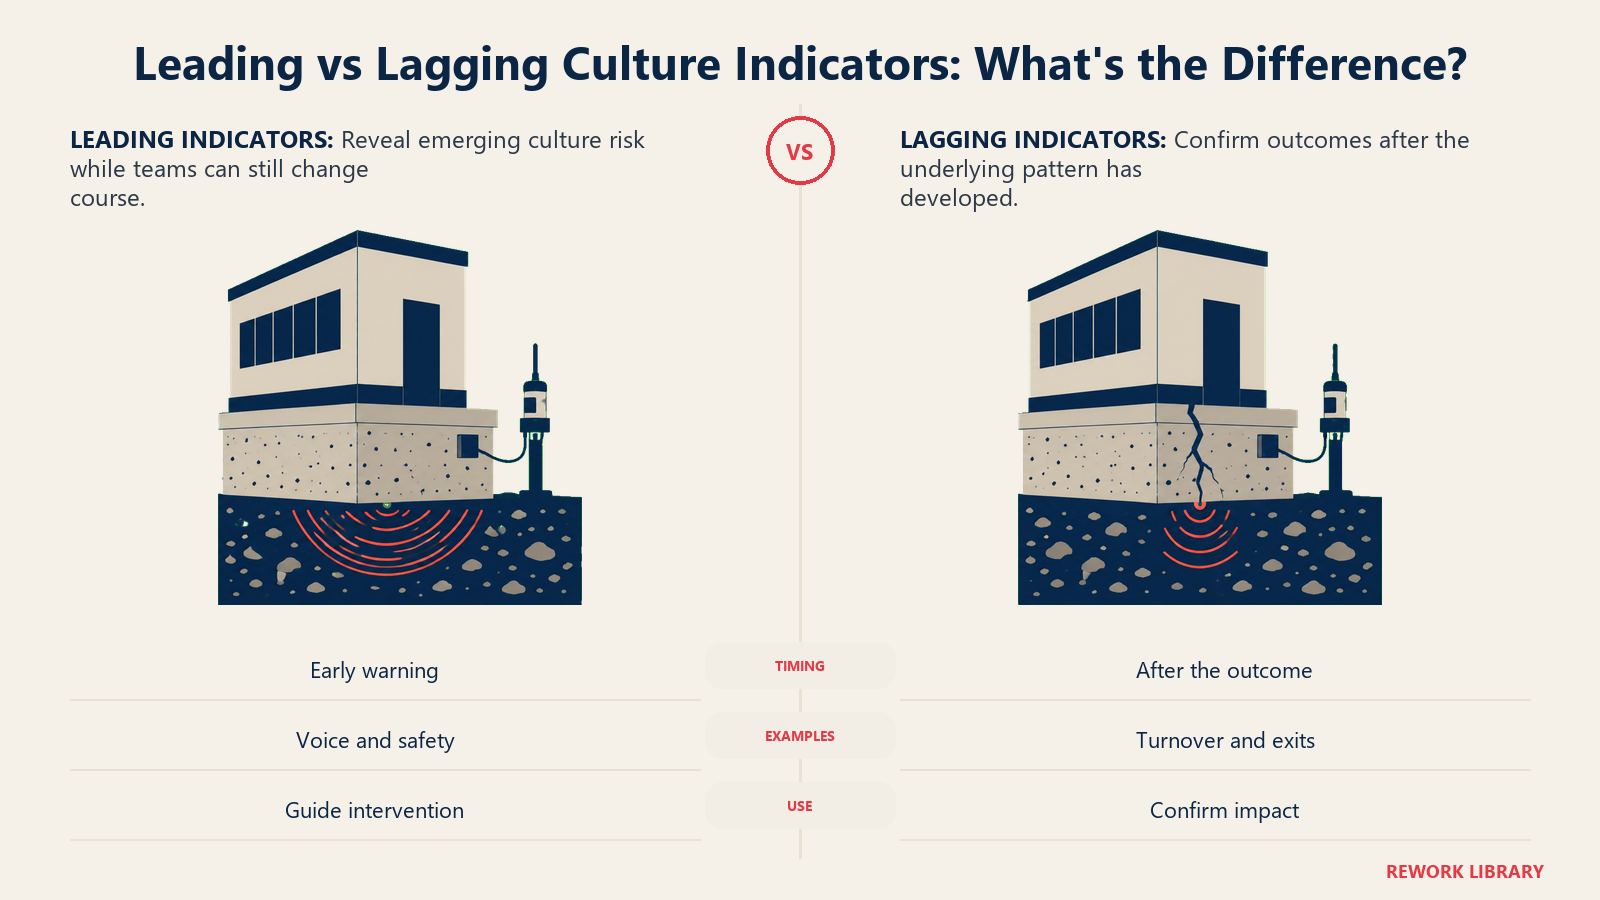
Lagging indicators confirm something has already happened. Voluntary turnover, an annual engagement score, exit interview themes: these are real evidence, but by the time one moves, the underlying cause has usually been building for months.
Leading indicators move earlier, closer to the daily behaviors that eventually produce the lagging result. A drop in meeting participation, a rising rate of transfer requests away from a specific manager, a declining pulse score on "I feel comfortable raising concerns": these are the tremors before the earthquake shows up as an exit interview.
The mistake most scorecards make is stacking lagging indicators three deep (annual engagement score, annual eNPS, annual turnover) and calling that a measurement system. All three tell you the same story, months apart, after it's too late to change the ending. A working scorecard pairs at least one leading indicator with each lagging one it tracks, since the leading number is the one you can manage week to week, while the lagging number is the one you report on. How to measure company culture covers the fuller toolkit of methods this split runs through: surveys, the OCAI, focus groups, and behavioral signals all fall on one side of this line or the other.
Key Facts
- One in two employees who quit their job say they left specifically to get away from their manager, and the majority of the reasons people quit trace back to management, not compensation. Source: Gallup, Talent Walks: Why Your Best Employees Are Leaving
- Replacing an employee typically costs between 50% and 200% of their annual salary depending on seniority and role scarcity, which is why a regretted departure in a hard-to-fill role costs far more than headcount math alone suggests. Source: SHRM
- Organizations with strong internal mobility retain employees for an average of 5.4 years, nearly double the 2.9 years typical of companies that struggle to move people internally. Source: LinkedIn Workplace Learning Report
- Google's Project Aristotle research, spanning 180 teams and 250 attributes, found psychological safety was the single strongest predictor of team effectiveness, with high-safety teams outperforming others by roughly 27%. Source: Google re:Work, Understand Team Effectiveness
- 86% of employees say their company communicates its values clearly, but only 44% say those values are consistently demonstrated by leadership, a 42-point say-do gap. Source: Resume Now, Values Gap Report
- 65% of organizations say their culture needs to change significantly because of AI, and 42% of workers say their organization rarely evaluates AI's effect on people, the gap that produces AI cultural debt. Source: Deloitte, 2026 Global Human Capital Trends
The Metrics Worth Tracking
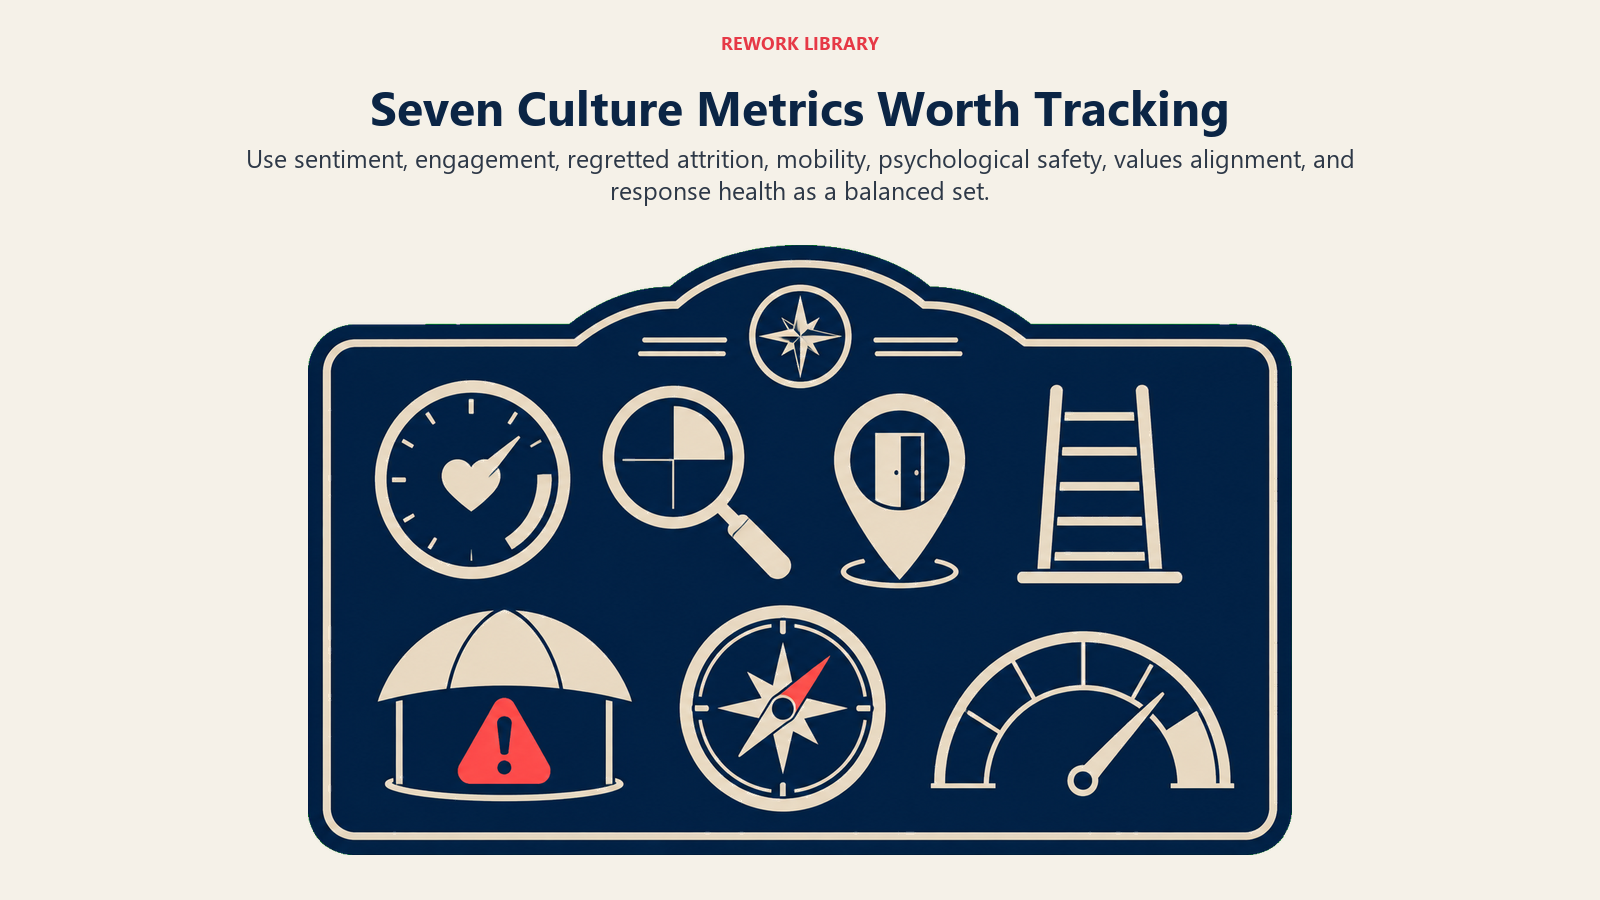
Seven metrics show up again and again in the research and in practice, each catching something the others miss.
eNPS: The Fast Pulse
eNPS asks one question, would you recommend this company as a place to work, and nets promoters against detractors into a score from negative 100 to positive 100. It earns its place because it's cheap to run monthly without wearing anyone out, and a sharp drop after a reorg or a leadership change is a legitimate early trigger to look closer.
Its weakness is diagnostic power: one number can't tell you why it moved. Treat eNPS as a smoke alarm, not an inspector, useful for catching a shift fast, useless for explaining it alone.
Engagement Survey Scores
Longer, structured instruments like engagement and culture surveys ask about specific drivers: clarity of expectations, having the tools to do the job, feeling heard, having room to grow. Run consistently, the trend line across quarters matters more than any single score, and a well-built survey is the closest thing to a diagnostic instrument in the whole toolkit.
The trap is running one long survey a year and calling that measurement. A 60-question annual instrument that takes six weeks to analyze and never gets discussed with the team that filled it out teaches people that answering honestly changes nothing, which quietly poisons every future survey too.
Regretted Attrition
Not every departure is a signal. Regretted attrition isolates the ones that are: high performers, in roles hard to backfill within six months, whose exit genuinely costs the business something. A department losing three mediocre performers to better offers elsewhere is a different problem than a department losing its best engineer, and blending both into one flat turnover number hides the one that should worry leadership.
This metric earns a spot on a small scorecard because it forces a harder conversation than turnover alone. If overall voluntary turnover sits around 10%, most retention specialists treat a regretted rate above 2% as worth investigating, and treat manager-level concentration (three regretted exits from one team in a year) as a bigger red flag than the same three exits spread across the company. Culture and employee retention covers the fuller retention picture this metric sits inside.
Internal Mobility
Internal mobility, the rate at which employees move to new roles inside the company rather than leaving for one outside it, is one of the more reliable leading indicators of a culture that actually invests in people rather than just talking about doing so. It's a leading indicator because a drop in internal moves usually shows up in exit interviews and regretted attrition months later, once ambitious people conclude growth has to happen somewhere else.
It's also harder to fake than most survey scores. A company can inflate an engagement score with a well-worded question, but it can't fabricate a track record of promoting and transferring people internally. Cut this number by function and by manager, since some managers systematically release talent for others to develop while others quietly hoard it, and a company-wide average hides both patterns equally well.
Psychological Safety Index
Amy Edmondson's construct, popularized further by Google's Project Aristotle research, measures whether people believe they can take an interpersonal risk (raise a concern, admit a mistake, propose an unpopular idea) without being punished or embarrassed for it. It's typically measured with a short, validated set of survey items (Edmondson's original seven-item scale is the most cited version) rather than a single question, because psychological safety is a belief about consequences, not a mood.
This metric belongs on almost every scorecard because it's a leading indicator for nearly everything else on this list. Teams low in psychological safety surface problems late, promote internally less because managers don't hear who's ready, and lose people who got tired of staying quiet, the same dynamic covered in why teams stay silent in meetings. Track it at the team level, not company-wide, since safety is built or broken by an individual manager's behavior far more than by any company-wide initiative.
Values-Behavior Alignment
This measures the gap between what an organization says it values and what people actually observe leadership doing, and it's frequently the widest gap on the whole list. Employees who watch stated values contradicted by daily behavior don't just disengage quietly, they conclude every other stated commitment is aspirational rather than real, which erodes trust in performance reviews, promotion decisions, and layoff communications alike.
Measure it with a short, specific set of items rather than a generic "do you trust leadership" question: does this organization actually reward the behavior it claims to value, do leaders model the stated values under pressure, and would you describe a recent decision as consistent with what the company says it stands for. A values-behavior score that's flat or declining while eNPS holds steady is often the earliest hint that trust is fraying before it shows up anywhere else.
Participation and Response Rates
This one is different from the rest: it's not a culture metric on its own, it's a metric about whether your other metrics can be trusted. A survey with a 30% response rate isn't measuring the organization, it's measuring whichever third felt like answering, and that third is rarely representative. Response rates in the 60% to 80% range for a well-promoted internal survey are generally considered healthy; below 50%, treat every other number from that survey as directional at best. A steadily declining response rate is itself a leading indicator, usually of the same problem behind survey fatigue everywhere: people stopped believing their answers led anywhere.
| Metric | Type | What it tells you |
|---|---|---|
| eNPS | Lagging pulse | Whether overall sentiment is rising or falling, fast and often |
| Engagement survey score | Lagging (trend), diagnostic | Which specific drivers (clarity, growth, recognition) are weak |
| Regretted attrition | Lagging | Whether the company is losing people it can least afford to lose |
| Internal mobility | Leading | Whether people believe they can grow here without leaving |
| Psychological safety index | Leading | Whether people will surface problems before they compound |
| Values-behavior alignment | Leading | Whether trust in leadership is intact or quietly eroding |
| Participation/response rate | Measurement-health | Whether the other numbers on this list can be trusted at all |
Vanity Metrics: Goodhart's Law in a Culture Dashboard
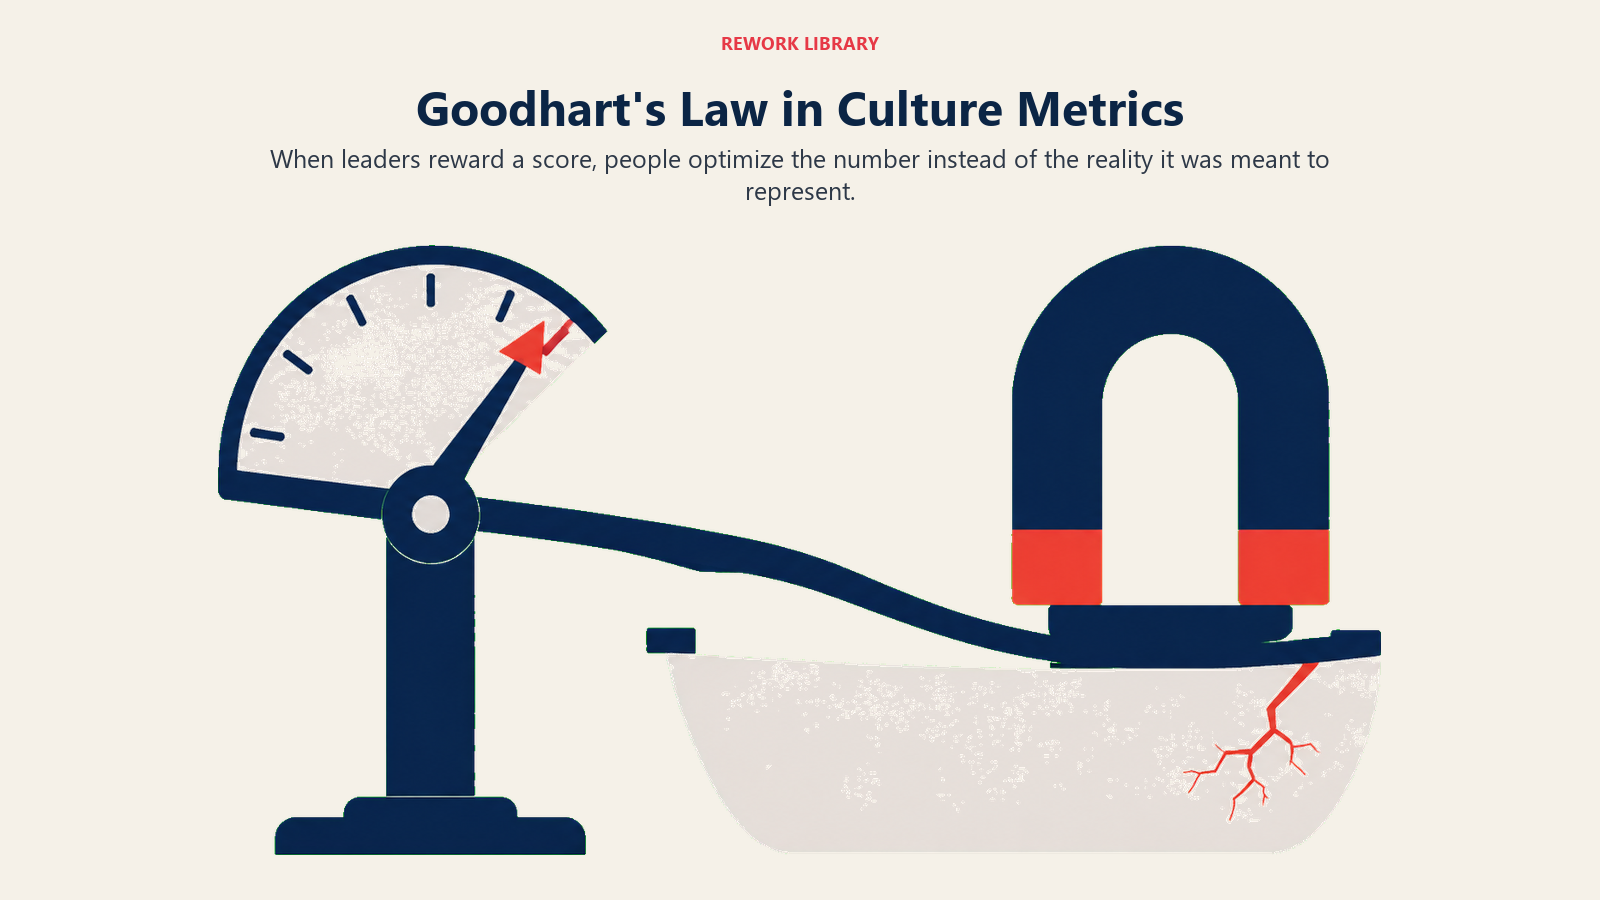
British economist Charles Goodhart first articulated the underlying idea in 1975, writing about monetary policy: any statistical regularity tends to collapse once you put pressure on it for control purposes. Anthropologist Marilyn Strathern later popularized the phrasing most people actually quote: "when a measure becomes a target, it ceases to be a good measure." Culture measurement is one of the clearest places this plays out in an ordinary business, because so much of what culture dashboards track is easy to move without moving the thing it's supposed to represent.
How Culture Metrics Get Gamed
Once a number becomes the thing a manager is evaluated on, people optimize for the number, not the underlying reality it was meant to stand in for. A few patterns show up constantly:
Survey completion rate as the target. A manager pressured to hit 90% participation starts reminding people repeatedly, sometimes during team meetings, which produces more responses but also more rushed, socially pressured ones. Completion goes up. Honesty goes down.
eNPS tied to manager bonuses. The moment a manager's compensation depends on their team's score, some managers will, consciously or not, create an environment where a low score feels riskier to submit than a flattering one. The score improves. The underlying sentiment it was supposed to capture doesn't.
Flat, uniformly positive scores treated as success. A team that reports 95% satisfaction on every question, every quarter, isn't necessarily healthy. Real teams have some texture, a strong score on trust and a weaker one on workload, say. Uniform positivity paired with a high response rate is often a sign of fear of candor, not health, the same trap covered under signs of a toxic culture.
Turnover as the sole health check. A leader chasing zero turnover can end up retaining people they should be managing out, since keeping headcount flat becomes the goal instead of keeping the right people. Regretted attrition exists precisely to catch this: low overall turnover paired with your best people quietly leaving is worse than moderate turnover concentrated among low performers.
How to Avoid Gaming Your Own Scorecard
A few structural habits keep Goodhart's Law from eating your measurement program.
Never tie a single metric to individual compensation or performance review. The moment a number determines a manager's bonus, treat every future reading of it with more suspicion, not less.
Triangulate before acting on any one number. A single metric moving is a prompt to look closer with a second, independent source (a focus group, a behavioral signal, a different survey question), not a verdict to act on alone.
Rotate which metrics get leadership attention. A metric that's always in the spotlight attracts the most gaming pressure. Cycling emphasis (this quarter: internal mobility, next quarter: psychological safety) spreads scrutiny more evenly and makes any one number harder to quietly optimize.
Watch for metrics that move without any corresponding behavioral change. If an engagement score jumps 10 points in one quarter with no new initiative behind it, that's a reason for skepticism, not celebration.
Building a Small Balanced Scorecard
The instinct to add more metrics is almost always wrong. A dashboard with twenty numbers gets glanced at once and ignored forever, because no single person owns twenty things. A scorecard with four to six earns a standing spot in a leadership review because someone can actually hold all of it in their head.
Pick one from each category. At minimum: one fast pulse (eNPS), one deeper diagnostic (engagement survey trend), one hard behavioral signal (regretted attrition or internal mobility), and one trust signal (psychological safety or values-behavior alignment). That's four numbers, each catching something the others structurally can't.
Cut everything by team and manager, never just company average. A flat, healthy company-wide number hides the two or three teams in real trouble almost every time, since culture and performance research consistently finds that dysfunction concentrates under specific managers rather than spreading evenly.
Set a cadence and an owner for each number, not just for the whole scorecard. A pulse metric reviewed monthly by an HR business partner behaves differently than the same metric glanced at once a year during a board deck.
Close the loop every time a number is reviewed, especially when the answer is "we're not changing anything." Silence after a review reads as inaction even when a decision genuinely was made, the same principle behind running a real culture audit rather than a one-time survey that gets filed and forgotten.
Culture Metrics in the Age of AI
Every metric above was built for a workforce where the person doing the work was, by default, a human being reporting to another human being. That assumption doesn't fully hold anymore, and most existing scorecards haven't caught up.
AI cultural debt is the best current example of a metric most companies don't track until it's already expensive: the quiet erosion of trust, fairness, and ownership norms that builds when AI tools roll out faster than anyone measures their effect on how people work together. Adoption dashboards and productivity metrics were never designed to catch it. A rollout can hit every usage target on the scorecard while trust between teammates quietly frays underneath, invisible until an engagement score or a values-behavior gap widens months later and nobody can immediately explain why.
The fix isn't a new platform. It's adding a small number of specific questions to whatever pulse survey or manager check-in already exists: do people trust a colleague's output the same amount when they suspect it was AI-assisted, is there a clear and shared answer for when AI use gets disclosed, does everyone have comparable access to good AI tools, and does credit stay clear when AI played a real role in the work. Treat these as leading indicators for the same reason internal mobility and psychological safety are leading indicators elsewhere on this list: by the time the erosion shows up in an annual engagement number, it has usually been building, quietly, for a year.
Where to Go Next
A metric only pays off once it changes a decision. From here:
- How to measure company culture, for the full method set (surveys, the OCAI, focus groups, behavioral signals) these metrics are pulled from
- What is eNPS?, for the formula, real benchmarks, and the limits of a one-question metric
- Culture and engagement surveys, for how to build the diagnostic instrument this scorecard's deeper number should come from
- How to run a culture audit, for turning a point-in-time read into a recurring measurement habit
- Culture and employee retention, for the fuller picture regretted attrition sits inside
- The link between culture and performance, for how these metrics connect to business outcomes leadership actually tracks
- AI cultural debt, for the fuller playbook on measuring AI's effect on trust and fairness before it shows up as an engagement crater
Frequently Asked Questions about Culture Metrics
What are the most important culture metrics to track?
A small, balanced set beats a long list. Most organizations do well tracking one fast pulse (eNPS), one deeper diagnostic (an engagement survey trend), one hard behavioral signal (regretted attrition or internal mobility), and one trust signal (psychological safety or values-behavior alignment). Four to six metrics, reviewed consistently and cut by team, outperforms twenty metrics glanced at once a year.
What is regretted attrition and why does it matter more than overall turnover?
Regretted attrition is the subset of voluntary departures a company actually wanted to prevent, typically high performers in roles that are hard to backfill quickly. Overall turnover blends good and bad departures into one number, which can look healthy even while an organization is quietly losing the people it can least afford to lose.
What is a psychological safety index and how is it measured?
A psychological safety index measures whether people believe they can raise concerns, admit mistakes, or propose unpopular ideas without being punished for it. It's usually captured with a short, validated survey scale, such as Amy Edmondson's original seven-item measure, rather than a single question, since safety is a belief about consequences that takes several angles to capture accurately.
What is Goodhart's Law and how does it apply to culture metrics?
Goodhart's Law, often phrased as "when a measure becomes a target, it ceases to be a good measure," describes how any metric loses its value as a true signal once people are evaluated or rewarded based on hitting it. In culture measurement, this shows up as inflated survey completion rates, gamed eNPS scores tied to manager bonuses, and flat, uniformly positive results that reflect fear of candor more than genuine health.
How is internal mobility a leading indicator of culture health?
Internal mobility, the rate at which employees move into new roles inside the company, tends to move before regretted attrition and exit interview themes do. A drop in internal moves usually means ambitious employees have concluded growth has to happen somewhere else, months before that conclusion shows up as a resignation.
How many culture metrics should a scorecard include?
Four to six is a practical target. More than that and no single leader can hold the full picture in their head, so most of the numbers get generated but never actually reviewed. Fewer than four and you risk missing an entire category, like having a pulse metric but no hard behavioral signal to check it against.
What should companies add to measure AI's effect on culture?
A handful of specific questions added to an existing pulse survey or manager check-in: whether people trust AI-assisted work from colleagues as much as fully human work, whether disclosure norms for AI use are clear, whether access to good AI tools feels equitable, and whether credit stays clear when AI played a real role. This is the core of tracking AI cultural debt before it shows up as an unexplained dip in engagement or trust scores.
A culture scorecard isn't supposed to feel comfortable. If every number on it is flat and positive quarter after quarter, that's usually a sign the scorecard is measuring the wrong things, or that people have learned honesty doesn't change anything, not that the culture is actually healthy. The metrics that matter are the ones that occasionally tell leadership something they'd rather not hear, cut by team instead of averaged into comfort, paired enough to explain each other, and reviewed often enough that the people generating the data can see it change a real decision.

Co-Founder, Rework.com
On this page
- Leading vs. Lagging Indicators: The Split That Matters Most
- Key Facts
- The Metrics Worth Tracking
- eNPS: The Fast Pulse
- Engagement Survey Scores
- Regretted Attrition
- Internal Mobility
- Psychological Safety Index
- Values-Behavior Alignment
- Participation and Response Rates
- Vanity Metrics: Goodhart's Law in a Culture Dashboard
- How Culture Metrics Get Gamed
- How to Avoid Gaming Your Own Scorecard
- Building a Small Balanced Scorecard
- Culture Metrics in the Age of AI
- Where to Go Next