Bahasa Indonesia
Earned Value Management (EVM): Rumus dan Contoh
Turn this article into takeaways for your work.
Each assistant summarizes the article only for you and suggests best practices for your work.
Earned value management adalah metode pengendalian proyek yang memberi tahu Anda, pada titik mana pun dalam proyek, persis berapa banyak pekerjaan yang Anda rencanakan, berapa banyak yang sebenarnya Anda lakukan, dan berapa banyak yang Anda keluarkan untuk melakukannya. Sebagian besar project manager dapat melaporkan apakah mereka melebihi anggaran atau terlambat dari jadwal. EVM memungkinkan Anda melaporkan keduanya sekaligus, dengan angka yang menunjuk ke perkiraan biaya akhir, dan melakukannya menggunakan tiga nilai sederhana yang diukur terhadap baseline yang sama.
Teknik ini sudah ada selama beberapa dekade, wajib untuk kontrak federal AS di atas ambang tertentu, dan didukung oleh standar ANSI/EIA-748. Terdengar teknis, tetapi ide intinya mudah dipahami: bandingkan apa yang Anda dapatkan dari uang yang Anda keluarkan terhadap apa yang Anda rencanakan untuk didapatkan.
Apa Itu Earned Value Management?
Earned value management (EVM) adalah kerangka pengukuran kinerja proyek yang mengintegrasikan data ruang lingkup, jadwal, dan biaya ke dalam satu set metrik yang konsisten. Alih-alih melacak biaya dan jadwal sebagai perhatian terpisah, EVM mengekspresikan keduanya dalam unit yang sama (dolar atau jam) sehingga Anda dapat membandingkannya langsung dan memperkirakan ke mana proyek akan berakhir.
Metode ini dimulai dengan performance measurement baseline (PMB): anggaran yang dibagi berdasarkan waktu yang dibangun dari struktur rincian kerja dan jadwal proyek Anda. Setiap minggu atau periode pelaporan, Anda membandingkan tiga nilai terhadap baseline tersebut dan menghitung varians serta rasio efisiensi darinya.
Fakta Kunci
- ANSI/EIA-748, pertama kali diterbitkan pada tahun 1998 dan direvisi pada tahun 2019, mendefinisikan 32 panduan yang mengatur sistem EVM pada kontrak pemerintah AS.
- Departemen Pertahanan AS mewajibkan EVM pada semua kontrak senilai $20 juta atau lebih untuk program pengembangan, sesuai DoD Instruction 5000.02.
- Panduan PMBOK dari PMI mencakup earned value sebagai teknik inti di bawah area pengetahuan manajemen biaya proyek dan manajemen jadwal.
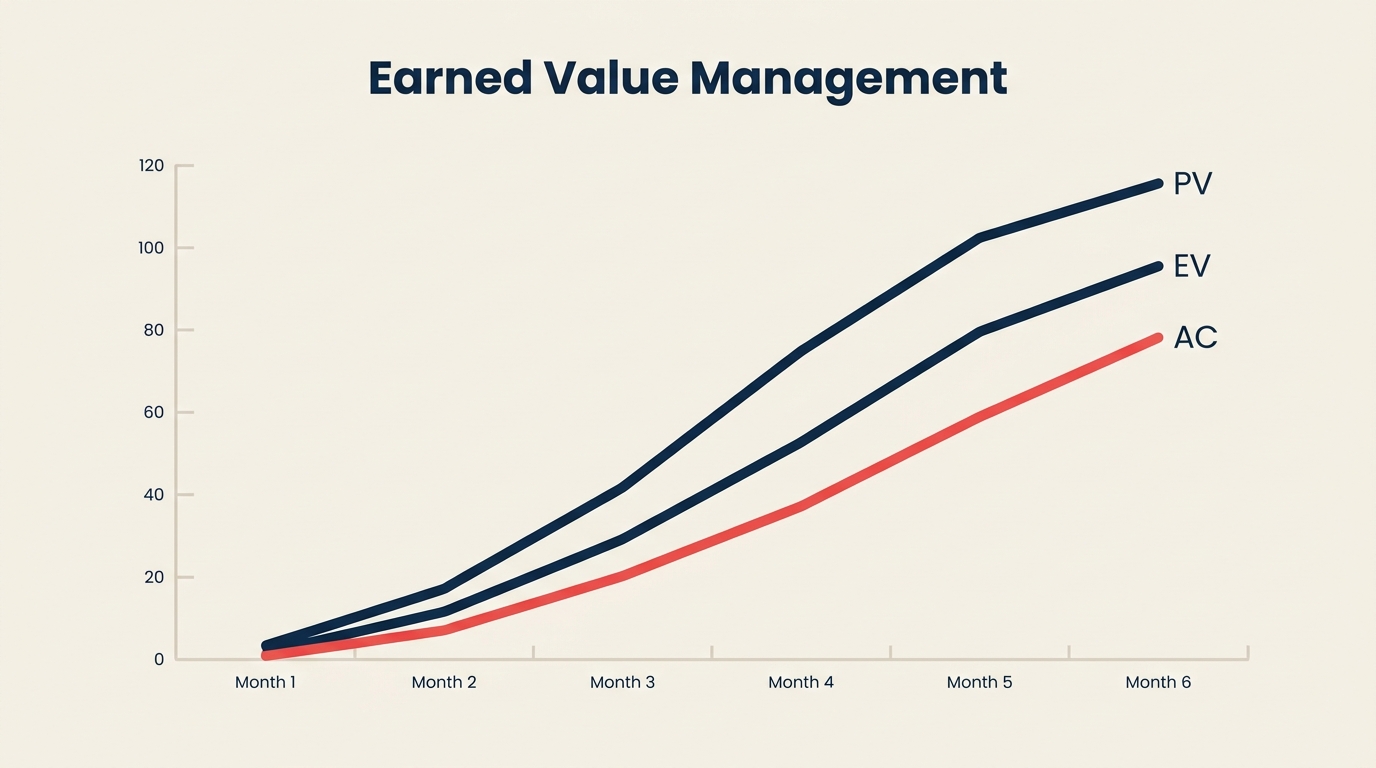
Tiga Nilai Inti EVM
Setiap perhitungan EVM berasal dari tiga nilai yang diukur. Dapatkan ini dengan benar dan sisa matematikanya hanya aritmatika.
| Nilai | Singkatan | Definisi |
|---|---|---|
| Planned Value | PV | Biaya yang dianggarkan dari pekerjaan yang dijadwalkan untuk diselesaikan pada tanggal pengukuran |
| Earned Value | EV | Biaya yang dianggarkan dari pekerjaan yang sebenarnya diselesaikan pada tanggal pengukuran |
| Actual Cost | AC | Biaya nyata yang dikeluarkan untuk pekerjaan yang diselesaikan pada tanggal pengukuran |
Beberapa hal yang perlu diperhatikan. PV dan EV keduanya dinyatakan dalam dolar anggaran, bukan dolar nyata. EV adalah nilai pekerjaan yang diselesaikan dalam rencana asli Anda, bukan biayanya. AC adalah satu-satunya nilai yang menggunakan angka pengeluaran nyata. Inilah yang memungkinkan Anda membandingkan kinerja biaya dan jadwal pada skala yang sama.
PV berasal langsung dari estimasi biaya proyek dan jadwal Anda. AC berasal dari sistem akuntansi Anda. EV adalah yang harus Anda hitung: sama dengan persentase penyelesaian setiap tugas dikalikan dengan anggaran tugas tersebut.
Rumus EVM
Delapan metrik turunan di bawah ini mencakup hampir setiap pertanyaan EVM yang dihadapi project manager. Rumusnya hanya menggunakan PV, EV, AC, dan BAC (Budget at Completion, total anggaran proyek yang disetujui).
| Metrik | Rumus | Yang diberitahukannya |
|---|---|---|
| Cost Variance (CV) | EV - AC | Positif = di bawah anggaran, negatif = di atas anggaran |
| Schedule Variance (SV) | EV - PV | Positif = lebih awal dari jadwal, negatif = terlambat |
| Cost Performance Index (CPI) | EV / AC | Nilai sen per dolar yang dikeluarkan (>1 = efisien) |
| Schedule Performance Index (SPI) | EV / PV | Pekerjaan yang diselesaikan per pekerjaan yang direncanakan (>1 = lebih awal) |
| Estimate at Completion (EAC) | BAC / CPI | Perkiraan biaya akhir pada efisiensi saat ini |
| Estimate to Complete (ETC) | EAC - AC | Anggaran yang tersisa yang diperlukan untuk menyelesaikan |
| Variance at Completion (VAC) | BAC - EAC | Proyeksi jumlah akhir di atas/di bawah anggaran |
| To-Complete Performance Index (TCPI) | (BAC - EV) / (BAC - AC) | Efisiensi yang diperlukan pada pekerjaan yang tersisa untuk mencapai BAC |
Membaca indeks. CPI dan SPI di bawah 1,0 berarti Anda mendapatkan nilai kemajuan kurang dari satu dolar per dolar yang dikeluarkan (CPI) atau per hari yang berlalu (SPI). Di atas 1,0 berarti Anda lebih awal dari rencana. CPI sebesar 0,85 berarti untuk setiap dolar yang dikeluarkan Anda hanya menyelesaikan pekerjaan senilai $0,85 yang direncanakan. Kesenjangan itu semakin besar seiring perkembangan proyek, itulah mengapa EAC (BAC / CPI) sering menghasilkan pembengkakan biaya yang lebih besar dari yang diharapkan orang.
TCPI menjawab pertanyaan: "Efisiensi apa yang kita butuhkan pada pekerjaan yang tersisa untuk tetap selesai dalam anggaran asli?" TCPI di atas 1,2 umumnya dianggap tidak realistis untuk dipulihkan.
Kesalahan Umum
Mengukur persentase penyelesaian secara tidak benar. EV sepenuhnya bergantung pada cara Anda melaporkan persentase penyelesaian. Dua jebakan umum: "aturan 20/80" (tugas dianggap 20% selesai begitu dimulai, 80% saat selesai) dan "aturan 0/100" (tidak ada yang dihitung sampai selesai). Keduanya adalah penyederhanaan yang sah untuk tugas pendek. Kesalahannya adalah mencampur metode secara tidak konsisten di seluruh proyek.
Mengabaikan performance measurement baseline. EVM hanya berfungsi jika PV berasal dari baseline yang disetujui dan dibekukan. Jika Anda me-re-baseline setiap kali masalah muncul, CPI dan SPI akan selalu terlihat baik-baik saja, tetapi Anda kehilangan semua nilai perkiraan. Perubahan harus melalui kontrol perubahan formal, bukan re-baselining diam-diam.
Melacak biaya tetapi bukan ruang lingkup. Beberapa tim mengetahui biaya aktual mereka tetapi tidak pernah menghitung EV. Tanpa EV Anda tidak dapat menghitung CV atau CPI. Anda hanya tahu bahwa Anda mengeluarkan uang, bukan apakah Anda mendapatkan sesuatu untuk itu.
Mengacaukan SV dengan waktu. Schedule Variance dinyatakan dalam dolar (atau jam), bukan hari. SV = -$50.000 tidak berarti Anda terlambat 50 hari. Untuk menerjemahkan SV ke dalam waktu, Anda perlu tingkat pembakaran yang direncanakan untuk periode tersebut.
Menerapkan EVM terlambat. Perkiraan EVM paling berguna di paruh pertama proyek. Pada saat Anda sudah 80% selesai, tidak ada cukup pekerjaan yang tersisa untuk memperbaiki CPI yang buruk. Mulai pelacakan dari periode pelaporan pertama.
Cara Menggunakan Earned Value Management
Langkah 1: Bangun performance measurement baseline
Mulailah dengan struktur rincian kerja Anda dan pecah ke level control account. Tetapkan anggaran (dalam dolar atau jam) untuk setiap control account dan bagi anggaran tersebut berdasarkan waktu di seluruh jadwal proyek. Hasilnya adalah kurva PV Anda, yang menunjukkan pengeluaran kumulatif yang direncanakan di seluruh siklus hidup proyek.
Langkah 2: Tetapkan metode penyelesaian untuk setiap paket kerja
Putuskan sebelum pekerjaan dimulai bagaimana persentase penyelesaian akan diukur untuk setiap paket kerja. Tugas pendek dapat menggunakan 0/100. Tugas yang lebih panjang harus menggunakan Milestone berbobot atau metode persentase penyelesaian fisik. Dokumentasikan keputusan tersebut. Mengubah metode di tengah tugas mendistorsi EV.
Langkah 3: Kumpulkan biaya aktual setiap periode pelaporan
Ambil biaya aktual dari sistem akuntansi atau pelacakan waktu Anda untuk periode pelaporan. Catat pada level control account, bukan hanya total proyek. Ini adalah AC Anda.
Langkah 4: Hitung earned value
Untuk setiap control account, kalikan anggaran yang disetujui dengan persentase penyelesaian. Jumlahkan di semua control account untuk mendapatkan total EV untuk periode tersebut. Langkah ini memerlukan kedisiplinan: persentase penyelesaian harus mencerminkan kemajuan nyata yang dapat diverifikasi, bukan perasaan.
Langkah 5: Hitung varians dan indeks
Dengan PV, EV, dan AC di tangan, hitung CV, SV, CPI, dan SPI. Varians mana pun di luar ambang yang ditentukan (banyak tim menggunakan 10%) memicu laporan analisis varians yang menjelaskan penyebab dan tindakan korektif.
Langkah 6: Perkirakan EAC dan ETC
Gunakan EAC = BAC / CPI untuk perkiraan yang paling andal secara statistik. Beberapa tim menggunakan rumus EAC alternatif untuk keadaan tertentu: EAC = AC + (BAC - EV) mengasumsikan pekerjaan di masa depan berjalan pada tingkat yang direncanakan, yang optimis jika CPI saat ini buruk. Untuk skenario pemulihan jadwal, hitung ulang juga SPI dan periksa TCPI.
Langkah 7: Laporkan dan ambil tindakan
Sajikan indeks dengan data tren, bukan hanya snapshot satu titik waktu. CPI yang 0,90 bulan lalu dan 0,88 bulan ini sedang bergerak ke arah yang salah. CPI yang bergerak dari 0,85 ke 0,92 menunjukkan pemulihan. Tren sama pentingnya dengan nilai saat ini.
Contoh Earned Value Management
Misalkan sebuah proyek perangkat lunak memiliki total anggaran (BAC) sebesar $200.000 dan dijadwalkan 50% selesai setelah tiga bulan. Pada tanda tiga bulan, tim melaporkan 40% selesai, dan sistem akuntansi menunjukkan $110.000 telah dikeluarkan.
| Nilai | Perhitungan | Jumlah |
|---|---|---|
| BAC | Diberikan | $200.000 |
| PV | 50% x $200.000 | $100.000 |
| EV | 40% x $200.000 | $80.000 |
| AC | Dari akuntansi | $110.000 |
Sekarang hitung metrik turunannya:
| Metrik | Rumus | Hasil | Interpretasi |
|---|---|---|---|
| CV | EV - AC = $80.000 - $110.000 | -$30.000 | $30.000 di atas anggaran |
| SV | EV - PV = $80.000 - $100.000 | -$20.000 | Terlambat dari jadwal (dalam $ anggaran) |
| CPI | EV / AC = $80.000 / $110.000 | 0,73 | Mendapat nilai $0,73 per $1 yang dikeluarkan |
| SPI | EV / PV = $80.000 / $100.000 | 0,80 | Hanya 80% dari pekerjaan yang direncanakan selesai |
| EAC | BAC / CPI = $200.000 / 0,73 | $274.000 | Perkiraan biaya akhir |
| ETC | EAC - AC = $274.000 - $110.000 | $164.000 | Masih butuh ini untuk menyelesaikan |
| VAC | BAC - EAC = $200.000 - $274.000 | -$74.000 | Diperkirakan melebihi anggaran $74.000 |
| TCPI | ($200.000 - $80.000) / ($200.000 - $110.000) = $120.000 / $90.000 | 1,33 | Butuh efisiensi 33% lebih dari yang direncanakan |
Gambarannya jelas: proyek ini sekaligus melebihi anggaran dan terlambat dari jadwal. EAC sebesar $274.000 mewakili pembengkakan biaya 37% jika CPI saat ini bertahan. TCPI sebesar 1,33 berarti tim perlu memberikan 33% lebih banyak pekerjaan per dolar untuk semua yang tersisa, yang merupakan target pemulihan yang sangat sulit.
Inilah jenis peringatan dini yang diberikan EVM. Tanpanya, project manager mungkin melaporkan "kami menghabiskan $110.000 terhadap rencana $100.000" dan melewatkan masalah yang lebih dalam: tim baru 40% selesai, bukan 50%.
Praktik Terbaik
Jaga agar baseline tetap beku. Setujui re-baselining hanya ketika ruang lingkup asli berubah secara formal. Baseline yang bergerak setiap kuartal tidak dapat menjadi jangkar pengukuran kinerja yang bermakna.
Laporkan tren CPI, bukan hanya nilai saat ini. Penelitian oleh Christensen (direferensikan dalam panduan estimasi biaya NASA) menemukan bahwa CPI proyek jarang membaik lebih dari 10% setelah titik 20% selesai. Jika CPI di bawah 1,0 di awal, rencanakan untuk pembengkakan.
Hubungkan EVM dengan jalur kritis. SPI memberi tahu Anda bahwa kinerja jadwal buruk, tetapi tidak memberi tahu Anda tugas mana yang berada di jalur kritis. Selalu referensikan silang data EVM dengan jaringan jadwal Anda untuk menemukan tugas yang benar-benar mempengaruhi tanggal akhir.
Integrasikan dengan estimasi tiga titik. ETC menjadi lebih andal ketika paket kerja yang tersisa menggunakan estimasi berbasis rentang daripada estimasi satu titik. Skenario ETC pesimistis dapat dihitung dengan menerapkan faktor biaya pesimistis ke BAC - EV yang tersisa.
Sesuaikan frekuensi pelaporan dengan ukuran proyek. EVM mingguan pada program dua tahun menghasilkan banyak kebisingan. Bulanan adalah standar untuk sebagian besar proyek. Proyek yang sangat pendek (di bawah tiga bulan) mungkin mendapat manfaat dari pelacakan mingguan, tetapi overhead perhitungan EV harus proporsional dengan ukuran proyek.
Otomatiskan pengambilan AC. Mode kegagalan EVM terbesar dalam praktiknya adalah data biaya aktual yang tidak diperbarui. Jika tim melakukan pengumpulan timesheet manual dan merekonsiliasikannya sebulan sekali, aktualnya akan selalu tertinggal, dan CPI akan tidak dapat diandalkan. Hubungkan alat manajemen proyek Anda ke sistem akuntansi atau ERP Anda di mana pun memungkinkan.
Pertanyaan yang Sering Diajukan
Apa perbedaan antara EVM dan pelacakan anggaran tradisional?
Pelacakan anggaran tradisional membandingkan pengeluaran aktual (AC) dengan pengeluaran yang direncanakan (PV). Namun tidak memberi tahu Anda berapa banyak pekerjaan yang Anda selesaikan untuk pengeluaran tersebut. EVM menambahkan earned value (EV), yang memungkinkan Anda membedakan antara "kami menghabiskan lebih banyak karena kami melakukan lebih banyak pekerjaan" dan "kami menghabiskan lebih banyak dan tertinggal."
Bisakah EVM digunakan pada proyek Agile?
Ya, dengan adaptasi. Tim Agile sering menggunakan story points atau jumlah cerita sebagai unit untuk EV alih-alih dolar. Rumusnya bekerja dengan cara yang sama. Data Velocity Sprint secara alami dipetakan ke SPI. Beberapa tim menggabungkan EVM dengan burn-up chart Agile untuk mendapatkan tren jadwal sekaligus kinerja biaya dalam tampilan yang sama.
Apa nilai CPI atau SPI yang baik?
Di atas 1,0 berarti Anda lebih awal dari rencana. Di bawah 1,0 berarti Anda tertinggal. Dalam praktiknya, sebagian besar proyek besar menjalankan CPI antara 0,85 dan 1,05 untuk sebagian besar durasinya. CPI di bawah 0,75 pada titik 25% selesai adalah tanda peringatan serius. Targetkan CPI antara 0,95 dan 1,05 sebagai kisaran yang sehat.
Kapan saya harus menggunakan rumus EAC alternatif?
EAC standar = BAC / CPI adalah rumus yang paling tervalidasi secara statistik untuk program besar. Gunakan EAC = AC + (BAC - EV) (mengasumsikan pekerjaan di masa depan pada tingkat yang direncanakan) hanya jika Anda memiliki bukti kuat bahwa ketidakefisienan masa lalu adalah peristiwa satu kali, bukan masalah sistemis. Gunakan EAC = AC + ETC yang diestimasi ulang ketika ruang lingkup pekerjaan yang tersisa telah berubah secara signifikan dari rencana asli.
Apakah EVM memerlukan perangkat lunak khusus?
Tidak. Rumusnya bekerja dalam spreadsheet. Meskipun demikian, alat manajemen proyek khusus (Microsoft Project, Primavera P6, dan lainnya) memiliki perhitungan EVM bawaan. Persyaratan nyata bukan perangkat lunak melainkan kedisiplinan: Anda memerlukan baseline yang dibekukan, pelaporan persentase penyelesaian yang akurat, dan data biaya aktual yang tepat waktu.
EVM memberikan imbalan kepada tim yang berinvestasi dalam baseline yang solid dan pelaporan kemajuan yang jujur. Rumusnya sederhana. Disiplinnya tidak. Namun setelah Anda memiliki CPI dan SPI yang diperbarui setiap periode, Anda menggantikan rapat status proyek berbasis perasaan dengan angka yang memperkirakan tanggal akhir dan biaya akhir sebelum keduanya tiba.
Bacaan terkait

Senior Operations & Growth Strategist
On this page
- Apa Itu Earned Value Management?
- Tiga Nilai Inti EVM
- Rumus EVM
- Kesalahan Umum
- Cara Menggunakan Earned Value Management
- Langkah 1: Bangun performance measurement baseline
- Langkah 2: Tetapkan metode penyelesaian untuk setiap paket kerja
- Langkah 3: Kumpulkan biaya aktual setiap periode pelaporan
- Langkah 4: Hitung earned value
- Langkah 5: Hitung varians dan indeks
- Langkah 6: Perkirakan EAC dan ETC
- Langkah 7: Laporkan dan ambil tindakan
- Contoh Earned Value Management
- Praktik Terbaik
- Pertanyaan yang Sering Diajukan
- Bacaan terkait