ROI jedes AI Patterns messen
Turn this article into takeaways for your work.
Each assistant summarizes the article only for you and suggests best practices for your work.
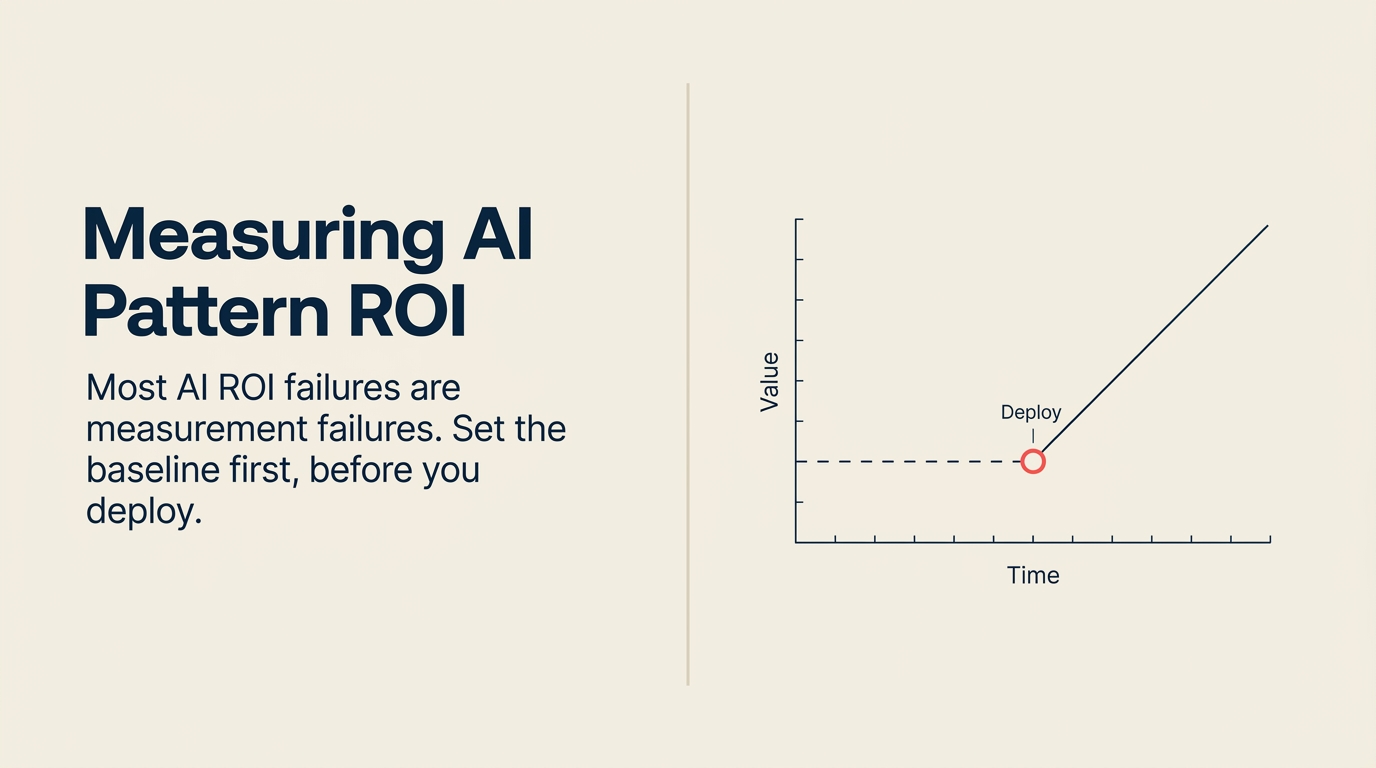
„AI-ROI ist schwer zu messen" ist fast immer eine Ausrede dafür, keine Messung vor dem Deployment einzurichten. Das eigentliche Problem ist nicht, dass AI-ROI von Natur aus unmessbar ist. Es ist, dass die meisten Teams zuerst deployen und danach fragen, was gemessen werden soll.
Zu dem Zeitpunkt, an dem sie über Messung nachdenken, gibt es keine Baseline. Keine Aufzeichnung vor dem Deployment darüber, wie lange Dinge dauerten, wie genau sie waren oder wie viel sie kosteten. Ohne Baseline können Sie nichts beweisen. Sie sind auf Intuition angewiesen, ob das System „funktioniert", während Ihr Finance-Team nach Belegen fragt und Ihr Vendor Ihnen eine Case Study schickt, die nichts mit Ihrer Situation zu tun hat.
Dieser Artikel gibt Ihnen das Measurement-Setup, das Sie vor dem Deployment jedes Patterns einrichten sollten. Nicht danach. Die Teams, die AI-ROI beweisen, sind diejenigen, die Baselines vor dem Deployment als Genehmigungsbedingung gefordert haben, nicht diejenigen, die deployt haben und das Beste erhofft haben.
Warum AI-Pattern-ROI-Messung anders ist
Software-ROI ist relativ stabil: Sie zahlen eine Lizenzgebühr, Sie erhalten eine Capability, die Capability spart oder verdient einen gewissen Betrag. Die Mathematik ändert sich nicht viel mit der Zeit, es sei denn, die Nutzung ändert sich. McKinseys Grundlagenstudie Economic Potential of Generative AI schätzt, dass Generative AI jährlich 2,6 bis 4,4 Billionen US-Dollar über 63 Enterprise-Anwendungsfälle hinzufügen könnte. Aber fast 75 % dieses Werts kommt aus nur vier Bereichen: Customer Operations, Marketing und Sales, Software Engineering und R&D. Ihr Measurement-Framework sollte zunächst auf die Patterns ausgerichtet sein, die diesen vier Bereichen dienen.
AI-Pattern-ROI hat drei komplizierende Eigenschaften, die Software-ROI nicht hat.
Erstens verbessern oder verschlechtern sich AI-Systeme mit der Zeit. Ein frisch trainiertes Scoring-Modell kann 85 % genau sein. Sechs Monate später kann es ohne Retraining 71 % genau sein, wenn sich Ihr Lead-Mix verschiebt. Der ROI folgt der Genauigkeitskurve, nicht einer fixen Linie.
Zweitens interagiert AI mit menschlichem Verhalten auf eine Weise, die beide Seiten verändert. Wenn ein Sales Rep eine Workflow Copilot-Empfehlung erhält, beginnt er, sich darauf zu verlassen. Wenn die Empfehlungen schlechter werden, wird auch der Output des Reps schlechter, obwohl das „System" technisch noch läuft. Menschliche Verhaltensänderungen sind Teil des ROI-Bildes.
Drittens ist die Kontrollgruppe in der Regel unvollkommen. Sie können auf Organisationsebene in den meisten Deployments keinen echten A/B-Test durchführen. Sie werden Vorher-Nachher-Vergleiche haben, was bedeutet, dass Sie saubere Baselines benötigen und andere Dinge, die sich im Messfenster geändert haben, berücksichtigen müssen.
Nichts davon macht Messung unmöglich. Es macht es wichtiger, im Voraus klar zu definieren.
Key Facts: AI ROI Measurement-Realität
- Nur 5 % der Unternehmen erzielen substanziellen AI-ROI im Maßstab, während 29 % der Führungskräfte ROI sicher messen können. 79 % sehen Produktivitätsgewinne, aber die Übersetzung operativer Gewinne in finanzielle Auswirkungen bleibt die zentrale Messherausforderung. (Master of Code, 2026)
- AI-Benutzer schließen Aufgaben 25,1 % schneller ab, mit 40 %+ höherer Qualität. Mitarbeiter berichten von einem durchschnittlichen Produktivitätsschub von 40 %, wobei die größten Gewinne bei neueren, weniger erfahrenen Arbeitnehmern auftreten. (Harvard Business School, 2025)
- Im Jahr 2026 hat der direkte finanzielle Auswirkung (Umsatzwachstum und Margenverbesserung) die Produktivitätsgewinne als primäre ROI-Metrik zum ersten Mal übertroffen. Der Enterprise AI-Markt ist über Produktivitätsargumente hinausgereift. (Futurum Group Enterprise AI Survey, 2026)
„Bis 2026 sank der Anteil der Produktivitätsgewinne als primäre AI-ROI-Metrik von 23,8 % auf 18 %, während der direkte finanzielle Auswirkung auf fast 21,7 % anstieg. Unternehmen sind nicht mehr zufrieden mit ‚AI hat uns Zeit gespart.' Sie wollen ‚AI hat Umsatz gewachsen oder Marge verbessert.' Das Measurement-Framework, das 2024 funktionierte, muss um finanzielle Auswirkungen, nicht um zurückgewonnene Stunden, neu aufgebaut werden." (Futurum Group Enterprise AI Report, 2026)
Die Pattern ROI Equation
Die Pattern ROI Equation ist ein Drei-Komponenten-Measurement-Framework, das erfordert: (1) Baseline, die spezifische Current-State-Messung mit Zeitstempel und Stichprobengröße vor dem Deployment; (2) Primary Metric, den direkten Output, den das Pattern verbessern soll, gemessen in Wochen 4-8 für frühzeitige Signale; und (3) Business Impact Metric, die Übersetzung der primären Metrik in Umsatz, Kosten oder Risikoreduzierung, die Finance validieren kann. Alle drei Komponenten müssen vor dem Deployment als Genehmigungsbedingung definiert werden, da es ohne eine Pre-Deployment-Baseline keinen ROI-Fall gibt. Die Gleichung hat vier Zeitgates: Wochen 1-3 sind Rauschen, Wochen 4-8 sind Leading Indicators, Monate 3-4 sind Business Impact-Signale und Monate 4-6 sind das minimale Datenfenster für eine statistisch sichere ROI-Präsentation.
Rework-Analyse: Basierend auf McKinseys Ergebnis, dass Generative AI jährlich 2,6-4,4 Billionen US-Dollar zum Enterprise-Wert hinzufügen könnte, aber 75 % aus nur vier Bereichen kommen (Customer Operations, Sales, Software Engineering, R&D), ist die Pattern ROI Equation kalibriert, um die Messung in diesen vier Bereichen zuerst zu priorisieren. Reworks Implementierungsdaten zeigen, dass Teams, die ihre Baseline vor dem Deployment definieren, ROI-Fälle innerhalb von 90 Tagen nach dem Go-live gegenüber Finance präsentieren. Teams, die Messung nach dem Deployment definieren, brauchen durchschnittlich 7,4 Monate, um einen glaubwürdigen ROI-Fall zu erstellen, wenn sie überhaupt einen erstellen.
Das Measurement-Framework
Für jedes Pattern-Deployment sind drei Dinge vor Go-live erforderlich:
Baseline: Was ist der aktuelle Stand? Spezifisch gemessen, mit einem Zeitstempel. Nicht „wir glauben, es dauert etwa 10 Minuten", sondern „wir haben 50 repräsentative Aufgaben zeitgemessen und der Mittelwert betrug 11,3 Minuten mit einer Standardabweichung von 2,4 Minuten." Wenn Sie nicht vor dem Deployment eine Baseline erstellen können, haben Sie danach keinen ROI-Fall.
Primary Metric: Der direkte Output, den das Pattern verbessern soll. Geschwindigkeit. Genauigkeit. Durchsatz. Dies ist, was Sie in Wochen 4-8 messen, um frühzeitige Signale zu sehen.
Business Impact Metric: Wie die primäre Metrik in Umsatz, Kosten oder Risikoreduzierung übersetzt wird. Gesparte Stunden × gemischter Stundensatz. Abgeschlossene Deals mit höherer Rate × durchschnittliche Deal-Größe. Gefangene False Positives × durchschnittlicher Verlust pro Vorfall. Business Impact ist das, was den CFO interessiert. Primäre Metriken sind der Weg dorthin.
Alle drei erforderlich. Wenn ein Team seine Baseline und seine Business Impact Metric nicht vor dem Deployment formulieren kann, sind sie nicht bereit zu deployen.
RAG Assistant ROI
Baseline: Durchschnittliche Zeit, um eine Richtlinien- oder Produktfrage ohne AI zu beantworten. Messen Sie dies, indem Sie ein Sample von Mitarbeitern die Zeit protokollieren lassen, die sie mit der Suche in Dokumentationen, dem Anrufen von Kollegen oder dem Warten auf Antworten verbringen. Für ein typisches Mid-Market-Unternehmen sind dies 8-15 Minuten pro wesentlicher Frage, 2-4 Fragen pro Mitarbeiter pro Tag.
Primary Metric: Zeit-bis-Antwort pro Query. Ziel: unter 90 Sekunden für Fragen, die die Wissensbasis gut abdeckt.
Business Impact Metrics: Support-Ticket-Deflektionsrate (wie viele L1-Tickets verarbeitet das RAG-System ohne menschliche Eskalation), Reduzierung der Onboarding-Rampzeit (neue Mitarbeiter erreichen schneller Produktivität, wenn sie sofort Antworten bekommen) und pro Woche zurückgewonnene Analysten-Stunden.
Beispielrechnung: 50 Mitarbeiter × 3 Fragen/Tag × 10 Minuten/Frage = 25 Stunden/Tag für die Suche nach Antworten. RAG reduziert das auf 1,5 Minuten/Frage für 70 % der Fragen: 50 × 3 × 0,7 × 1,5 Minuten = ~2,6 Stunden/Tag. Plus 50 × 3 × 0,3 × 10 Minuten = 7,5 Stunden für Fragen, die RAG nicht abdeckt. Netto: 25 Stunden auf 10 Stunden reduziert, ungefähr 15 Stunden/Tag zurückgewonnen. Bei einem gemischten Satz von 75 US-Dollar/Stunde sind das 1.125 US-Dollar/Tag, ungefähr 280.000 US-Dollar/Jahr. Und das ist vor der Berücksichtigung von Onboarding und Ticket-Deflektion.
Scoring and Routing ROI
Baseline: Aktuelle Lead-to-Meeting-Konversionsrate nach Rep, aktuelle Zeit von der Lead-Erstellung bis zum ersten Kontakt, aktuelle Support-Ticket-Lösungszeit nach Prioritätsstufe und aktuelle manuelle Routing-Fehlerrate (Leads falsch gerouteten Rep oder Tickets an falsches Team gesendet).
Primary Metric: Speed-to-First-Contact (Stunden von Lead-Erstellung bis zum ersten Rep-Kontaktversuch) und Routing-Genauigkeitsrate.
Business Impact Metrics: Win-Rate-Verbesserung (Leads, die innerhalb von 1 Stunde kontaktiert werden, konvertieren mit dem 2-4-fachen der Rate von Leads, die nach 24 Stunden kontaktiert werden, was in der Sales-Forschung gut dokumentiert ist), Umsatz pro Rep und Ticket-Lösungskosten pro Stufe.
Beispielrechnung: Wenn Ihr aktueller Median-Speed-to-First-Contact 4 Stunden beträgt und Scoring+Routing ihn für High-Score-Leads auf 30 Minuten bringt, und wenn die 1-Stunden-Konversionsprämie gilt, sollte Ihre Win-Rate bei High-Score-Leads messbar steigen. Wenn High-Score-Leads 20 % des Inbound-Volumens ausmachen und Sie derzeit 15 % davon abschließen, ergibt eine 30-prozentige relative Verbesserung (auf 19,5 %) bei 100 Leads/Monat 4-5 zusätzliche abgeschlossene Deals. Bei einem ACV von 25.000 US-Dollar sind das 100.000-125.000 US-Dollar/Monat an zusätzlicher Umsatzzurechnung. Innerhalb von 60-90 Tagen messbar.
Vision Extract ROI
Baseline: Kosten pro manuell verarbeitetem Dokument. Arbeitszeit (Minuten pro Dokument × Stundensatz), Fehlerkorrekturkosten (welcher Prozentsatz der Dokumente erfordert Korrekturen, wie lange dauern Korrekturen) und Durchlaufzeit von Dokumentenempfang bis System-of-Record-Eintrag einbeziehen.
Primary Metric: Verarbeitete Dokumente pro Stunde (Durchsatz), Fehlerrate bei extrahierten Feldern.
Business Impact Metrics: AP-Durchlaufzeit (wie lange von Rechnungserhalt bis zahlungsbereit), Finance-Headcount-Effizienz (können Sie mehr Volumen mit demselben Team verarbeiten, anstatt bei Skalierung Headcount hinzuzufügen?) und Prüfungsgenauigkeit (sind extrahierte Datensätze genauer oder weniger genau als manuell eingegebene Datensätze?).
Beispielrechnung: Manuelle Rechnungsverarbeitung: 5 Minuten pro Rechnung, 35 US-Dollar/Stunde Arbeit = 2,92 US-Dollar/Rechnung. Vision Extract-Verarbeitung: 15 Sekunden menschliche Überprüfung pro Rechnung für Qualitätskontrolle plus 0,04 US-Dollar API-Kosten = 0,38 US-Dollar/Rechnung. Bei 500 Rechnungen/Monat: manuell = 1.460 US-Dollar/Monat, automatisiert = 190 US-Dollar/Monat. Nettoeinsparungen: 1.270 US-Dollar/Monat oder etwa 15.000 US-Dollar/Jahr. Das ist vor dem sich verstärkenden Vorteil: Bei 2.000 Rechnungen/Monat (Wachstum) ist manuell = 5.840 US-Dollar/Monat, automatisiert = 760 US-Dollar/Monat. Die Lücke vergrößert sich mit dem Maßstab.
Meeting Intelligence ROI
Baseline: Zeit, die Sales Reps für die Post-Call-Administration aufwenden (CRM-Updates, Follow-up-E-Mail-Entwürfe, Zusammenfassungsschreiben). Der Artikel Von Anruf zu CRM-Update automatisch zeigt, wie dies im Sales-Kontext von Anfang bis Ende aussieht. Außerdem CRM-Datenvollständigkeit als Baseline: Welcher Prozentsatz der erforderlichen Felder ist nach einem Anruf tatsächlich ausgefüllt, und welcher Prozentsatz der Action Items aus Anrufen erscheinen als CRM-Aufgaben?
Primary Metric: Zeit gespart pro Anruf bei Post-Call-Admin. Typische Baseline: 15-25 Minuten pro Anruf bei Admin. Ziel: 3-5 Minuten für Überprüfung und Genehmigung AI-generierter Datensätze.
Business Impact Metrics: Coaching-Effektivität (sehen Manager vollständigere Daten, um Coaching-Möglichkeiten zu identifizieren?), Deal-Close-Rate-Verbesserung für gecoachte Reps und Admin-Stunden pro Rep pro Woche.
Beispielrechnung: 8 Anrufe/Woche × 20 Minuten Post-Call-Admin = 2,67 Stunden/Woche pro Rep für reine Admin. Meeting Intelligence reduziert auf 5 Minuten Überprüfung × 8 Anrufe = 40 Minuten/Woche. Netto: 1,9 Stunden/Woche zurückgewonnen pro Rep. Bei 10 Reps sind das 19 Stunden/Woche. Bei 60 US-Dollar/Stunde vollständig belasteten Rep-Kosten sind das 1.140 US-Dollar/Woche oder etwa 57.000 US-Dollar/Jahr. Aber die größere Zahl ist der Coaching-Auswirkung: Wenn die CRM-Datenvollständigkeit von 40 % auf 85 % steigt, können Manager tatsächlich identifizieren, welche Reps bei welchen Anrufphasen Coaching benötigen, und Close-Rates für gecoachte Reps verbessern sich um 15-20 %. Dieser Umsatzauswirkung überwiegt die Admin-Einsparungen bei weitem.
Anomaly Agent ROI
Baseline: Mean Time to Detect eine Anomalie mit manueller Überprüfung, False-Negative-Rate bei manueller Anomalieerkennung (welcher Prozentsatz der echten Anomalien werden von Menschen verpasst?) und die Kosten, wenn eine Anomalie verpasst wird (durchschnittlicher Betrugsschaden, durchschnittliche Vorfallskosten, durchschnittliche Compliance-Buße).
Primary Metric: Erkennungsrate (erfasste True Positives / Gesamtzahl echter Anomalien) und False-Positive-Rate (Alerts bei normalem Verhalten ausgelöst / Gesamt-Alerts).
Business Impact Metrics: Verhinderte Verluste (bei Betrugserkennung: verhinderte \(/ überprüfte riskante\)), vermiedene Vorfälle (bei Uptime-Monitoring: verhinderte Ausfallstunden × stündliche Ausfallkosten) und Compliance-Verstöße, die aufgegriffen wurden, bevor sie zu Bußgeldern werden.
Beispielrechnung für Betrugserkennung: Wenn Ihr Unternehmen monatlich 2 Millionen US-Dollar an Transaktionen verarbeitet und Ihre aktuelle manuelle Betrugserkennung 60 % der Betrugsereignisse mit einer durchschnittlichen Betrugsrate von 0,3 % (6.000 US-Dollar/Monat an tatsächlichem Betrug) erfasst, erleben Sie derzeit 2.400 US-Dollar/Monat an verpasstem Betrug. Wenn Anomaly Agent die Erkennungsrate auf 90 % verbessert, verhindern Sie 1.800 US-Dollar/Monat an Betrug (21.600 US-Dollar/Jahr). Bei 10 Millionen US-Dollar/Monat Volumen sind das 108.000 US-Dollar/Jahr an direkter Verlustprävention. Und das ist vor der Berücksichtigung der Untersuchungsarbeit, die das Team manuell bei Low-Risk-Alerts durchführte.
Generative Research, Document Review, Workflow Copilot, Personalization Engine, Autonomous Agent
Generative Research: Baseline-Forschungszeit pro Aufgabe (Analysten-Stunden zur Erstellung eines Competitive Intelligence-Briefings oder Account-Research-Pakets). Primary Metric: Zeit pro Forschungsaufgabe. Business Impact: zurückgewonnene Analysten-Stunden, Qualitätsverbesserung bei Outputtiefe und Zitiergenauigkeit. Typisches ROI-Signal: 3-4 Stunden pro Forschungsaufgabe auf 45-60 Minuten reduziert, mit messbarer Qualitätsverbesserung bei zitierten Quellen.
Document Review: Baseline: Durchlaufzeit von Vertragseingang bis Anwalts-Review abgeschlossen, Prozentsatz der beim ersten Review gefangenen Vertragsabweichungen. Primary Metric: überprüfte Dokumente pro Anwaltsstunde, Abweichungserfassungsrate. Business Impact: Reduzierung der Vertragsdurchlaufzeit, Haftungsreduzierung durch aufgegriffene Klauseln. Schlüsselmessung: Verfolgen Sie den Prozentsatz der „Catches", die von menschlichen Anwälten als echte Probleme validiert werden (keine AI-False-Flags). Dieser Prozentsatz ist Ihr Qualitätssignal.
Workflow Copilot: Baseline: abgeschlossene Aufgaben pro Stunde für den Ziel-Workflow. Primary Metric: Aufgaben pro Stunde mit Copilot, Vorschlagsannahmerate. Business Impact: Produktivitätslift pro Benutzer, Adoptionsrate nach 90 Tagen. Warnung: Die Adoptionsrate ist ein Leading Indicator des tatsächlichen Produktivitätsauswirkung. Wenn Benutzer Vorschläge ohne Lesen annehmen, sind Ihre Genauigkeitszahlen aufgebläht und Ihre Haftung höher. MIT Sloan-Feldforschung zu den Auswirkungen generativer AI auf hochqualifizierte Arbeitnehmer fand heraus, dass der Zugang zu Copilot-Style-Tools die wöchentlich abgeschlossenen Aufgaben um durchschnittlich 26 % steigerte, wobei die größten Gewinne bei neueren, weniger erfahrenen Arbeitnehmern auftraten. Diese Segmentierung ist es wert, in Ihr eigenes Measurement-Framework eingebaut zu werden.
Personalization Engine: Baseline: Konversionsrate und durchschnittlicher Bestellwert in der aktuellen nicht-personalisierten oder regelbasierten Erfahrung. Primary Metric: Konversionslift und AOV-Lift für personalisierte vs. Kontrollgruppen. Business Impact: Umsatz pro Benutzer, Customer Lifetime Value. Dies ist das am leichtesten A/B-testbare Pattern in der Liste. Sie können echte kontrollierte Experimente durchführen.
Autonomous Agent: Baseline: Vollkosten des menschlichen Workflows, den der Agent ersetzt oder erweitert, einschließlich aller menschlichen Touchpoints. Primary Metric: abgeschlossene Aufgaben pro Stunde, Fehlerrate pro Aufgabe. Business Impact: Gesamtbetriebskosten (TCO) einschließlich des Governance-Overheads (menschliche Review-Zeit, Audit-Trail-Management, Incident Response). Warnung: Autonomous Agent TCO wird fast immer unterschätzt. Der Governance-Overhead für ein gut geführtes Deployment kann 30-50 % zu den scheinbaren Automatisierungseinsparungen hinzufügen. Lesen Sie den Cost Overrun-Artikel für das vollständige Kostenmodell.
Der ROI-Measurement-Zeitplan
Treffen Sie keine Go/No-Go-Entscheidungen auf Basis von zu frühen Daten.
Wochen 1-3: System wird genutzt. Benutzer lernen. Verhalten ist atypisch. Daten aus diesem Zeitraum sind Rauschen.
Wochen 4-8: Frühzeitige Leading Indicators erscheinen. Zeitersparnisdaten werden aussagekräftig. Adoptionsrate stabilisiert sich. Dies ist der Zeitpunkt, an dem Sie primäre Metriken prüfen.
Monate 3-4: Business Impact-Metriken beginnen, Signale zu zeigen. Win-Rates, Konversionsraten, Kosten-pro-Einheit-Metriken haben genug Daten, um aussagekräftig zu sein.
Monate 4-6: Vollständiges ROI-Bild mit genug statistischer Sicherheit für langfristige Entscheidungen. Wenn Sie Finance einen ROI-Fall präsentieren, ist dies das minimale erforderliche Datenfenster.
Häufige Messfehler
Vergleich mit einer defekten Baseline. Wenn Ihr Pre-Deployment-Prozess wirklich defekt war (niemand führte tatsächlich die Aufgabe durch, die die AI jetzt ausführt, oder die Aufgabe wurde falsch durchgeführt), wird die AI wundersam erscheinen. Das ist kein ROI. Das ist das Ersetzen von nichts durch etwas. Finance wird es durchschauen, und Sie werden kein echtes Leistungssignal haben.
Nur die primäre Metrik messen ohne Business Impact. „Die AI beantwortet Fragen 80 % schneller" ist keine ROI-Behauptung. „Die AI beantwortet Fragen 80 % schneller, was 15 Stunden/Woche Analysten-Zeit einspart, die diese Analysten freimacht, um 4 zusätzliche umsatzgenerierende Analysen pro Quartal abzuschließen, die sonst nicht stattgefunden hätten" ist eine ROI-Behauptung.
AI-Attribution nicht von anderen Initiativen trennen. Wenn Sie den RAG Assistant in demselben Quartal deployed haben, in dem Sie 5 neue Support-Reps eingestellt, Ihre Wissensbasstruktur verbessert und ein neues Ticketing-System eingeführt haben, können Sie keine Ticket-Deflektionsverbesserungen allein der AI zuschreiben. Messzeiträume sollten so sauber wie möglich von parallelen Initiativen sein. Lesen Sie Governance Requirements by Pattern für Audit Trails, die eine saubere Attribution unterstützen.
Entscheidungen treffen, bevor Patterns sich stabilisiert haben. AI-Patterns sammeln Drift. Der ROI eines gut gepflegten Patterns in Monat 12 kann sehr anders aussehen als in Monat 3. Überprüfen Sie Ihre ROI-Metriken nach einem konsistenten Zeitplan, nicht nur am Anfang und kurz vor der Vertragsverlängerung.
Vendor-ROI-Behauptungen ohne eigene Messung akzeptieren. Vendor-Case-Studies sind das bestmögliche Ergebnis für den bestmöglichen Kunden. Ihre Baseline, Ihr Workflow, Ihre Datenqualität und Ihre Adoptionsrate werden alle abweichen. Vendor-ROI-Schätzungen sind nützlich für das Setzen von Erwartungen, nicht für die Genehmigung von Business Cases. Lesen Sie die Buy vs. Build-Entscheidung dazu, wie Vendor-Behauptungen gegen Ihre eigene Kostenstruktur bewertet werden.
Das Measurement-Framework ist nicht optional. Es ist der Mechanismus, durch den AI-Investitionen entweder anhaltende Finanzierung verdienen oder beim nächsten Budgetzyklus still eingestellt werden. Patterns mit klaren Baselines und verfolgtem Business Impact überleben. Patterns, bei denen „wir glauben, es hilft" der ROI-Fall ist, nicht. Für die Gründe, warum Sales Ops die ROI-Rankings konsistent anführt, finden Sie die Benchmarks in Warum Sales Operations der AI-Anwendungsfall mit dem höchsten ROI ist.
Richten Sie die Messung ein, bevor Sie deployen. Nicht statt zu deployen. Davor.
Häufig gestellte Fragen
Was ist die Pattern ROI Equation?
Die Pattern ROI Equation erfordert drei Komponenten, die vor dem Deployment definiert werden: eine spezifische Baseline (gemessen mit Zeitstempel und Stichprobengröße), eine primäre Metrik (der direkte Output, den das Pattern verbessert, gemessen in Wochen 4-8) und eine Business Impact-Metrik (Umsatz, Kosten oder Risikoreduzierung, die Finance validieren kann). Alle drei sind vor Go-live als Genehmigungsbedingung erforderlich. Ohne eine Pre-Deployment-Baseline gibt es keinen ROI-Fall.
Warum scheitern die meisten AI-ROI-Messungen?
Teams deployen zuerst und richten die Messung danach ein. Wenn sie darüber nachdenken, was gemessen werden soll, gibt es keine Baseline. Ohne eine Pre-Deployment-Baseline können Sie nicht beweisen, was sich verändert hat. Das Pattern kann gut performen, aber der ROI-Fall ist unmöglich zu konstruieren, weil es kein „Vorher" zum Vergleich gibt. Nur 29 % der Führungskräfte können AI-ROI sicher messen, während 79 % Produktivitätsgewinne sehen, was genau diese Lücke ist: operativer Wert sichtbar aber auf finanziell glaubwürdige Weise unmessbar.
Wann wird AI-ROI typischerweise messbar?
Wochen 1-3 sind Rauschen, während Benutzer das System lernen. Wochen 4-8 produzieren Leading Indicators (primäre Metriken). Monate 3-4 produzieren Business Impact-Signale mit genug Daten, um aussagekräftig zu sein. Monate 4-6 sind das minimale Datenfenster für eine statistisch sichere ROI-Präsentation gegenüber Finance. Go/No-Go-Entscheidungen vor Monat 3 produzieren fast immer falsche Schlussfolgerungen in beide Richtungen.
Welches AI-Pattern produziert ROI am schnellsten?
RAG Assistant und Vision Extract produzieren typischerweise messbaren ROI innerhalb von 30-60 Tagen, weil die primären Metriken (Zeit-bis-Antwort und Dokumente-pro-Stunde) sofort messbar sind und die Baselines leicht zu erstellen sind. Meeting Intelligence produziert innerhalb von 30 Tagen erheblichen ROI bei Admin-Zeitersparnissen, wobei der größere Coaching-ROI nach 3-6 Monaten sichtbar wird. Scoring and Routing ROI erfordert mindestens 60-90 Tage, um eine Lead-Konversionsverbesserung zu zeigen, weil der Feedback-Loop die Deal-Zykluszeit umfasst.
Wie verändert sich AI-ROI mit der Zeit?
AI-Systeme verbessern oder verschlechtern sich mit der Zeit, was bedeutet, dass der ROI der Genauigkeitskurve folgt, nicht einer fixen Linie. Ein frisch trainiertes Scoring-Modell mit 85 % Genauigkeit, das über 6 Monate ohne Retraining auf 71 % Genauigkeit sinkt, produziert proportional sinkenden ROI. Die Aufrechterhaltung von ROI erfordert denselben Wartungsrhythmus wie die Governance-Anforderungen: regelmäßige Modellüberprüfungen, Wissensbasen-Refreshes und Baseline-Neukalibrierungen bei sich ändernden Geschäftsbedingungen.
Was hat sich 2026 an der AI-ROI-Messung geändert?
Direkter finanzieller Auswirkung (Umsatzwachstum und Margenverbesserung) wurde zum ersten Mal zur primären ROI-Metrik und überholte Produktivitätsgewinne. Das Produktivitätsargument (gesparte Stunden, schneller abgeschlossene Aufgaben) war für die Pilotphase angemessen. Unternehmen im Jahr 2026 erwarten, dass AI direkt mit Umsatzwachstum oder Margenverbesserung verbunden ist. Die Business Impact Metric-Komponente der Pattern ROI Equation ist der Mechanismus, um diese Verbindung vor dem Deployment explizit herzustellen.
Mehr erfahren

Co-Founder, Rework.com
On this page
- Warum AI-Pattern-ROI-Messung anders ist
- Die Pattern ROI Equation
- Das Measurement-Framework
- RAG Assistant ROI
- Scoring and Routing ROI
- Vision Extract ROI
- Meeting Intelligence ROI
- Anomaly Agent ROI
- Generative Research, Document Review, Workflow Copilot, Personalization Engine, Autonomous Agent
- Der ROI-Measurement-Zeitplan
- Häufige Messfehler
- Mehr erfahren