PESTEL Analysis: Framework, Examples, and Template
Turn this article into takeaways for your work.
Each assistant summarizes the article only for you and suggests best practices for your work.
PESTEL analysis is the go-to framework for scanning the macro environment that surrounds your business. It organizes external forces into six categories so strategists can spot threats early and seize opportunities before competitors do.
What is a PESTEL analysis?
PESTEL analysis is a structured method for identifying and evaluating the external macro-environmental forces that affect an organization's strategy and operations. Unlike SWOT analysis, which looks at both internal and external factors, PESTEL focuses entirely on outside forces the organization cannot directly control.
The framework traces back to Harvard professor Francis Aguilar, who introduced the ETPS scan (Economic, Technical, Political, Social) in his 1967 book Scanning the Business Environment. Researchers later rearranged the acronym to PEST, then added Environmental and Legal dimensions in the 1980s and 1990s to reflect rising regulatory complexity and sustainability pressures. The result is the six-factor PESTEL (sometimes spelled PESTLE) model widely used in strategic thinking and planning today.
Key Facts
McKinsey's 2024 Global Survey found 70% of executives expect external geopolitical risk to materially affect strategy in the next three years. (McKinsey & Company, 2024)
Gartner forecasts global IT spending will exceed $5.6 trillion in 2025, underscoring how fast the Technological dimension shifts. (Gartner IT Spending Forecast, 2025)
PwC's 27th Annual Global CEO Survey found 45% of CEOs do not believe their company will be viable in 10 years without significant reinvention. (PwC, 2024)
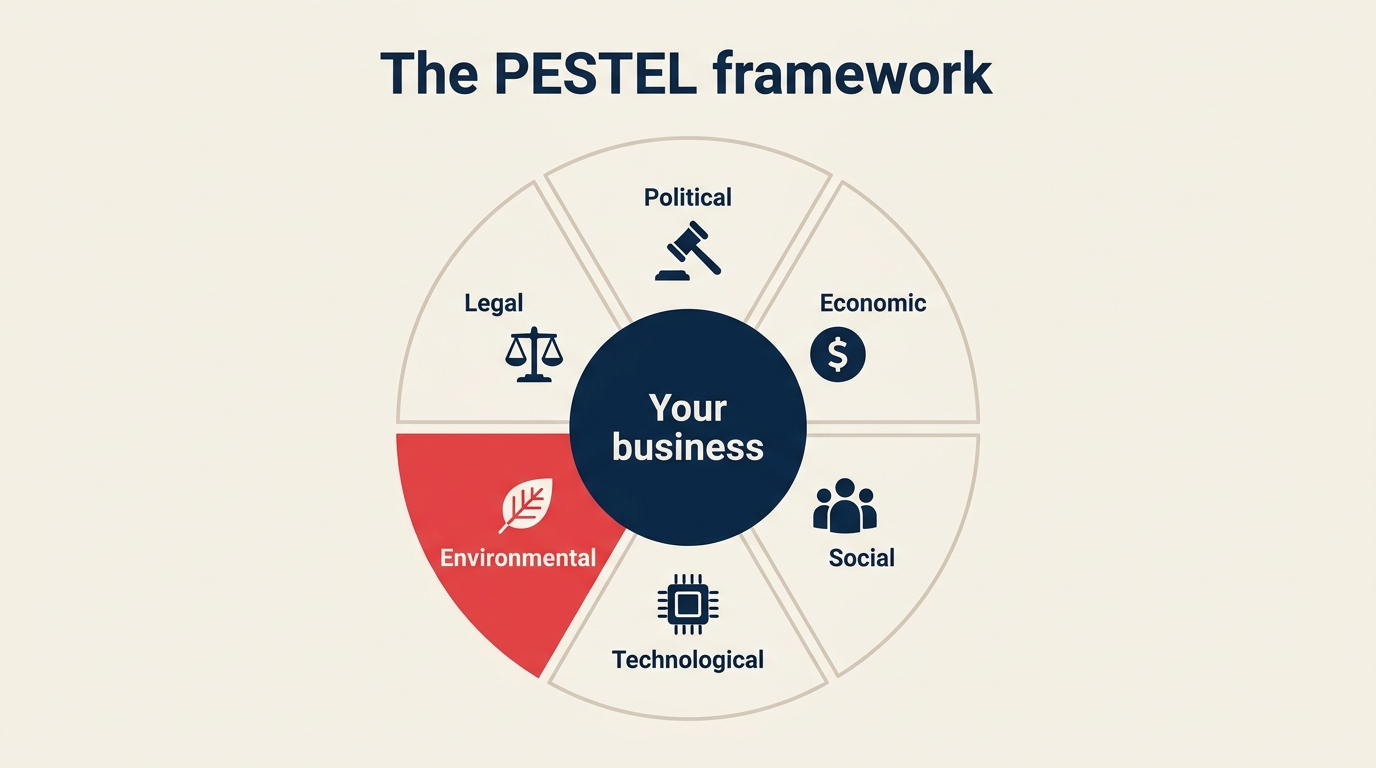
The 6 PESTEL factors explained
Political
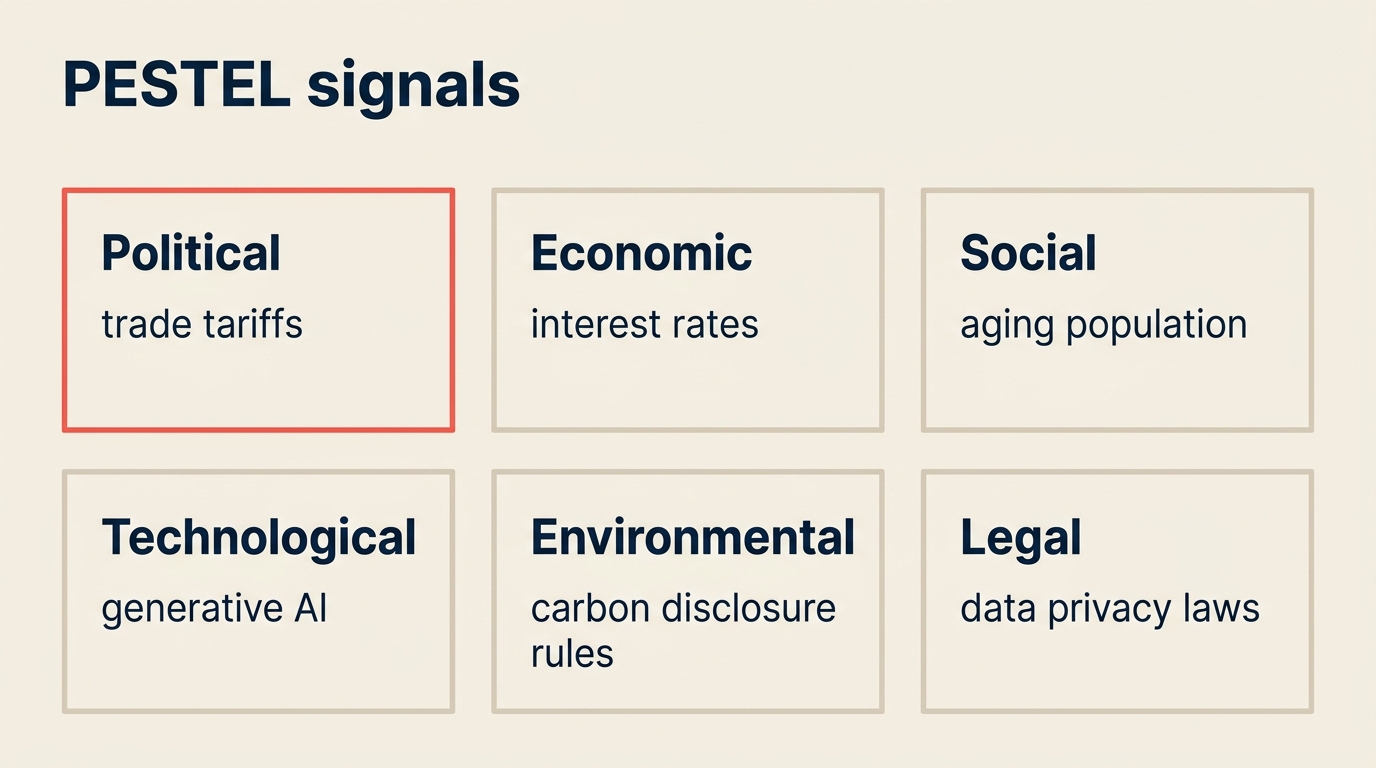
Political factors cover government policy, political stability, trade agreements, tariffs, and the regulatory stance of authorities at local, national, and supranational levels. They set the rules of the game for entire industries.
Real-world examples:
- US-China tariff cycles forcing electronics manufacturers to diversify supply chains away from single-country sourcing
- Brexit reshaping pharmaceutical distribution networks across the UK and EU
- Government subsidies for electric vehicles accelerating EV adoption in Germany, China, and California
Economic
Economic factors capture the macroeconomic conditions affecting purchasing power, cost of capital, and consumer confidence: GDP growth rates, inflation, interest rates, exchange rates, and unemployment trends.
Real-world examples:
- Rising interest rates in 2022-2024 increasing the cost of debt-financed SaaS expansion and chilling M&A activity
- Currency depreciation in emerging markets shrinking the USD-equivalent revenue of companies with local pricing
- Post-pandemic labor shortages driving up wages in logistics, hospitality, and healthcare sectors
Social
Social factors reflect the demographic and cultural context in which a business operates: population age, urbanization rates, education levels, lifestyle shifts, and changing consumer values.
Real-world examples:
- Aging populations in Japan and Western Europe expanding demand for elder-care technology and services
- Gen Z preference for purpose-driven brands pushing consumer goods companies toward sustainability transparency
- Remote-work normalization permanently altering demand for commercial real estate and commuter services
Technological
Technological factors cover the pace of innovation, R&D investment, automation, digital infrastructure, and the emergence of disruptive platforms that change how products are built or distributed.
Real-world examples:
- Generative AI reducing the cost of content production by orders of magnitude, compressing margins for traditional media
- Cloud-native architectures enabling startups to match enterprise-grade reliability without legacy infrastructure costs
- 5G rollout unlocking real-time industrial IoT applications in manufacturing and logistics
Environmental
Environmental factors address climate risk, natural resource availability, carbon regulations, waste management, and the physical impacts of climate change on business operations and supply chains.
Real-world examples:
- Mandatory carbon disclosure rules (EU CSRD, SEC climate rule) increasing reporting costs for publicly listed companies
- Water scarcity in key agricultural regions disrupting food and beverage supply chains
- Extreme weather events raising insurance premiums and forcing site-selection reviews for data centers
Legal
Legal factors encompass legislation, court precedent, and compliance requirements that directly constrain or enable business decisions: employment law, IP protection, antitrust rules, and data privacy regulations.
Real-world examples:
- GDPR and CCPA reshaping how SaaS companies collect, store, and process user data, adding significant compliance overhead
- Increasing antitrust scrutiny of big-tech acquisitions extending deal timelines and raising deal-failure risk
- Stricter EU AI Act requirements forcing AI vendors to re-architect high-risk application categories
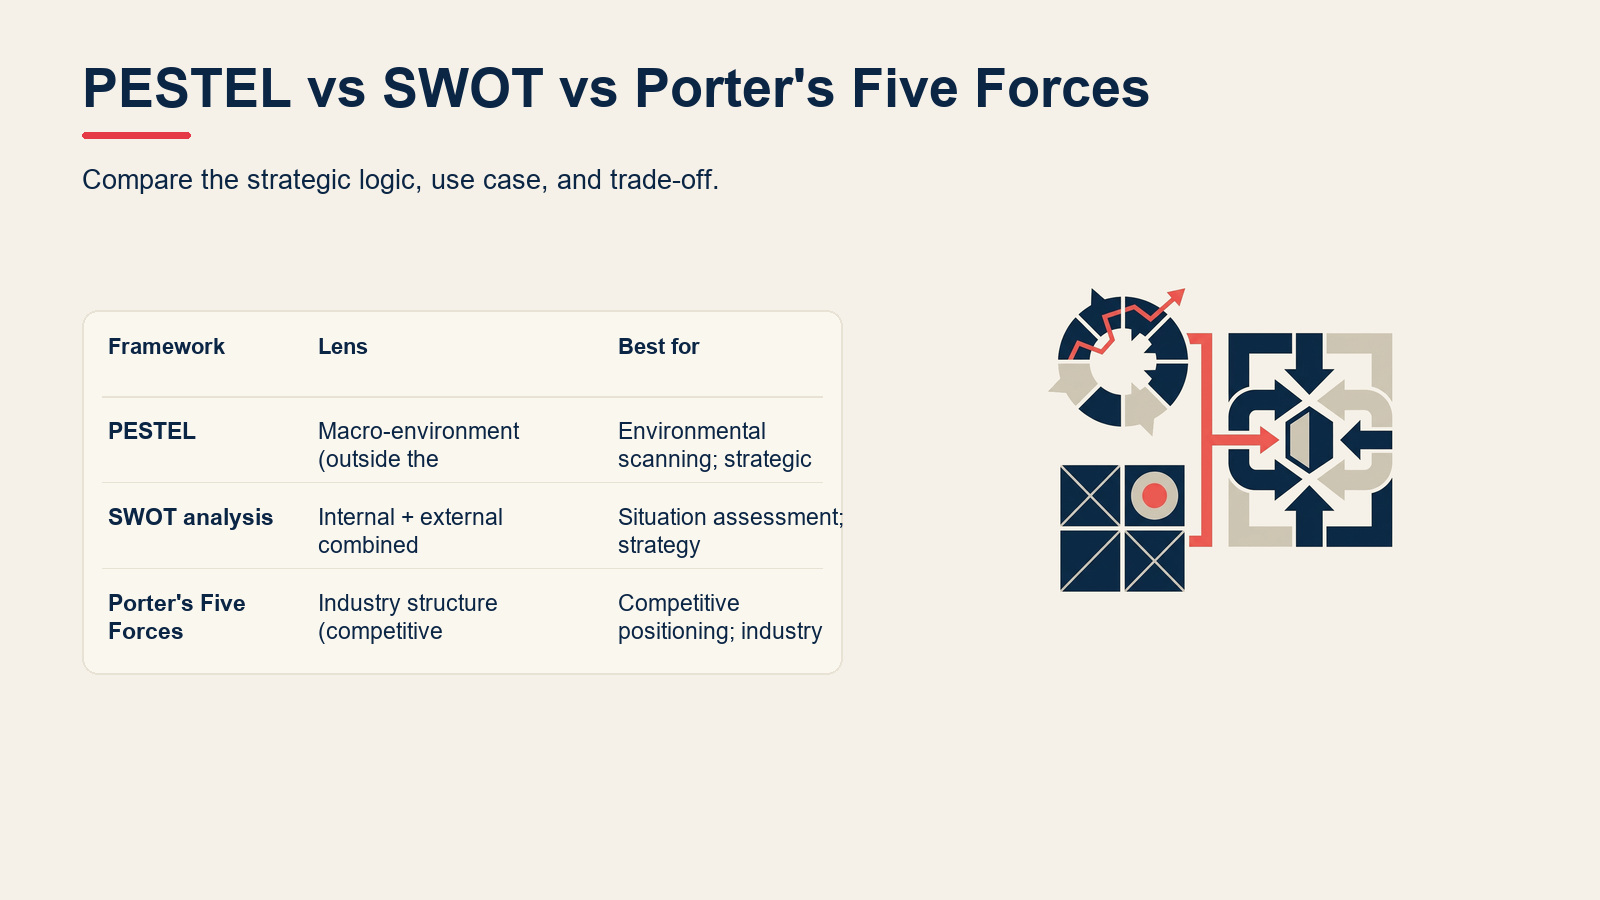
PESTEL vs SWOT vs Porter's Five Forces
| Framework | Lens | Best for | Output |
|---|---|---|---|
| PESTEL | Macro-environment (outside the industry) | Environmental scanning; strategic context | List of opportunities and threats from external forces |
| SWOT analysis | Internal + external combined | Situation assessment; strategy formulation | Strengths, Weaknesses, Opportunities, Threats grid |
| Porter's Five Forces | Industry structure (competitive dynamics) | Competitive positioning; industry attractiveness | Profitability assessment of the competitive environment |
These frameworks are complementary, not competing. A common sequence is: run PESTEL first to understand macro context, feed the Opportunities and Threats into a SWOT analysis, then use Porter's Five Forces to sharpen competitive positioning. Pair PESTEL findings with critical success factors to prioritize where to invest.
Benefits of running a PESTEL analysis
This view separates the main parts of benefits of running a pestel analysis so the details below are easier to compare.
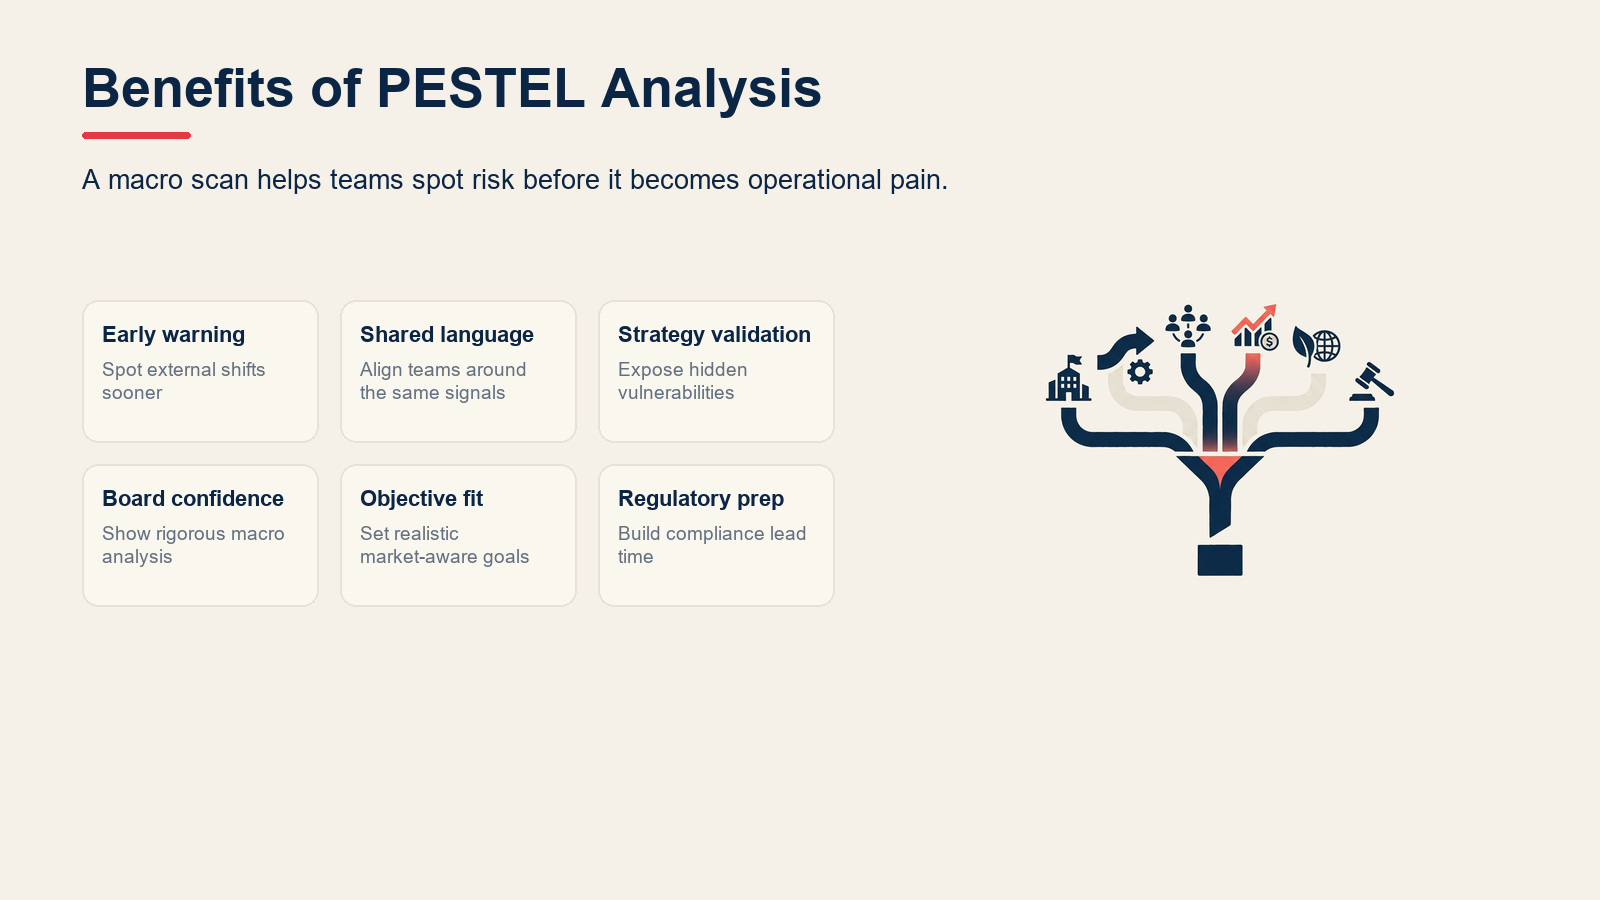
- Early warning system. Surfacing political or economic shifts before they materialize as crises gives leadership time to adapt rather than react.
- Shared language. A structured six-factor scan gets sales, finance, and operations teams looking at the same external signals, reducing siloed assumptions.
- Strategy validation. Testing a new product, market entry, or business model canvas against PESTEL factors quickly exposes hidden vulnerabilities.
- Board and investor confidence. Demonstrating rigorous macro-analysis in strategy decks signals to boards and investors that leadership understands its operating environment.
- Alignment with SMART business objectives. Environmental data helps leaders set realistic, context-aware targets rather than aspirational numbers detached from market reality.
- Regulatory preparedness. Proactively tracking legal and environmental trends reduces the cost of compliance by building in lead time.
Limitations of PESTEL
This view separates the main parts of limitations of pestel so the details below are easier to compare.
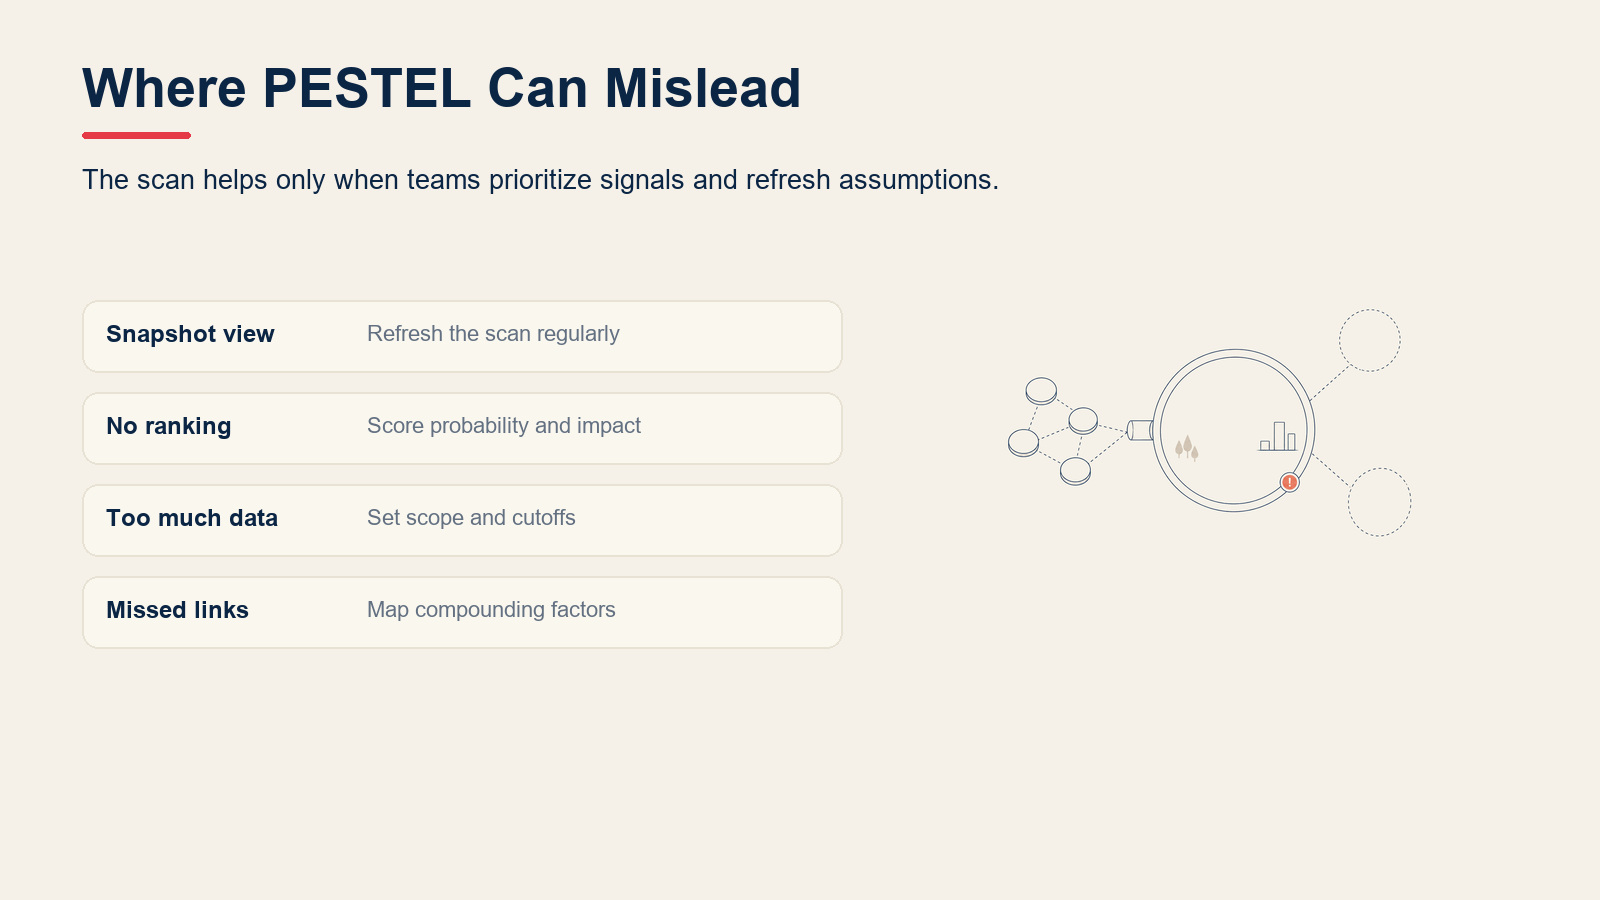
- Snapshot, not a movie. PESTEL captures conditions at a point in time. Without regular refreshes, it goes stale quickly in fast-moving sectors.
- No prioritization built in. The framework lists factors but doesn't rank them by probability or financial impact. Teams still need a scoring step to distinguish signal from noise.
- Risk of analysis paralysis. Broad scans can generate hundreds of factors. Without a clear scope and cut-off criteria, teams spend more time cataloguing than deciding.
- Interdependencies are easy to miss. A supply-chain tariff is both Political and Economic; GDPR is both Legal and Technological. Treating factors in isolation can understate compounding risks.
How to do a PESTEL analysis in 6 steps
Step 1: Define scope and timeframe
Clarify what you are scanning and over what horizon. Are you assessing a specific product line, a new geography, or the whole business? A 12-month tactical scan differs from a 5-year strategic look. Assign a facilitator and bring in cross-functional perspectives (finance, legal, ops, product) from the start.
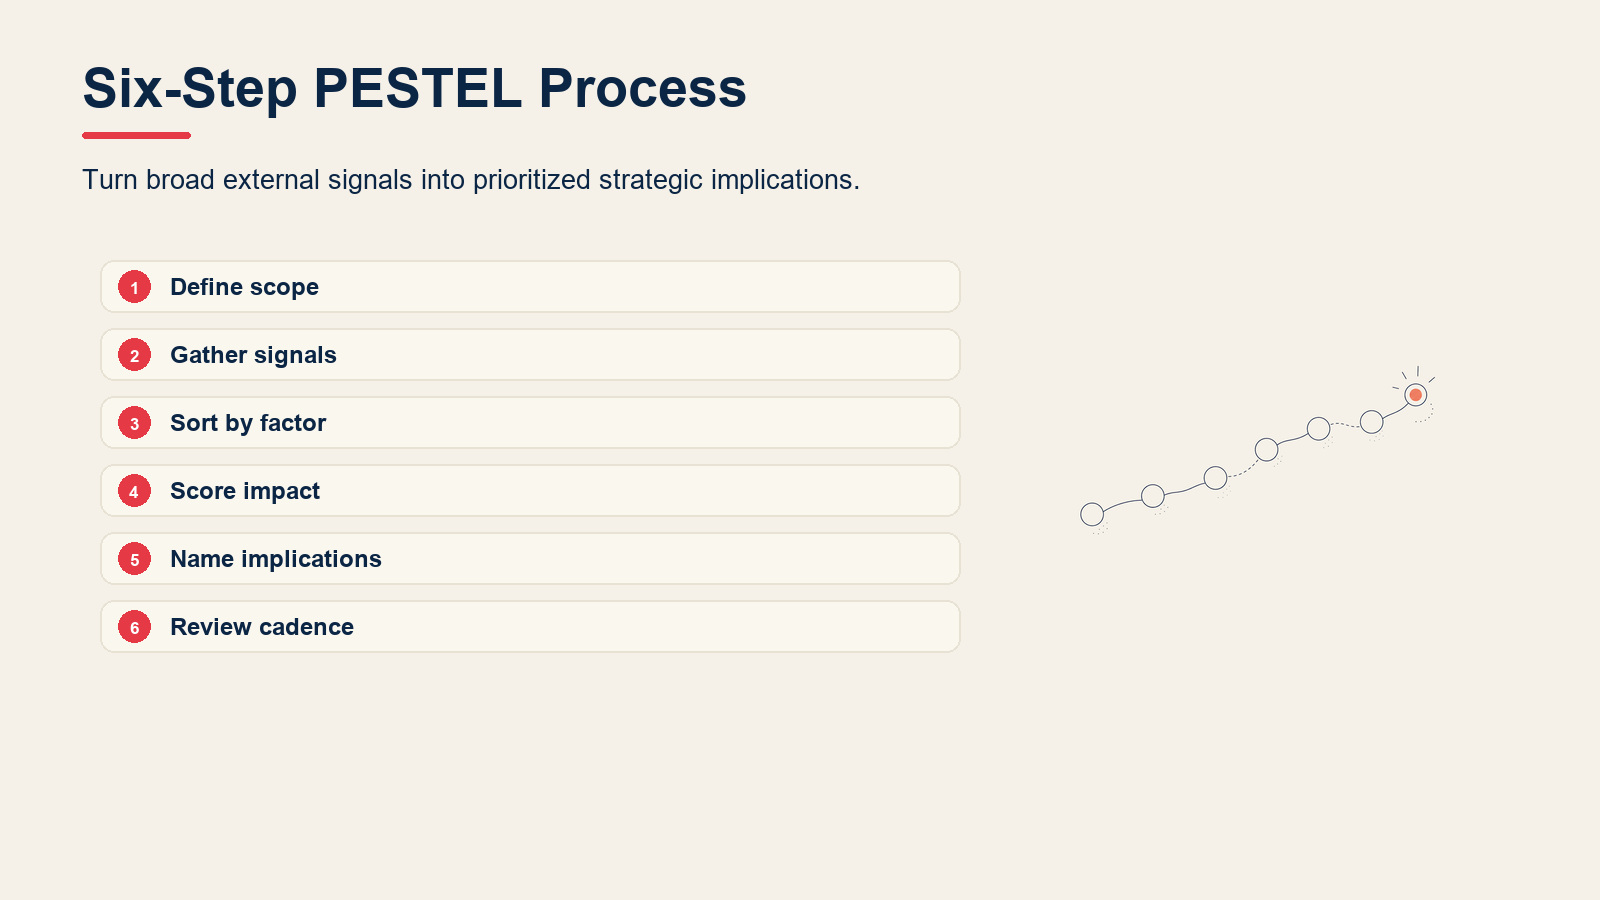
Step 2: Brainstorm factors across all 6 categories
Use a workshop format with six columns (or a shared document). Each team member contributes factors freely before filtering. Draw on analyst reports, regulatory trackers, news feeds, and customer intelligence. Aim for 5-10 candidate factors per category before pruning.
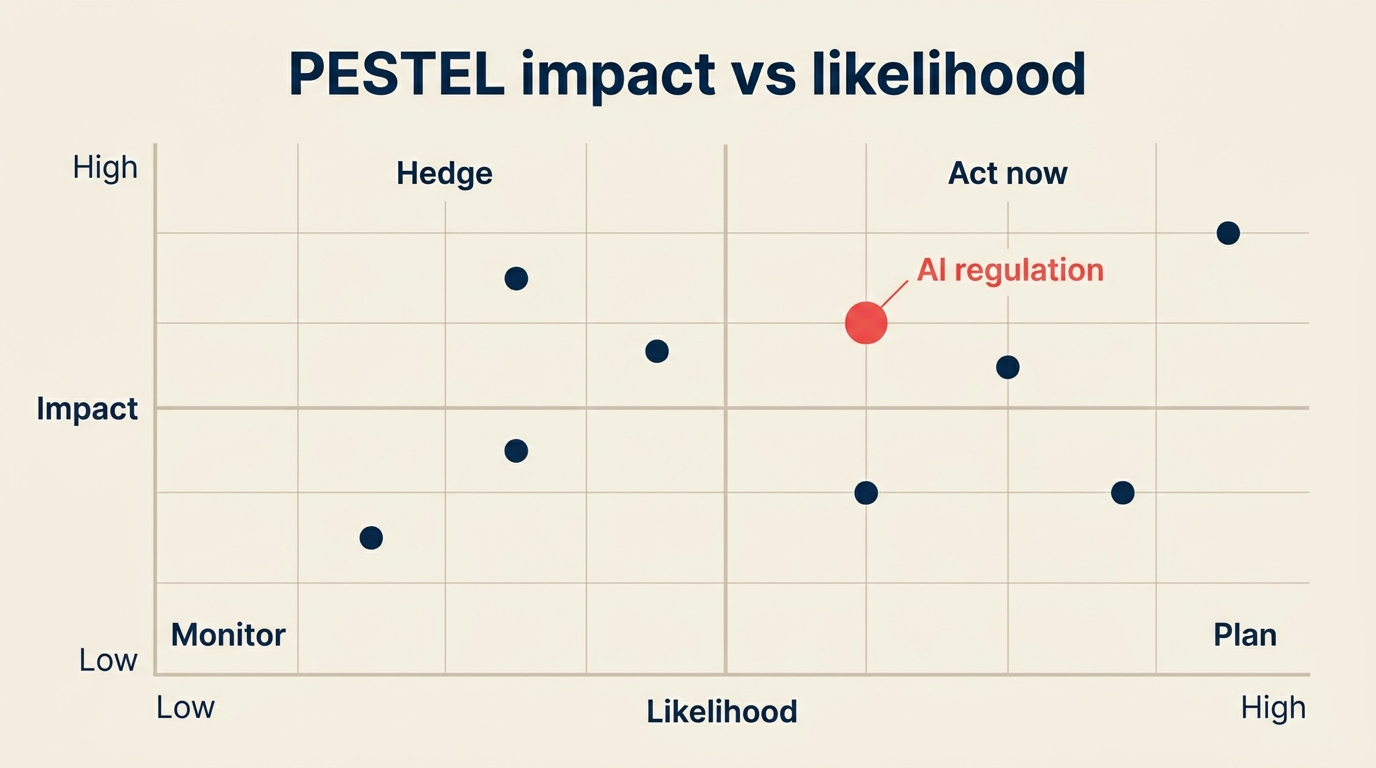
Step 3: Score impact and likelihood
Rate each factor on two dimensions: likelihood (how probable is this scenario in your timeframe?) and impact (how significantly would it affect the business?). A simple 1-5 scale works. Plot factors on a 2x2 impact-versus-likelihood grid to reveal where to focus.
Step 4: Identify opportunities and threats
For each high-scoring factor, ask whether it opens an opportunity or poses a threat. Be precise: "rising interest rates" is a threat for capital-intensive expansion but an opportunity for a cash-rich acquirer. Document the directional impact, not just the factor.
Step 5: Feed into strategy and risk register
PESTEL outputs are inputs, not decisions. Route high-impact threats into the risk register with owners and mitigation plans. Route opportunities into the strategic planning cycle, strategy reviews, or backlog. A RACI matrix helps clarify who owns each factor's monitoring and response.
Step 6: Refresh quarterly
Markets shift. Assign a team or individual to review the PESTEL register each quarter, retiring factors that have resolved and adding emerging ones. Many companies anchor the refresh to earnings cycles or board strategy updates.
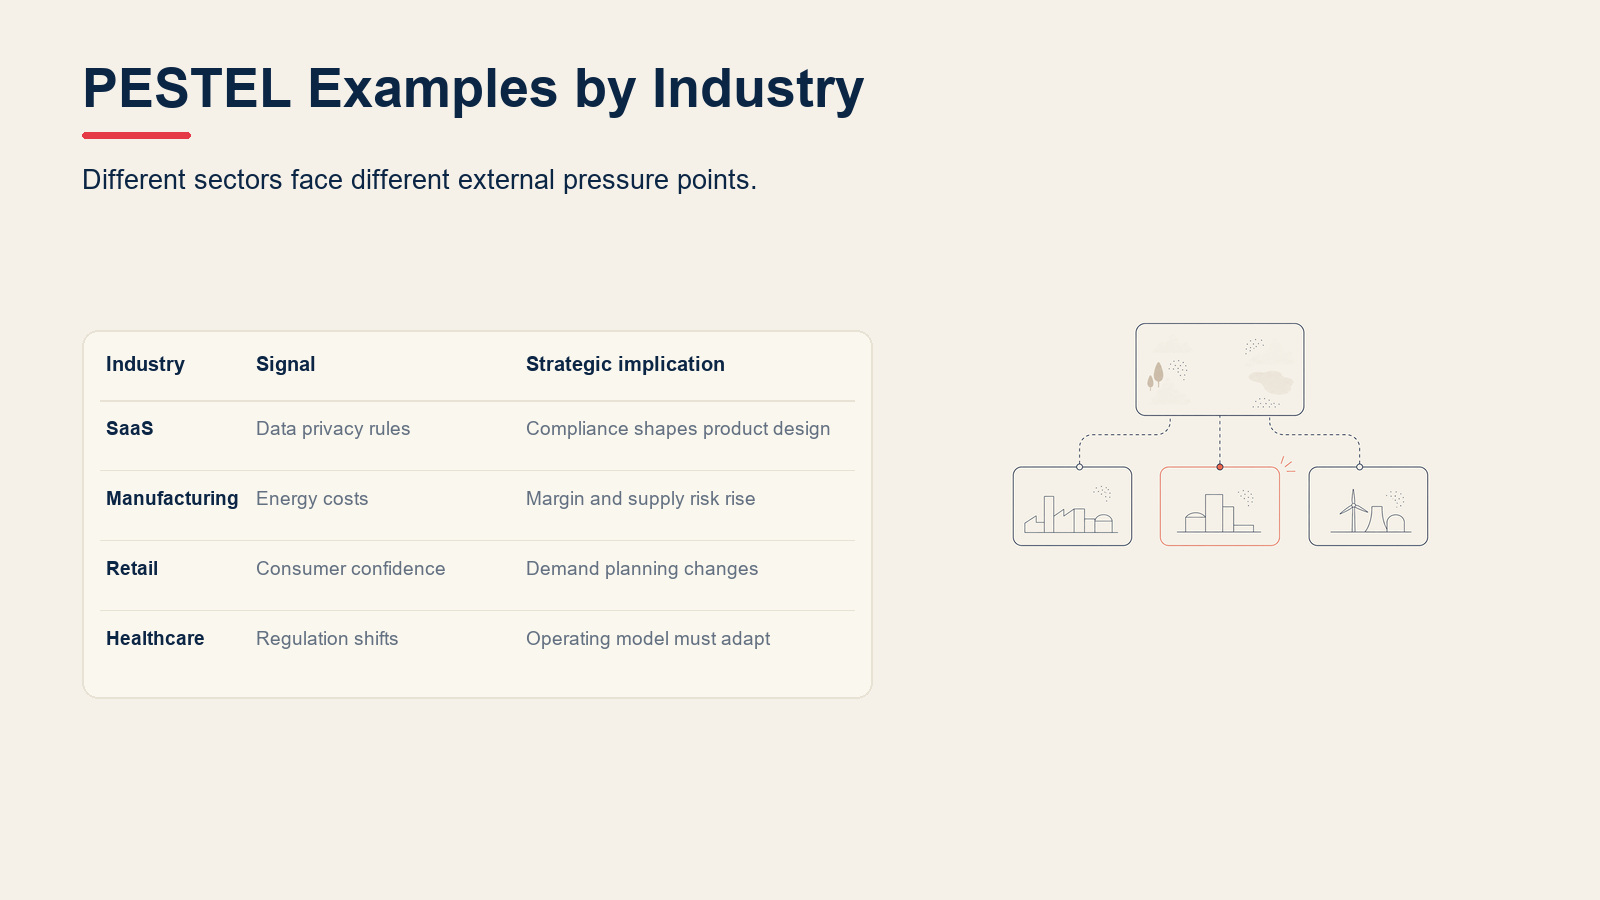
PESTEL examples by industry
This view separates the main parts of pestel examples by industry so the details below are easier to compare.
SaaS
| Factor | Signal | Likely impact | Strategic move |
|---|---|---|---|
| Political | EU AI Act high-risk classifications | Compliance overhead for AI-powered features | Audit product roadmap; budget for legal review |
| Economic | Rising cost of cloud infrastructure | Margin compression | Renegotiate vendor contracts; optimize compute spend |
| Social | Hybrid-work normalization | Sustained demand for collaboration tools | Double down on async workflows in product |
| Technological | Generative AI commoditizing basic features | Faster feature parity by competitors | Shift investment to proprietary data and workflows |
| Environmental | Data center carbon disclosure rules | Reporting costs; customer ESG audits | Switch to verified low-carbon cloud regions |
| Legal | GDPR and CCPA enforcement uptick | Fines risk; data residency pressure | Implement data localization options for EU and CA customers |
Automotive
| Factor | Signal | Likely impact | Strategic move |
|---|---|---|---|
| Political | Government EV subsidies expiring in key markets | Demand dip for consumer EVs | Diversify revenue toward fleet and commercial segments |
| Economic | Commodity price volatility (lithium, cobalt) | Battery cost uncertainty | Lock in long-term supplier contracts |
| Social | Urban consumers preferring car-sharing over ownership | Long-term volume decline in major cities | Invest in mobility-as-a-service platforms |
| Technological | Autonomous driving regulations maturing | Pathway to premium autonomous features | Accelerate software certification programs |
| Environmental | Stricter fleet emissions targets (EU 2035) | Accelerated ICE phase-out pressure | Front-load EV platform investment |
| Legal | Right-to-repair legislation | Warranty and parts revenue impact | Develop authorized repair partner networks |
Healthcare
| Factor | Signal | Likely impact | Strategic move |
|---|---|---|---|
| Political | Drug pricing reform legislation | Margin pressure on branded pharmaceuticals | Expand generics and biosimilar portfolio |
| Economic | Insurance reimbursement rate cuts | Revenue per procedure declining | Shift toward value-based care contracts |
| Social | Aging population driving chronic disease volume | Rising demand for long-term care services | Build chronic disease management programs |
| Technological | AI diagnostic tools clearing regulatory pathways | Efficiency gains; new competitor types | Partner with AI vendors; pilot in high-volume departments |
| Environmental | Climate-related disease burden increasing | New patient categories; supply chain stress | Map supply chain exposure to climate risk zones |
| Legal | HIPAA enforcement intensifying for digital health | Data breach liability rising | Invest in zero-trust security architecture |
Free PESTEL template (copy-paste)
Copy this table into a Google Doc, Notion page, or slide deck to run your own PESTEL scan.
| Factor | Description | Trend (+ / - / ~) | Likelihood (1-5) | Impact (1-5) | Opportunity or Threat? | Owner |
|---|---|---|---|---|---|---|
| Political | ||||||
| Political | ||||||
| Political | ||||||
| Economic | ||||||
| Economic | ||||||
| Economic | ||||||
| Social | ||||||
| Social | ||||||
| Social | ||||||
| Technological | ||||||
| Technological | ||||||
| Technological | ||||||
| Environmental | ||||||
| Environmental | ||||||
| Environmental | ||||||
| Legal | ||||||
| Legal | ||||||
| Legal |
How to use it: Fill in one row per external factor. Rate Likelihood and Impact from 1 (low) to 5 (high). Multiply them for a composite score. Sort descending to find the factors demanding immediate strategic attention. Assign an Owner to each top-scoring factor so monitoring doesn't fall through the cracks.
Frequently asked questions
Q: What is the difference between PESTEL, PESTLE, and STEEPLE?
A: They scan the same macro-environment, just with different acronyms. PESTEL and PESTLE are identical in substance (the E and L swap positions in the spelling). STEEPLE adds two dimensions: Ethical and Educational factors. Most strategy teams use PESTEL or PESTLE for general-purpose scans. STEEPLE is more common in public-sector and higher-education contexts where ethics and education systems are first-order strategic considerations.
Q: Who should run a PESTEL analysis?
A: Strategy and planning teams typically own the process, but the best scans pull input from across the business. Finance understands economic signals; legal tracks regulatory shifts; product and engineering monitor technology trends; HR watches social and labor dynamics; operations flags environmental and supply-chain risks. A cross-functional workshop produces a richer scan than a desk exercise by one team alone.
Q: How often should a PESTEL analysis be refreshed?
A: Quarterly is the right cadence for most businesses. Some factors (financial market conditions, fast-moving regulation) warrant monthly tracking as live dashboards rather than static slide decks. Anchor the full refresh to your strategic planning cycle so findings feed directly into annual plans, board presentations, and budget assumptions.
Q: How do you score PESTEL factors to prioritize them?
A: Rate each factor on Likelihood (how probable in your chosen timeframe, 1-5) and Impact (how materially it would affect revenue, cost, or competitive position, 1-5). Multiply the two scores for a composite. Factors scoring 16 or higher typically land in the "Act now" quadrant and deserve explicit strategic responses. Factors scoring 4 or below can be parked in a monitoring log.
Q: What are the most common PESTEL pitfalls?
A: Three mistakes come up repeatedly. First, listing factors without scoring them, which leaves teams unable to prioritize. Second, treating PESTEL as a one-time exercise rather than a living register. Third, confusing internal weaknesses with external threats. PESTEL is strictly for factors outside the organization's control. Internal capability gaps belong in the Weaknesses column of your SWOT analysis or against your critical success factors, not in PESTEL.
The most effective strategy teams treat PESTEL as a routine, not an event. Run it before major decisions, refresh it quarterly, and wire the outputs directly into your planning process so external signals shape priorities rather than surprise you.

Senior Operations & Growth Strategist
On this page
- What is a PESTEL analysis?
- Key Facts
- The 6 PESTEL factors explained
- Political
- Economic
- Social
- Technological
- Environmental
- Legal
- PESTEL vs SWOT vs Porter's Five Forces
- Benefits of running a PESTEL analysis
- Limitations of PESTEL
- How to do a PESTEL analysis in 6 steps
- Step 1: Define scope and timeframe
- Step 2: Brainstorm factors across all 6 categories
- Step 3: Score impact and likelihood
- Step 4: Identify opportunities and threats
- Step 5: Feed into strategy and risk register
- Step 6: Refresh quarterly
- PESTEL examples by industry
- SaaS
- Automotive
- Healthcare
- Free PESTEL template (copy-paste)
- Frequently asked questions
- Q: What is the difference between PESTEL, PESTLE, and STEEPLE?
- Q: Who should run a PESTEL analysis?
- Q: How often should a PESTEL analysis be refreshed?
- Q: How do you score PESTEL factors to prioritize them?
- Q: What are the most common PESTEL pitfalls?