Best Zoho Analytics Alternatives in 2026: 14 Tools for Budget-Conscious SMB Teams
Turn this article into takeaways for your work.


Each assistant summarizes the article only for you and suggests best practices for your work.
Updated August 2026
If you're shopping Zoho Analytics alternatives because a row cap or a missing connector just stopped a report from refreshing, the three swaps that fit most 10-to-200-person companies are Looker Studio (free, if your data already lives in Google), Metabase (free if you self-host, $100 a month if you don't, or $90 a month billed annually), and Microsoft Power BI Pro at $14.00 per user per month paid yearly. Those three cover the overwhelming majority of teams that leave. Everything past them costs meaningfully more and should only win if it solves something those three genuinely can't.
Being fair to the incumbent first: for a company already running Zoho CRM, Books and Desk, Zoho Analytics is the cheapest credible way to report across all three without building a pipeline, and its always-free plan is a real product rather than a trial. This guide is about the ceilings that make people switch anyway. The 14 tools below are ordered by relevance to a budget-conscious leaver, so free options come first and enterprise platforms come last. Every price was checked against the vendor's own pricing page in August 2026, and where a vendor publishes nothing, this guide says so instead of dressing up somebody else's guess. If you haven't narrowed the category yet, start with the best business intelligence tools roundup.
Key Facts
- Only 20% of the non-IT business professionals who could be using self-service BI hands-on actually do, a share that has barely moved in a decade, according to Forrester VP and Principal Analyst Boris Evelson (Forrester, "Bring Data To The Other 80% Of Business Intelligence Users").
- Analytics adoption is size-gated: 32% of US firms with 100 to 249 employees reported using AI in their operations as of May 3, 2026, versus under 20% of firms with four or fewer employees (US Census Bureau, Business Trends and Outlook Survey).
- 91% of small and medium businesses using AI say it boosts their revenue, from a survey of 3,350 leaders at companies of 200 employees and under (Salesforce, Small and Medium Business Trends Report, 6th Edition).
- Only 49% of business leaders say they can reliably generate timely insights from their own data, though 63% describe their company as data-driven, per Salesforce's 2026 State of Data and Analytics survey of more than 10,000 leaders (reported by Forbes).
- Microsoft was named a Leader in the 2026 Gartner Magic Quadrant for Analytics and BI Platforms for the 19th consecutive year, and now counts more than 35 million monthly active Power BI users (Microsoft Fabric Community blog, 2026).
Quick Comparison Table
| Tool | Best For | Starting Price | Key Strength | Key Limitation |
|---|---|---|---|---|
| Looker Studio | Free reporting on Google data | Free | Native to Google Ads and Analytics | Pro is per user per Google Cloud project |
| Metabase | Escaping row caps | Open source free; Cloud Starter $100/month, $90 billed annually | Free edition has unlimited users, no row cap | Cloud cost climbs past the first 5 users |
| Microsoft Power BI | Cheapest credible paid seat | Pro $14.00/user/month paid yearly | Deep Microsoft 365 and Excel tie-in | Fabric capacity is separate and hard to budget |
| Preset (Apache Superset) | Free to 5 users, then flat per seat | Starter $0 forever; Professional $20/user/month annually | Unlimited users on Professional | Smaller partner and template ecosystem |
| Databox | Cross-tool KPI dashboards | Free (1 user, 3 sources); Pro $159/month annually | Unlimited users, 100+ connectors | Metric dashboards, not a modeling tool |
| Amazon QuickSight | Cheap viewers on an AWS stack | Author $24, Reader $3/user/month | $3 Reader seats for wide distribution | $250/month fee once Pro features are on |
| Grafana | Operational, real-time dashboards | Free tier; Pro from $19/month plus usage | Best-in-class for time-series data | Free tier keeps only 14 days of retention |
| Hex | A team with one strong SQL analyst | Community free; Professional $36/editor/month | Notebook to polished app in one step | Priced per editor, not for mass viewing |
| Sigma Computing | Spreadsheet users on a warehouse | No published price | Spreadsheet UI that writes back | No pricing transparency, warehouse required |
| Holistics | A governed metrics layer, flat fee | Entry $960/month, or $800/month billed annually, first 10 users | As-code modeling, no per-seat scaling | A real jump from Zoho money |
| Tableau | Best-in-class visual output | Creator $75, Explorer $42, Viewer $15/user/month annually | The strongest visual interface here | Role licensing forces sizing math up front |
| ThoughtSpot | Asking questions, not filing requests | Essentials from $25/user/month annually | Natural-language search, Spotter AI | Essentials caps at 50 users, 25M rows |
| Qlik Cloud Analytics | Adding viewers without per-seat cost | Starter $300/month annually (10 users, 10 GB) | Extra users are free above Starter | Capacity-priced, so growth forces upgrades |
| Domo | Company-wide distribution, free seats | No published price, consumption credits | Seats cost nothing, strong mobile | Credit consumption is hard to forecast |
Why Teams Outgrow Zoho Analytics
Zoho Analytics earns its place honestly. For a company already paying for Zoho One, it's the only tool here that reads CRM, accounting and helpdesk data out of the box without anybody writing a connector, and the free plan gives two users 10,000 rows across five workspaces with unlimited reports and dashboards. That's a real product for a five-person company, not a countdown timer.
The ceilings arrive in a predictable order. Rows first: tiers step up by allocation, and one Books export can eat a tier's row budget alone, turning "we need one more report" into a plan upgrade. Connectors second: Zoho covers its own suite beautifully and the rest of the world unevenly, so the first non-Zoho system a company adopts is where gaps appear. Performance third: live-query mode against a large external dataset is noticeably slower than a purpose-built columnar engine, and dashboards that were snappy at 200,000 rows aren't at 5 million. Visual output fourth, and it's the one people say out loud, because the default charts look a few software generations old the first time one lands in a board deck.
| What starts the search | What actually happens | What buyers look for instead |
|---|---|---|
| Row allocation runs out | One large table pushes the workspace over its tier's row budget, so adding a report means changing plans | A tool priced by users or a flat fee, with no row cap |
| A connector doesn't exist | The first non-Zoho system has no native connector, so data arrives by manual CSV or not at all | A broad third-party connector library or a direct warehouse connection |
| Live queries get slow | Dashboards that were instant at a few hundred thousand rows crawl at millions | A columnar or in-memory engine built for scan-heavy queries |
| Charts look dated | The default visual style shows its age the moment a dashboard leaves the team | Modern default styling that needs no cleanup before a board sees it |
| The stack moves to a warehouse | Once data lands in BigQuery or Snowflake, Zoho becomes one more copy rather than the source of truth | A warehouse-native tool that queries in place instead of importing |
| The ladder outruns the value | Paid plans run from $25 a month to $495 a month, and the jumps are driven by row caps as much as by seats | A tool priced on people or usage rather than on row count |
What Zoho Analytics Actually Costs
Worth being precise here, because this is where most comparison content goes wrong. Zoho publishes an always-free plan (2 users, 10,000 rows, 5 workspaces) and paid cloud plans from $25 per month for 2 users and 500,000 rows up to $495 per month for 50 users and 50 million rows, with 20% off for yearly billing. Extra users are $8 per user per month, or $6.40 billed annually, and viewer licences are $4 per viewer per month with a 25-viewer minimum. Four paid tiers sit between those two endpoints, stepping up by allocation: 2 users and 0.5 million rows, then 5 users and 1 million, then 15 users and 5 million, then 50 users and 50 million.
One practical warning if you go looking yourself. Zoho's marketing pricing page renders its figures through a client-side script, so scrapers, cached copies and comparison articles routinely come back with different tier names and different numbers from the same URL. Zoho's own help centre prints the figures plainly, which is where the ones above come from.
That last line matters more than it looks. A 25-viewer minimum at $4 each is $100 a month in viewer licences before you've added a single extra author, which is the price of a Metabase Cloud Starter plan outright.
| What Zoho publishes | Detail |
|---|---|
| Always-free plan | 2 users, 10,000 rows, 5 workspaces, unlimited reports and dashboards |
| Paid tier ladder (by allocation) | 2 users / 0.5M rows, then 5 users / 1M rows, then 15 users / 5M rows, then 50 users / 50M rows |
| Extra users add-on, annual basis | $6.40 per user per month billed yearly |
| Yearly billing discount | 20% off |
| Extra users add-on | From $8 per user per month |
| Viewers add-on | $4 per viewer per month, 25 viewers minimum |
| Other published add-ons | Scheduled emails and alert schedulers from $15/month per 10; portal setup from $25/month |
| Paid plan range | From $25 per month (2 users, 500,000 rows) to $495 per month (50 users, 50 million rows); local taxes are charged on top |
What This Actually Costs at 5, 15 and 50 Users
Here's the table most roundups skip. Every figure is the vendor's own published rate, annualized, at three headcounts a growing SMB passes through. For tools priced by role (Tableau and QuickSight), the mix assumed is 1 builder plus 4 viewers at 5 people, 2 plus 13 at 15, and 5 plus 45 at 50. Figures are list price and exclude negotiated discounts, taxes, hosting and data-usage charges.
| Tool (tier and billing basis) | 5 users/yr | 15 users/yr | 50 users/yr |
|---|---|---|---|
| Looker Studio (free tier) | $0 | $0 | $0 |
| Metabase Open Source (self-hosted, unlimited users) | $0 licence | $0 licence | $0 licence |
| Amazon QuickSight (Author $24 + Reader $3, per user/month) | $432 | $1,044 | $3,060 |
| Grafana Cloud Pro ($19/month platform fee + $8.00 per active user/month) | $708 | $1,668 | $5,028 |
| Microsoft Power BI Pro ($14.00/user/month paid yearly) | $840 | $2,520 | $8,400 |
| Metabase Cloud Starter ($1,080/year for 5 users, then $65/user/year) | $1,080 | $1,730 | $4,005 |
| ThoughtSpot Essentials (from $25/user/month billed annually) | $1,500 | $4,500 | $15,000 |
| Databox Pro ($159/month billed annually, unlimited users) | $1,908 | $1,908 | $1,908 |
| Tableau Standard (Creator $75 / Viewer $15 per user/month annually) | $1,620 | $4,140 | $12,600 |
| Hex Professional ($36/editor/month, editors only) | $2,160 | $6,480 | $21,600 |
| Preset (Starter free to 5; Professional $20/user/month annually) | $0 | $3,600 | $12,000 |
| Qlik Cloud Analytics (Starter $300/month annually; Standard $825/month) | $3,600 | $9,900 | $9,900 |
| Holistics Entry ($800/month billed annually, 10 users, then $12.50/user/month) | $9,600 | $10,350 | $15,600 |
| Sigma Computing (quote only) | Quote only | Quote only | Quote only |
| Domo (consumption credits, seats free) | Quote only | Quote only | Quote only |
| Zoho Analytics (incumbent; $25/month entry for 2 users, $495/month top tier for 50) | $300/yr at the 2-user entry tier | Mid-tier rate sits between the two published endpoints | $5,940 |
Three things fall out. Genuinely free is available at every headcount, because Looker Studio and self-hosted Metabase cost nothing at 50 users any more than at 5. Flat-fee tools get cheaper per person as you grow while per-seat tools do the opposite, and the crossover comes earlier than teams expect: Databox Pro is the cheapest paid option in the table at 50 users. And Qlik Starter gets cheaper per user as you fill its 10-user allowance, then jumps when you exceed it.
1. Looker Studio - Free, and Already Connected to Half Your Data
Most Zoho Analytics leavers should look here first, for the unglamorous reason that it costs nothing and probably already reaches your marketing data. Google's approach is distribution over depth: a competent report builder, connected natively to Google Ads, Analytics, Search Console, Sheets and BigQuery, that a marketing manager can turn into a client-ready dashboard without a purchase order.
The limits are governance and scale. There's no semantic modeling layer, so metric definitions live inside each report and two dashboards can quietly disagree about what "conversion" means. Looker Studio Pro adds team workspaces, but it's billed per user per Google Cloud project, and the per-project basis is what bites agencies: 20 client projects means 20 subscriptions.
Target audience and sizing. Marketing-led teams of roughly 5 to 100 people whose reporting sits on Google Ads, GA4 and Sheets.
Stage fit. Best before a warehouse exists and before metric definitions need central governance.
| Pros | Cons |
|---|---|
| Free, with no user cap and no row cap | No semantic layer, so definitions drift between reports |
| Native connectors to Google Ads, GA4, Search Console and BigQuery | Non-Google connectors vary in quality and speed |
| Sharing works like a Google Doc, so nobody needs training | Pro is per user per Google Cloud project and unpublished |
Pricing: Looker Studio is free. Looker Studio Pro is billed per user per Google Cloud project, at $9 per user per project per month on Google's own product page.
Best for: Marketing and revenue teams whose data already lives in Google. For the head-to-head against the other cheap option, see Power BI vs Looker Studio.
2. Metabase - The Open Source Escape Hatch From Row Limits
Metabase is the most direct answer to "we hit a row cap." Its open source edition is free, self-hosted, with unlimited users, unlimited questions and dashboards, more than 20 data sources, and no row ceiling at all. If an allocation rather than a feature pushed you off Zoho Analytics, that removes the entire category of problem for the cost of a small server.
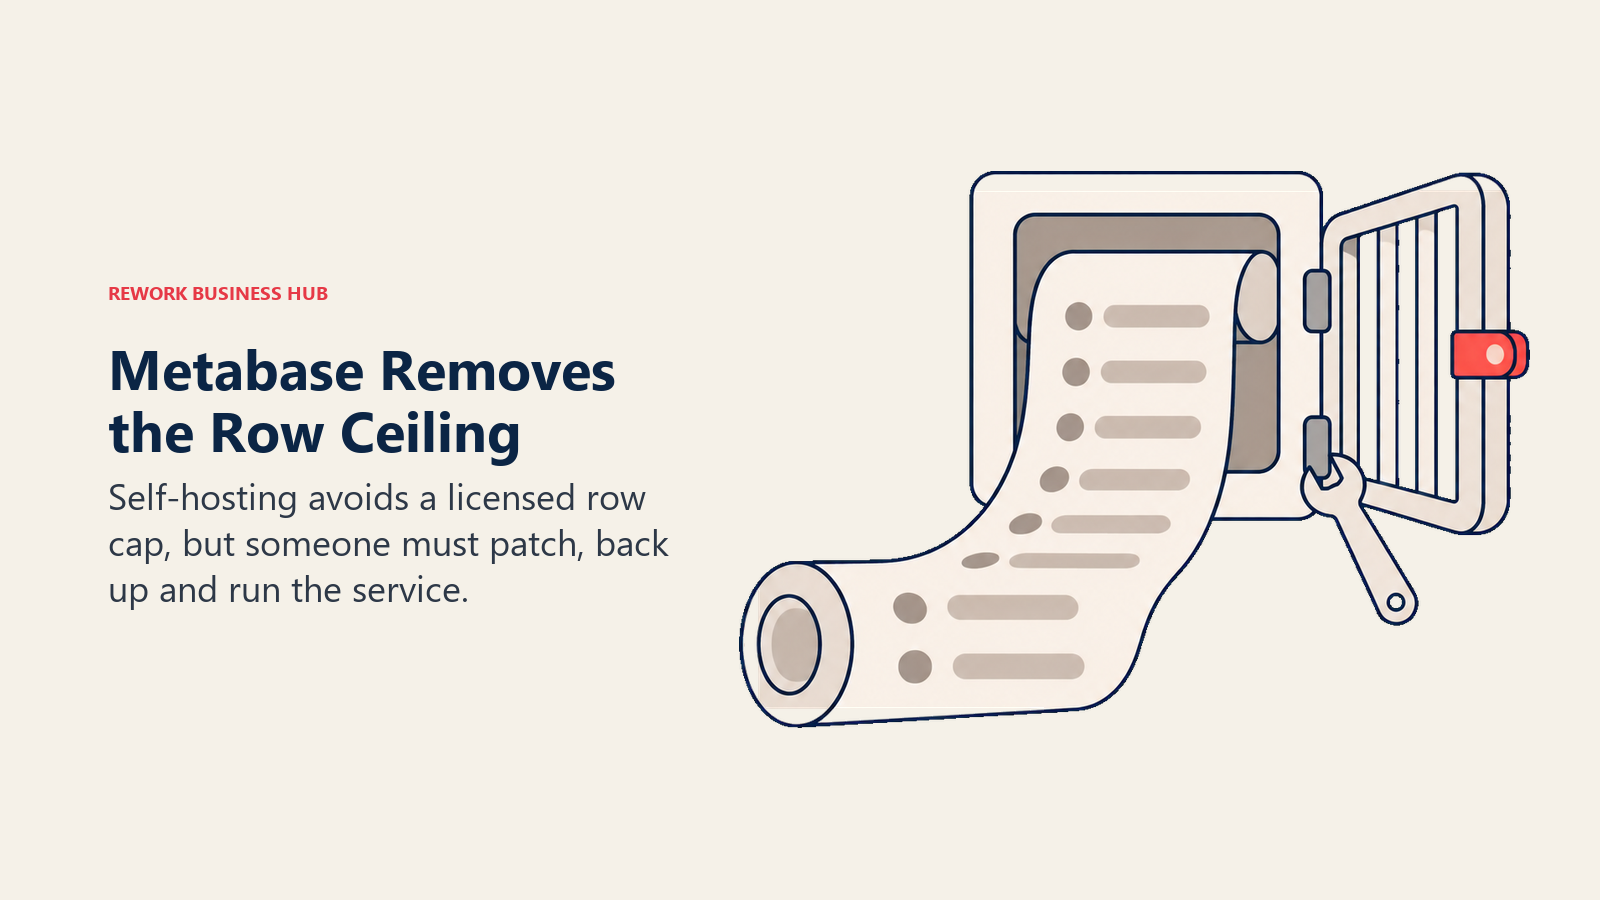
The philosophy is that most business questions shouldn't require SQL, so an ops lead can filter and summarize by clicking while an analyst drops into raw SQL and saves a reusable model. The cost of the free edition is boring but real: somebody patches and backs it up. One detail to watch on Cloud is that embedded viewers count as users.
Target audience and sizing. Teams of 5 to 200 with someone comfortable running a container, or willing to pay $100 a month to skip that.
Stage fit. Best once data sits in a real database rather than only inside SaaS apps.
| Pros | Cons |
|---|---|
| Open source edition is free, unlimited users, no row cap | Self-hosting means you own patching, uptime and backups |
| Clicking query builder that non-technical staff genuinely use | Cloud adds per-user cost past the first 5 seats |
| Connects to 20+ sources including the major cloud warehouses | Advanced permissions and SSO are Pro-tier features |
Pricing: Open Source free, self-hosted, unlimited users. Cloud Starter $100 per month or $1,080 per year (first 5 users), extra users $6 per user per month or $65 per year. Pro $575 per month or $6,210 per year (first 10 users). Enterprise custom, from $20,000 per year.
Best for: Budget-conscious teams that want to stop paying for rows and are fine running one more service. If Metabase is what you're weighing against, see the Best Metabase Alternatives guide.
3. Microsoft Power BI - The Cheapest Credible Paid Seat in BI
Power BI Pro at $14.00 per user per month paid yearly is the lowest published price in this category for a tool that does everything a growing company needs: model data, build governed reports, schedule refreshes, distribute to hundreds of people. It was named a Leader in the 2026 Gartner Magic Quadrant for Analytics and BI Platforms for the 19th consecutive year, and Microsoft reports more than 35 million monthly active users.
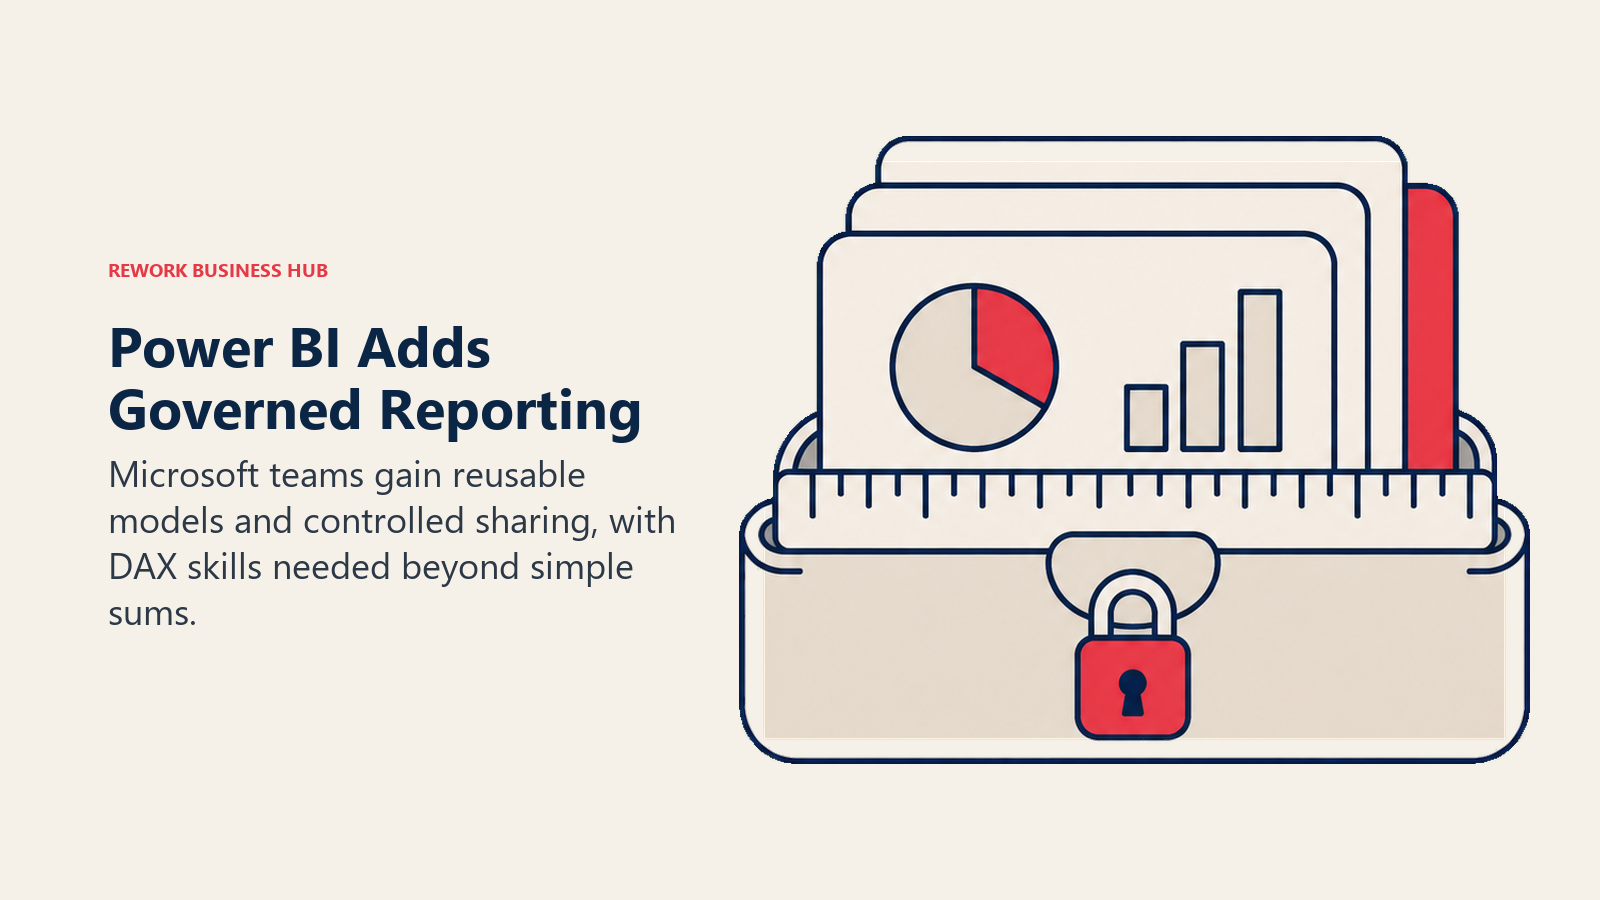
The trade-offs are honest. Default visuals are competent rather than beautiful, so a chart headed for an investor deck needs formatting work, DAX has a real learning curve past simple sums, and scale eventually routes through Fabric capacity pricing, which is consumption-based rather than a flat published number.
Target audience and sizing. Any company already licensing Microsoft 365, from a 10-person team to a few hundred users.
Stage fit. Best when the company has standardized on Microsoft and needs governed reporting, not an ad-hoc dashboard tool.
| Pros | Cons |
|---|---|
| $14.00/user/month paid yearly, the lowest published seat price in real BI | Default visuals need work before they look board-ready |
| Deepest Excel, Microsoft 365 and Azure integration in the category | DAX has a genuine learning curve past basic measures |
| 35M+ monthly active users, so hiring and finding help is easy | Fabric capacity pricing at scale is hard to budget |
Pricing: Free account for personal use with no sharing; Pro $14.00 per user per month paid yearly; Premium Per User $24.00 per user per month paid yearly; Power BI Embedded and Fabric capacity priced separately and quoted.
Best for: Microsoft-standardized SMBs that want the lowest per-seat bill without giving up governance. If Power BI is what you're replacing, see the Best Power BI Alternatives guide.
4. Preset (Managed Apache Superset) - Free to Five Users, Then Twenty Dollars a Seat
Preset is the commercially managed version of Apache Superset, the open source BI platform out of Airbnb. Its vision is that the visualization layer should be commoditized and the vendor's job is to run it well rather than charge rent on charts. That produces the most SMB-friendly pricing shape here: $0 forever for up to 5 users, then a flat per-seat rate with no user ceiling.
The appeal for a Zoho leaver is that the free tier isn't a trial, and the upgrade path is a plain number rather than a capacity negotiation. What you give up is ecosystem: Superset's chart library is broad but its templates, tutorials and consulting partners are thinner than Power BI's. It also expects a real database behind it, not stitched-together SaaS exports.
Target audience and sizing. Technical-leaning teams of 5 to 200 on a real database that like open source but don't want to operate it.
Stage fit. Best once SQL is a normal skill somewhere in the company.
| Pros | Cons |
|---|---|
| Starter is $0 forever for up to 5 users, not a timed trial | Smaller template, tutorial and partner ecosystem |
| Professional is a flat $20/user/month annually, unlimited users | Expects a real database, not SaaS app exports |
| Managed Superset means open source without the ops burden | Embedded viewer licences are a separate add-on |
Pricing: Starter $0 forever, up to 5 users. Professional $20 per user per month billed annually, or $25 billed monthly, unlimited users. Enterprise custom. Embedded Dashboard Viewer Licences from $500 per month for 50 licences.
Best for: Small technical teams that want a permanent free tier and a predictable per-seat price when they outgrow it.
5. Databox - Flat-Fee Dashboards for Marketing and Revenue Metrics
Databox solves a narrower problem than a general BI platform, and for a lot of SMBs the narrow problem is the actual problem. Its method is metric tracking rather than data modeling: connect the SaaS tools you already pay for, pick the metrics that matter, and get scorecards, goals and alerts pushed to Slack or email without anyone opening a dashboard.
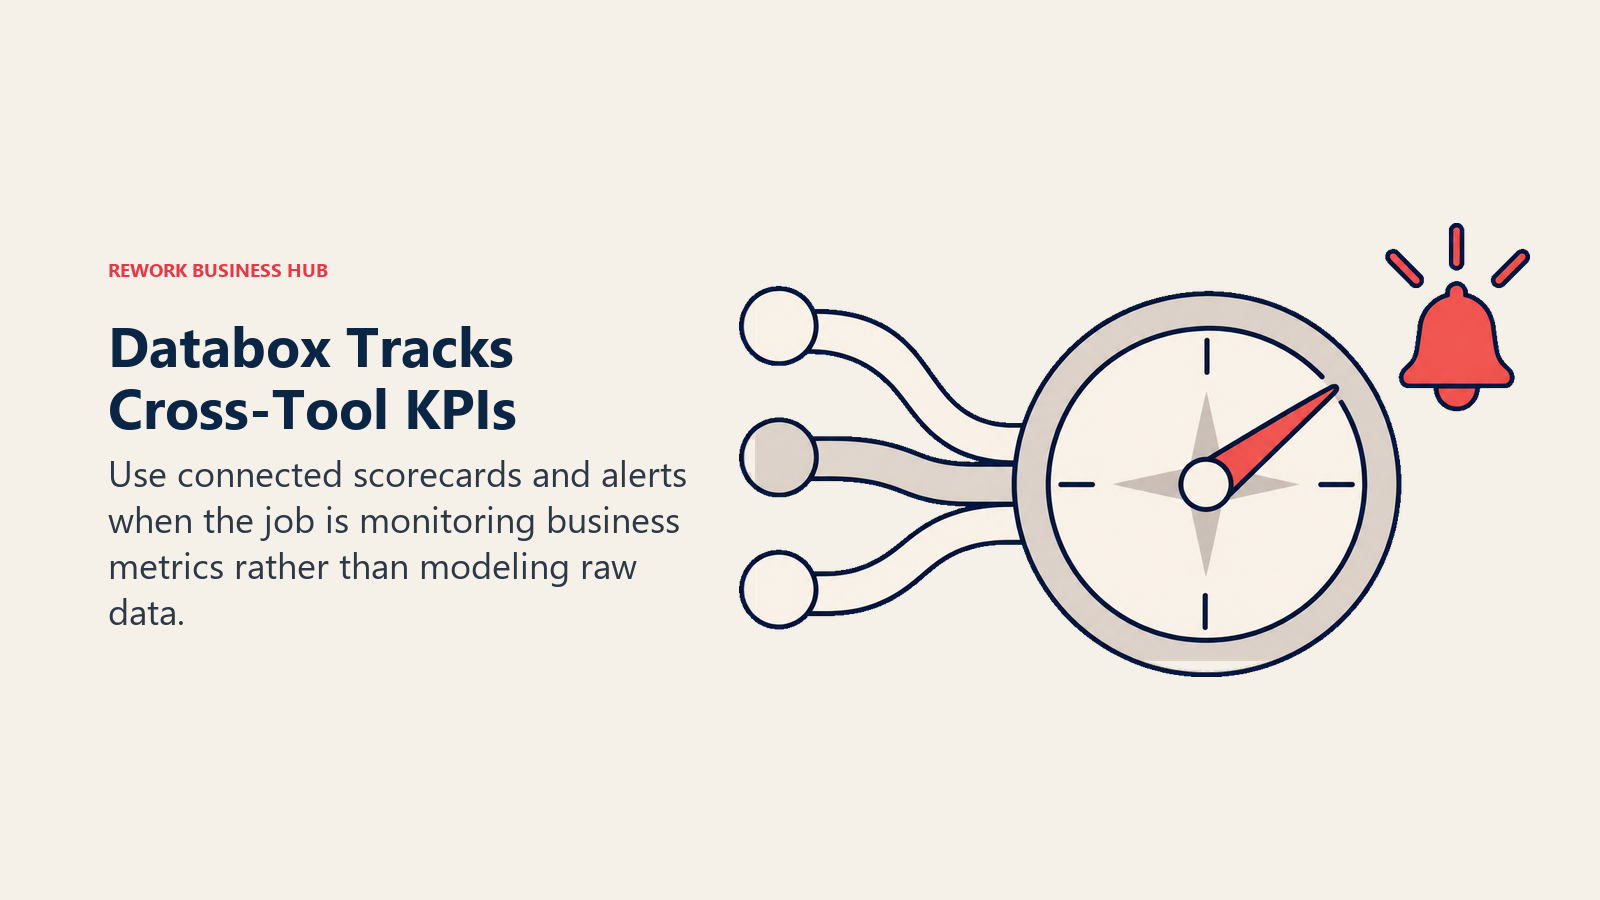
The pricing shape suits growing teams unusually well. Free is genuinely free but genuinely small, and paid plans carry unlimited users, which is why Databox is the cheapest paid line in the 50-user table above. The limit is scope: ask it to join three raw tables or model a semantic layer and it will disappoint you.
Target audience and sizing. Marketing, revenue and agency teams of 5 to 200 who need cross-tool KPI reporting rather than raw analysis.
Stage fit. Best before a warehouse exists, when data still lives inside individual SaaS products.
| Pros | Cons |
|---|---|
| Paid plans carry unlimited users at a flat monthly fee | Free plan is 1 user, 3 sources and 1 dashboard |
| 100+ prebuilt connectors to common SaaS tools, minimal setup | No joins across raw tables and no semantic layer |
| Goals, alerts and scorecards push metrics to people | Depth per source is limited to what the connector exposes |
Pricing: Free (1 user, 3 data sources, 1 dashboard, 10 custom metrics); Analyst $64 per month; Pro $159 per month billed annually with unlimited users; Growth $399 per month; Custom quoted. Annual billing carries a 20% discount versus monthly.
Best for: SMBs whose reporting need is cross-tool KPI tracking, not analysis, and who want the price to stop moving as headcount grows.
6. Amazon QuickSight - Cheap Viewers, If You Already Run on AWS
QuickSight's pricing model is built for exactly the situation Zoho's viewer add-on creates. Authors cost $24 per user per month and Readers cost $3, so putting a dashboard in front of 45 people who only look at it costs $135 a month rather than a seat licence each. The SPICE in-memory engine handles the scan-heavy queries that make live-query mode slow elsewhere.
The condition is AWS: QuickSight is native to Redshift, Athena, S3 and RDS, and awkward anywhere else. Budget too for the $250 per month per-account infrastructure fee, which applies once the account has one Pro user or dashboard Q and A enabled. That's $3,000 a year appearing the moment somebody turns on a feature.
Target audience and sizing. AWS-native companies of 20 to 500 with a small group of builders and a large group of readers.
Stage fit. Best once data is in Redshift, Athena or S3 and the reporting audience is wider than the analysis audience.
| Pros | Cons |
|---|---|
| $3 Reader seats make company-wide distribution genuinely cheap | $250/month per-account fee once Pro features are enabled |
| SPICE in-memory engine is fast on large scan-heavy queries | Only makes sense if your data already lives in AWS |
| Author seats at $24 undercut most builder-tier licences | Authoring is less polished than Tableau or Power BI |
Pricing: Author $24 per user per month; Author Pro $40; Reader $3 per user per month; Reader Pro $20. A $250 per month per-account infrastructure fee applies once the account has at least one Pro user or dashboard Q and A enabled.
Best for: AWS shops that need a dashboard in front of the whole company without paying per head for people who only read.
7. Grafana - Free Dashboards Built for Operational Data
Grafana is the odd one out, and it belongs here because a meaningful share of SMB "BI" needs are operations monitoring wearing a business hat: order volume by hour, warehouse throughput, support queue depth. Grafana is time-series first, and for that shape of question it beats every general BI tool here and is free at small scale.
Check the free tier's shape before committing. Grafana Cloud Free keeps 14 days of retention and includes only 3 active visualization users per month, fine for operational alerting and useless for year-over-year reporting. The broader limitation for a Zoho leaver: no semantic layer, and connecting it to a CRM is a project rather than a connector.
Target audience and sizing. Ops, engineering and logistics teams whose key metrics are time-stamped events rather than CRM records.
Stage fit. Best alongside a business BI tool, not instead of one.
| Pros | Cons |
|---|---|
| Free tier is permanent, and self-hosting is free under open source | Free tier retains only 14 days of metrics, logs and traces |
| Unmatched for real-time and time-series operational dashboards | No semantic layer or business-friendly modeling for finance |
| Enormous plugin and data-source ecosystem | Free tier includes only 3 active visualization users per month |
Pricing: Grafana Cloud Free, $0 always, 14-day retention, 3 active visualization users per month. Pro from $19 per month platform fee plus usage, visualization at $8.00 per active user per month. Enterprise from a $25,000 per year commitment. Self-hosted Grafana is free and open source.
Best for: Companies whose most valuable dashboards are operational and real-time, where a 14-day window is a feature rather than a problem.
8. Hex - Notebooks for the One Person Who Actually Writes SQL
Plenty of SMBs have exactly one person who can write a real query, and their problem isn't dashboards, it's that the analysis lives in a notebook nobody else can open. Hex combines SQL and Python cells with a drag-and-drop app builder, so the file that runs the analysis publishes as a clean interactive app for everyone else.
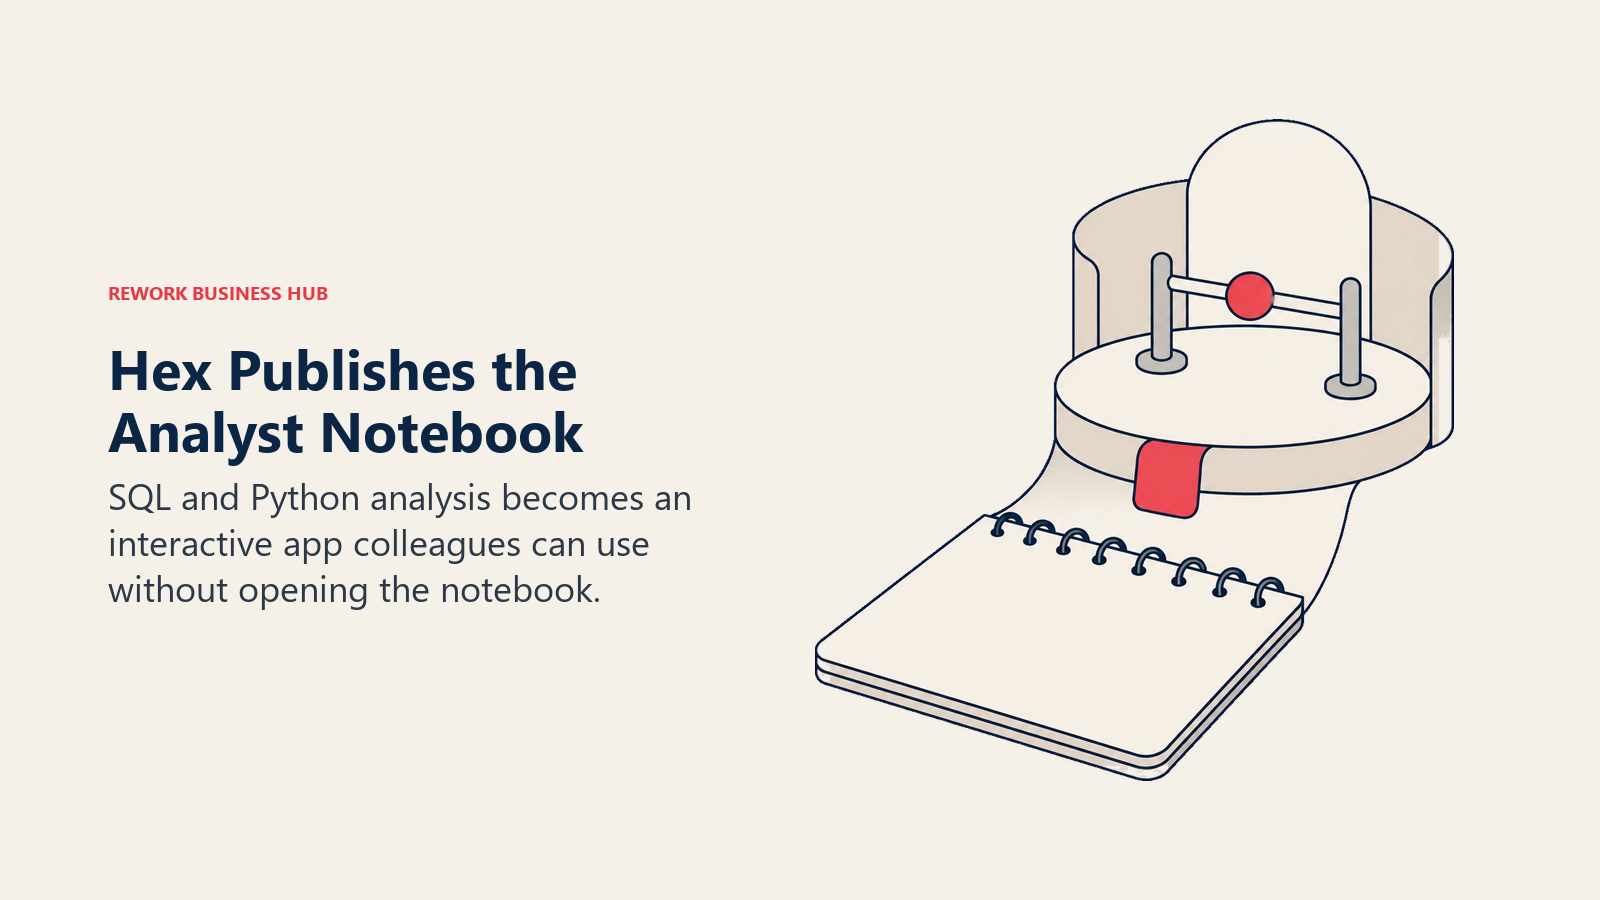
The pricing follows the philosophy: you pay for people who build, not people who look. For a company with two analysts and 40 readers, that's a very different bill than a per-seat tool. The limitation is scope. Hex assumes technical users, there's no click-only builder an ops lead will pick up unaided, and it's the analyst's workbench rather than the company's reporting platform.
Target audience and sizing. Data-literate teams of 10 to 200 with one to five people who write SQL or Python daily.
Stage fit. Best once analysis has outgrown a dashboard builder but the company is too small for a data team.
| Pros | Cons |
|---|---|
| SQL and Python notebooks publish as shareable interactive apps | Assumes technical users, no click-only builder |
| Priced per editor, so readers cost nothing | Wrong shape for company-wide self-service |
| Community tier is free for individuals to trial the workflow | Not a governed enterprise reporting layer |
Pricing: Community free; Professional $36 per editor per month; Team $75 per editor per month with a 14-day free trial; Enterprise custom.
Best for: Companies whose analytics bottleneck is one analyst's notebook, not the dashboard tool.
9. Sigma Computing - Spreadsheet-Native BI on Top of a Warehouse
Sigma's bet is that most business people think fastest in a spreadsheet, so the BI interface should just be one. It puts a real spreadsheet UI on top of a cloud warehouse (Snowflake, BigQuery, Databricks) and, unusually, writes values back into warehouse tables rather than only reading from them. That write-back makes planning and what-if workflows possible, and it's the feature people actually switch for.
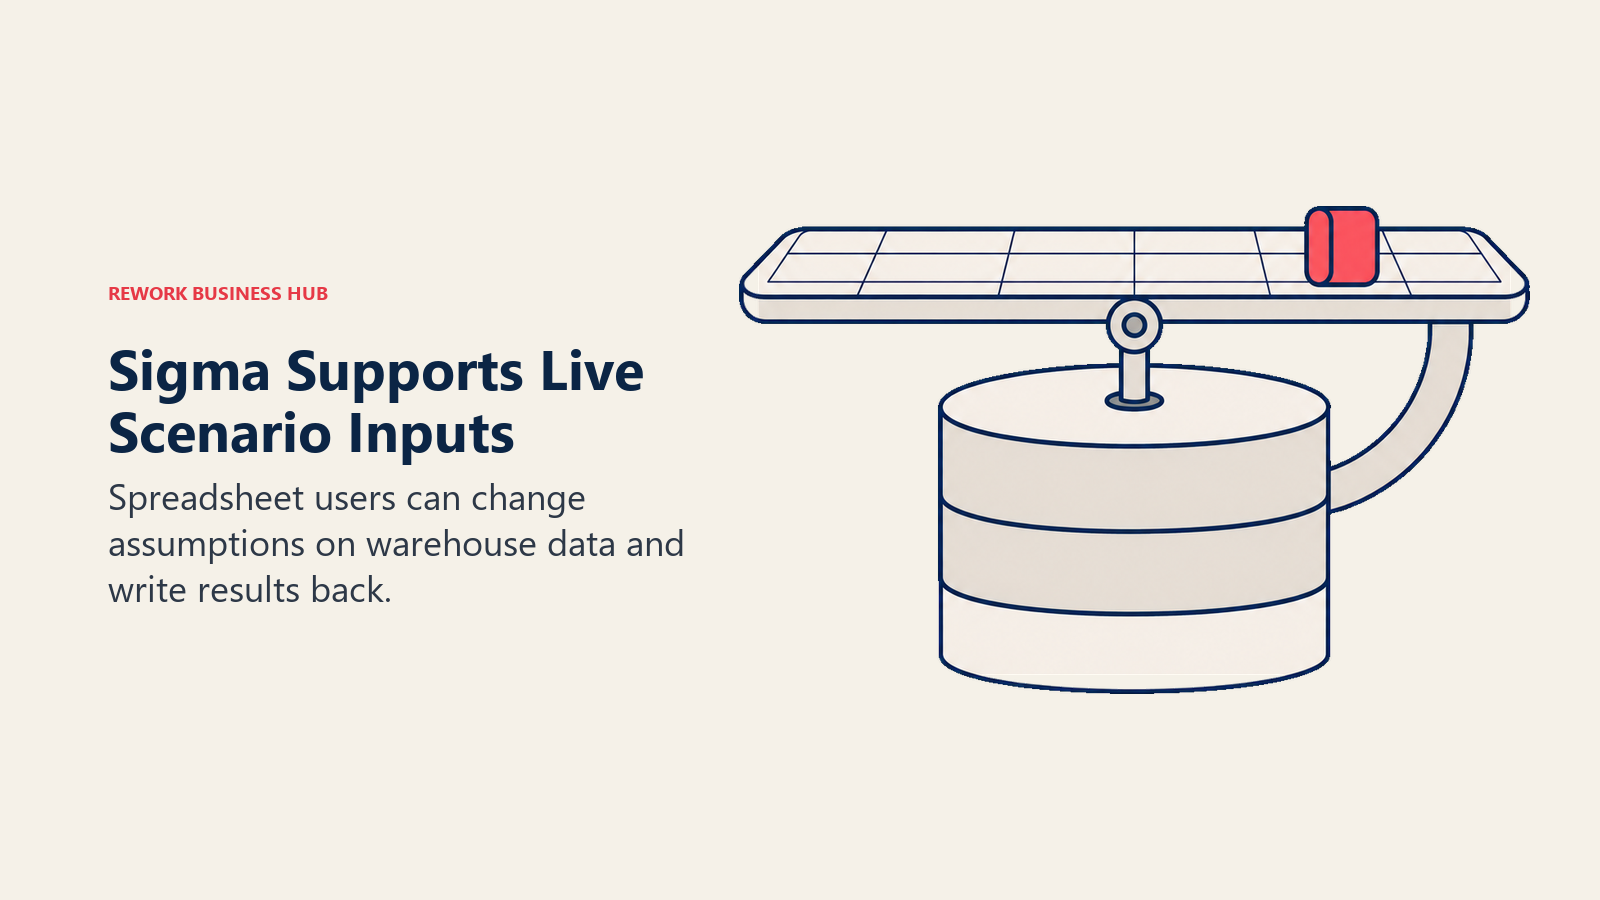
For a Zoho leaver it's a step up in both capability and stack maturity. It assumes a cloud warehouse, which most 10-to-200-person companies don't have yet, and it publishes no pricing at any tier. Mid-migration to Snowflake with a finance team living in Excel? Worth the sales call. Data still in Zoho CRM and a Google Sheet? Not yet.
Target audience and sizing. Warehouse-centric teams from about 50 people up, especially finance and ops groups that plan in spreadsheets.
Stage fit. Best after a cloud warehouse is in production, not before.
| Pros | Cons |
|---|---|
| Spreadsheet interface that finance and ops users already know | No published pricing at any tier |
| Writes back to the warehouse, enabling planning and what-if models | Requires a cloud warehouse, ruling out earlier-stage teams |
| Handles billion-row datasets by pushing compute to the warehouse | Warehouse compute costs sit on top of the licence |
Pricing: No published price. Free trial and demo request only; production deployments are quoted.
Best for: Finance and operations teams on a cloud warehouse who want to edit live data, not just look at charts.
10. Holistics - A Governed Semantic Layer at a Flat Monthly Fee
Holistics is for a company that has hit the "our two dashboards disagree" problem but doesn't want to pay enterprise money to fix it. It models metrics as code in a version-controlled semantic layer, so revenue is defined once and every report inherits that definition, then prices that governance as a flat monthly fee rather than a per-seat licence.
That's a real jump from Zoho Analytics money, and it belongs on your list only if metric inconsistency is costing something measurable. Where it earns the price is predictability: at 50 people, Entry lands around $15,600 a year all in, well under an equivalent Tableau deployment, and the number doesn't move when marketing hires. The trade is brand recognition in a procurement conversation.
Target audience and sizing. Data-conscious companies of 20 to 200 that need governed definitions and predictable cost.
Stage fit. Best once multiple teams build their own reports and the numbers have started to disagree.
| Pros | Cons |
|---|---|
| As-code semantic layer keeps one metric definition everywhere | Entry price is a large step up from an SMB BI budget |
| Flat monthly fee with 10 users included, so growth is predictable | Smaller vendor, less recognition with procurement |
| Extra users at $12.50 per month annually, cheap for the category | Modeling as code expects comfort with version control |
Pricing: Entry $960 per month, or $800 billed annually, first 10 users included. Standard $1,200 per month, or $1,000 billed annually. Security Compliance Suite $2,400 per month, or $2,000 billed annually. Extra users $15 per month, or $12.50 billed annually.
Best for: Growing teams that want governed metric definitions without a per-seat bill that scales with headcount.
11. Tableau - The Visual Ceiling, at a Real Per-Seat Price
If you're leaving because Zoho's charts look dated, Tableau is the direct fix. Its drag-and-drop visual grammar is still the fastest way for an analyst to build a chart genuinely worth showing a board, and it remains one of two Leaders in the 2026 Gartner Magic Quadrant for Analytics and BI Platforms alongside Microsoft.
The price is why it sits at number 11 rather than number 2 for this reader. Every person who builds a workbook needs a Creator seat, and an annual contract is required on every product. For a company that just left a tool with a free tier, committing to a year and a role-mix decision before touching the product is a real barrier.
Target audience and sizing. Companies of 50 and up with a dedicated analyst or two and a real need for polished visual output.
Stage fit. Best when charts are a deliverable, not just an internal reference.
| Pros | Cons |
|---|---|
| The strongest default visual output of any tool on this list | Every workbook builder needs a $75/user/month Creator seat |
| Deep, mature analytical calculations for complex questions | Annual contract required on every product |
| Huge community, template library and hiring pool | Data prep lives in Tableau Prep, a separate product |
Pricing: Tableau Standard from $15 USD per user per month billed annually; Tableau Enterprise from $35 USD per user per month billed annually; Tableau Cloud Plus and Tableau Plus quoted. Within Standard, role rates are Creator $75, Explorer $42 and Viewer $15 per user per month billed annually.
Best for: Teams where the chart itself is the product and the budget can carry a Creator seat. If Tableau is what you're replacing, see the Best Tableau Alternatives guide, or Power BI vs Tableau for the head-to-head.
12. ThoughtSpot - Ask a Question Instead of Filing a Dashboard Request
ThoughtSpot's founding premise is that dashboards are a workaround for the fact that most people can't query data themselves, and the fix is search rather than a better chart builder. Type a question in plain language, get an answer and a visualization, and Spotter AI agents handle the follow-up. Where every new question queues behind the one person who knows the data, that's a structural change rather than a feature.
Pricing is published, which is rarer in this half of the list than it should be. The catches are the caps and the input quality: Essentials stops at 50 users, so a growing company steps up to Pro and doubles its per-seat rate, and search only works well on data modeled cleanly first.
Target audience and sizing. Teams of 10 to 200 with a real analyst bottleneck and reasonably clean, modeled data.
Stage fit. Best once data is modeled well enough that a plain-language question maps to a correct answer.
| Pros | Cons |
|---|---|
| Natural-language search removes the dashboard request queue | Essentials caps at 50 users and 25 million rows |
| Published per-seat pricing from $25/user/month billed annually | Pro doubles the seat rate to $50/user/month |
| Spotter AI agents handle follow-up analysis automatically | Search quality depends entirely on data modeling first |
Pricing: Essentials from $25 per user per month billed annually (5 to 50 users, 25 million rows); Pro from $50 per user per month billed annually (up to 1,000 users, 250 million rows); Enterprise custom. Embedded Developer tier free for one year (10 users, 25 million rows).
Best for: Companies whose real bottleneck is analyst capacity rather than tooling, and whose data is already modeled cleanly.
13. Qlik Cloud Analytics - Unlimited Users Once You Pass the Starter Tier
Qlik prices by data capacity rather than by seat, which is the most useful thing to know about it if you're leaving a tool with a viewer add-on. Above Starter, users cost nothing at all. Worth flagging because it trips up a lot of comparison content: the old per-user Qlik Sense Business plan is gone, so any per-user Qlik figure you find elsewhere is wrong.
Technically, the associative engine is the differentiator: users follow relationships in any direction rather than the drill paths a dashboard defines, and it surfaces which values are not associated with a selection. The downside for an SMB is obvious. Data volume forces upgrades regardless of user count, so a company with lots of history and few users pays for the history.
Target audience and sizing. Companies of 25 to 500 expecting to add many viewers, where data volume is easier to predict than headcount.
Stage fit. Best once you can estimate your data footprint in GB more confidently than your future org chart.
| Pros | Cons |
|---|---|
| Extra users are free above Starter, so viewer count stops mattering | Priced by GB, so data growth forces upgrades |
| Associative engine supports genuinely non-linear exploration | $300/month Starter is a hard entry off a free plan |
| Predictable flat monthly bill instead of per-seat math | Starter's 10 GB cannot be expanded without moving up |
Pricing: Starter $300 per month billed annually (10 users, 10 GB, no extra capacity purchasable); Standard $825 per month billed annually (unlimited users, 25 GB, expandable); Premium $2,750 per month billed annually (50 GB); Enterprise custom from 250 GB.
Best for: Teams that would rather budget around data volume than negotiate seat counts every renewal. For how it stacks up against the search-first and embedded platforms, see Qlik Cloud Analytics vs ThoughtSpot vs Sisense.
14. Domo - Free Seats, Consumption-Priced Platform
Domo is where companies land when the goal is genuinely company-wide distribution: every employee gets a seat at no per-seat cost, and you pay for consumption credits committed annually instead. Its mobile experience is the best in this category by a distance, which matters for field, retail and hospitality businesses where the people who need the number aren't at a desk.
It sits last for this reader because of forecastability. Domo publishes no price, no tier names and no figures, and credit burn depends on query volume, refresh frequency and usage intensity, which is exactly the variable a budget-conscious SMB is trying to eliminate. Teams routinely under-forecast first-year consumption and end up in a mid-year true-up.
Target audience and sizing. Companies of 100 and up wanting company-wide distribution, especially with a large non-desk workforce.
Stage fit. Best once analytics is a company-wide programme with a budget owner, not a departmental tool.
| Pros | Cons |
|---|---|
| Seats cost nothing, so distribution is never a licensing decision | No published price, tier names or figures anywhere |
| Best mobile analytics experience in the category | Credit consumption is hard to forecast in year one |
| App store model lets non-technical staff build data apps | Consumption pricing is the opposite of a budget-led buy |
Pricing: No published price. Seats are free; the product is a pool of consumption credits committed annually and quoted through sales.
Best for: Larger, distribution-led organizations with a finance function comfortable with a variable annual commitment. If Domo is what you're leaving, see the Best Domo Alternatives guide.
The Free Tier Reality Check
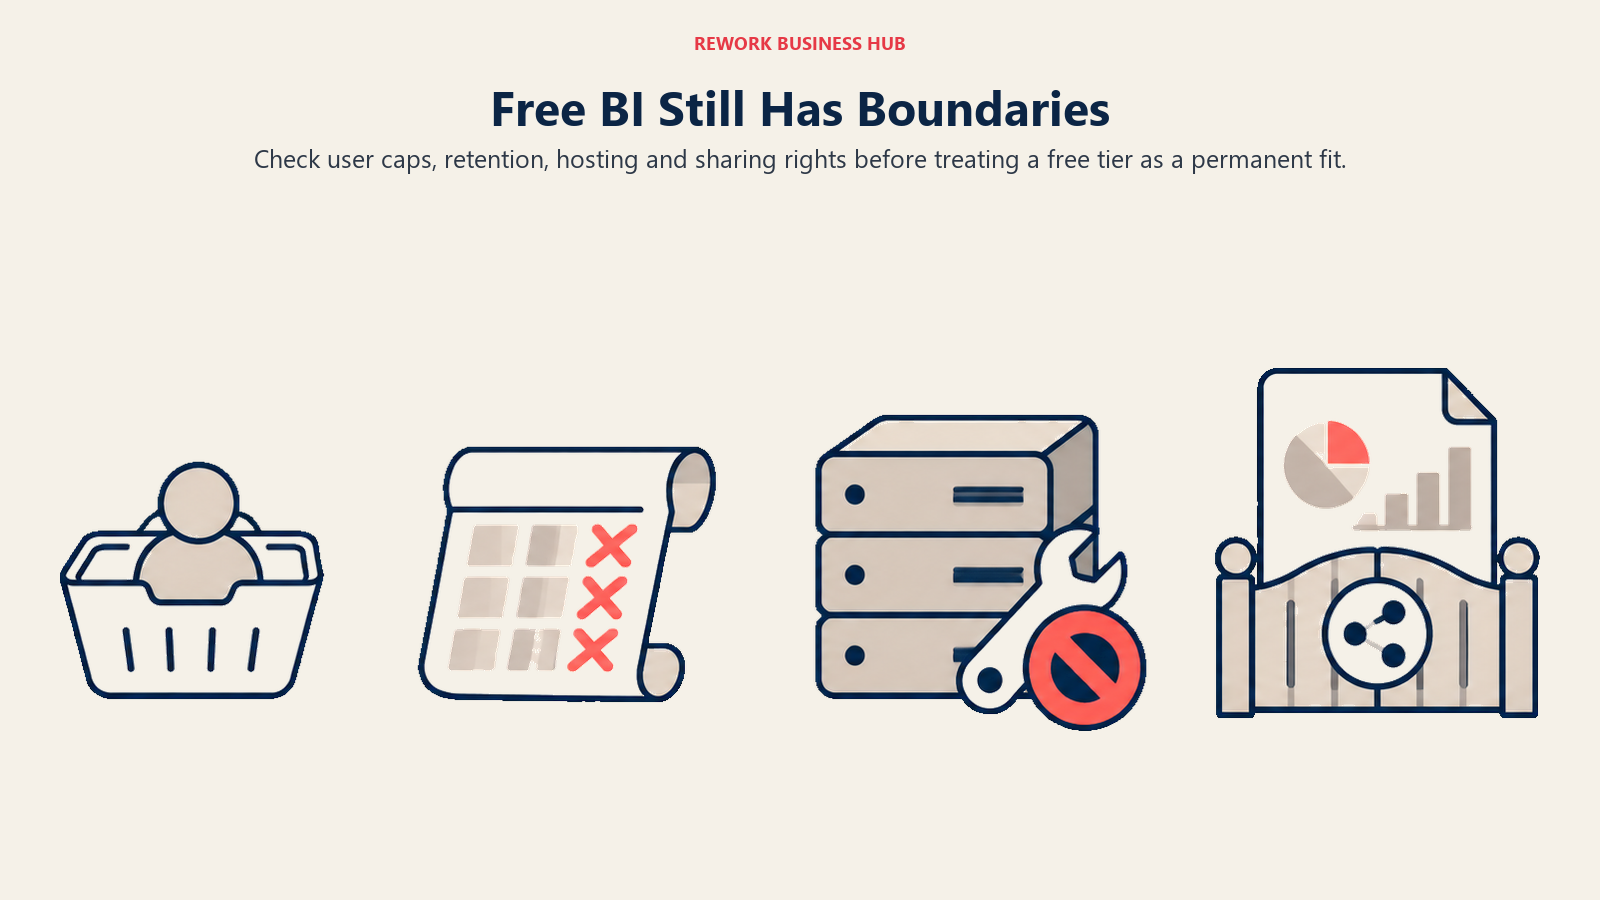
Free tiers are the most-copied and least-checked numbers in this category, and a "free forever" claim from a comparison article written 18 months ago is worth nothing. Every line below was checked against the vendor's own pricing page in August 2026. Read the limit column, not the word "free."
| Tool | Free tier exists? | The actual limit |
|---|---|---|
| Looker Studio | Yes | No user cap, no row cap; Pro adds team features at an unpublished per-user-per-project rate |
| Metabase | Yes, open source only | Free edition is self-hosted with unlimited users; Metabase Cloud is not free at any tier |
| Preset | Yes | Starter is $0 forever, capped at 5 users |
| Grafana Cloud | Yes | 14-day retention, and only 3 active Grafana visualization users per month |
| Databox | Yes | 1 user, 3 data sources, 1 dashboard, 10 custom metrics |
| Hex | Yes | Community tier, individual use, small compute |
| Microsoft Power BI | Partial | Free account works for personal use only, no sharing |
| Amazon QuickSight | No | Trial and promotional access only, then a $3 Reader minimum |
| ThoughtSpot | Partial | Embedded Developer tier free for 1 year (10 users, 25M rows), not a general free plan |
| Apache Superset | Yes | Free and open source if you self-host it yourself |
| Tableau, Qlik, Sigma, Holistics, Domo | No | Trials only, then a paid contract |
| Zoho Analytics (incumbent) | Yes | 2 users, 10,000 rows, 5 workspaces, unlimited reports and dashboards |
Note the two genuinely unlimited entries. Looker Studio and self-hosted Metabase are the only tools here where "free" survives contact with growth: Google subsidizes Looker Studio to keep you in its ads ecosystem, and Metabase gives away the software while charging for hosting and enterprise controls. Everything else labelled free is a small starter allowance or a time-limited trial.
Sizing and Persona Fit
| Company size | Who's driving the decision | Best fits |
|---|---|---|
| Under 10 people | Owner or founder, no analyst | Looker Studio, Zoho Analytics free plan, Databox Free |
| 10 to 50 people | Ops or marketing lead who inherited reporting | Looker Studio, Metabase, Power BI Pro, Preset Starter, Databox Pro |
| 50 to 200 people | First data hire or a finance lead with a budget | Power BI Pro, Metabase Cloud, Preset Professional, Holistics, ThoughtSpot Essentials |
| 200 to 500 people | Head of Data or a BI team of two to five | Tableau, Qlik Cloud Analytics, Sigma, ThoughtSpot Pro, QuickSight |
| 500 and up | CIO or VP Analytics with procurement involved | Domo, Tableau Enterprise, Qlik Premium, Sigma |
The pattern worth naming: the useful question isn't company size, it's whether anyone in the building writes SQL. A 30-person company with one strong analyst has more options (Metabase, Preset, Hex, Holistics) than a 150-person company with none, which gets pushed toward Power BI, Databox or ThoughtSpot regardless of headcount.
Stage Fit
| Where your data lives right now | What to pick |
|---|---|
| Inside Zoho apps only | Stay on Zoho Analytics until something actually breaks |
| Inside SaaS apps, no database | Databox or Looker Studio |
| Google Ads, GA4 and Sheets | Looker Studio |
| A production Postgres or MySQL | Metabase or Preset |
| A cloud warehouse (BigQuery, Snowflake, Redshift) | Metabase, Sigma, Holistics, Power BI or QuickSight |
| Time-series and operational telemetry | Grafana |
| Everywhere, and definitions have started to disagree | Holistics or Looker |
Migrating Off Zoho Analytics: What Actually Transfers
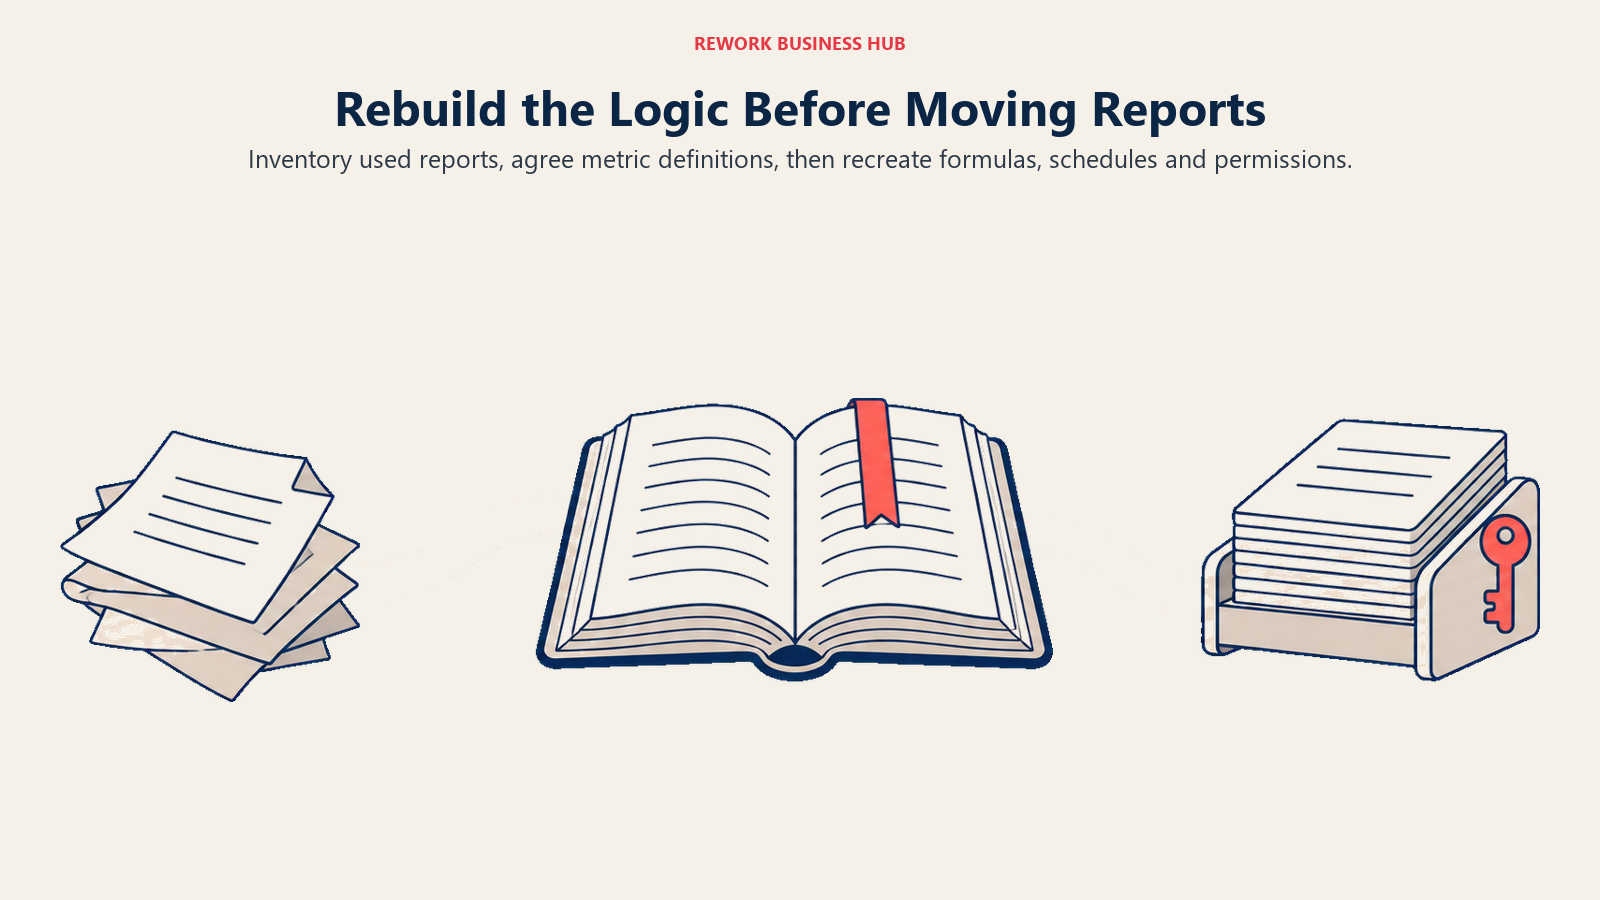
Almost nothing transfers automatically, and pretending otherwise is how migrations blow their timeline. Zoho Analytics workspaces, reports and formula columns don't import into any other platform here. What you're moving is the logic, rebuilt in the new tool's language: DAX in Power BI, SQL models in Metabase or Preset, as-code modeling in Holistics, or connector-mapped metrics in Databox.
| What you're moving | Does it transfer? | What it takes |
|---|---|---|
| Underlying data | Yes | Export from Zoho or reconnect the source directly; the data was never locked in |
| Report and dashboard layouts | No | Rebuild, usually faster than the original build because the design decisions are made |
| Formula columns and calculated fields | No | Rewrite as SQL, DAX or the new tool's measure syntax |
| Scheduled email reports | No | Recreate as the new tool's schedules or alerts |
| User permissions and workspace roles | No | Remap manually; this is where teams forget someone and lose a week |
| Zoho app connectors (CRM, Books, Desk) | Depends | Some tools have native Zoho connectors; most need an API pull or a warehouse in between |
The practical sequence: write down every report anybody actually opened in the last 90 days before you cancel anything, because that list is usually a third the size of the report count and it's the only thing you need to rebuild. Then agree the definitions before rebuilding, not after. If nobody has written down what "active customer" means, a revenue data dictionary is the cheapest hour you'll spend, and it outlasts whichever tool wins. And if the real problem is that CRM data is a mess before it reaches a chart, no BI tool fixes that: the Best Zoho alternatives roundup covers that side.
How to Choose: Decision Framework
| If you need... | Choose |
|---|---|
| Reporting that costs zero, permanently | Looker Studio or self-hosted Metabase |
| To escape row caps without a licence bill | Metabase Open Source |
| The cheapest credible paid seat | Microsoft Power BI Pro at $14.00/user/month paid yearly |
| A managed free tier for a small technical team | Preset Starter, free up to 5 users |
| Cross-tool KPI dashboards with unlimited users on a flat fee | Databox Pro |
| Cheap read-only distribution on an AWS stack | Amazon QuickSight Reader seats at $3/user/month |
| Real-time operational dashboards | Grafana |
| To publish one analyst's work without buying everyone a seat | Hex, priced per editor |
| A spreadsheet interface that writes back to the warehouse | Sigma Computing |
| Governed metric definitions at a flat monthly fee | Holistics |
| The best-looking charts in the category | Tableau |
| Plain-language questions instead of a dashboard request queue | ThoughtSpot Essentials |
| To add unlimited viewers without per-seat cost | Qlik Cloud Analytics Standard |
| Company-wide distribution with free seats | Domo |
If a governed semantic layer is the real requirement and Looker keeps coming up, the Best Looker Alternatives guide covers that side of the category in more depth.
Two shortcuts worth taking. If your monthly reporting is fewer than ten recurring questions, rebuild them in Looker Studio this week for nothing. And if you're about to sign an annual contract, price your viewer count first, because three tools here (Qlik above Starter, Databox, Domo) make viewers free by design.
Frequently Asked Questions about Zoho Analytics Alternatives
How much does Zoho Analytics actually cost?
Zoho publishes an always-free plan (2 users, 10,000 rows, 5 workspaces) and paid cloud plans from $25 per month for 2 users and 500,000 rows up to $495 per month for 50 users and 50 million rows, with 20% off for yearly billing. Extra users are $8 per user per month, or $6.40 billed annually, and viewer licences are $4 per viewer per month with a 25-viewer minimum. The four paid tiers between those endpoints step up by allocation rather than by feature set alone: 2 users and 0.5 million rows, then 5 and 1 million, then 15 and 5 million, then 50 and 50 million.
What is the cheapest real Zoho Analytics alternative?
Free, in two cases that survive growth. Looker Studio costs nothing with no user or row cap, and Metabase's open source edition is free and self-hosted with unlimited users and no row limit. The cheapest paid seat with full BI depth is Microsoft Power BI Pro at $14.00 per user per month paid yearly.
Is there a free alternative that supports unlimited users?
Two. Self-hosted Metabase Open Source is free with unlimited users, and Looker Studio has no user cap on its free tier. Preset Starter is free forever but capped at 5 users, Databox Free is 1 user with 3 data sources, and Grafana Cloud's free tier includes only 3 active visualization users per month with 14-day retention.
Why do Zoho Analytics prices differ between comparison articles?
Because Zoho's marketing pricing page renders its figures through a client-side script rather than printing them in the page, so cached copies, scrapers and comparison articles frequently disagree with each other and with Zoho. The figures in this guide come from Zoho's own help centre, which prints them plainly: $25 a month at the entry tier, $495 a month at the top.
What do we lose migrating off Zoho Analytics?
The report layouts, formula columns, scheduled emails and permission structures, all of which get rebuilt rather than imported. The underlying data was never locked in. Write down which reports people actually opened in the last 90 days before you cancel.
Should we stay on Zoho Analytics if we already run Zoho CRM and Books?
Often, yes. Inside the Zoho suite it's the cheapest credible way to report across CRM, accounting and helpdesk data without building a pipeline. Switch when a row cap, a missing connector or live-query performance is actively blocking work, not because the charts look dated.
Which alternative handles large datasets best on a small budget?
Metabase against a real database, or Amazon QuickSight if you're on AWS, where the SPICE in-memory engine handles scan-heavy queries well. Both avoid the live-query slowdown that pushes people off Zoho Analytics, and both start well under $200 a month for a small team.
How long does switching BI tools usually take?
For an SMB with 10 to 30 recurring reports, a few weeks of part-time work, most of it spent agreeing metric definitions and remapping permissions rather than rebuilding charts. Deployments with heavy formula-column logic run one to three months, and the timeline depends more on how well your data is documented than on which tool you picked.
What to Do Next
Pick two candidates from the decision framework, then rebuild one real report in each, ideally the one your leadership team actually looks at. Time how long it takes somebody on your team, not a vendor solutions engineer, to match the numbers your current Zoho dashboard produces. If neither can match them, the problem is your data rather than your BI tool, and switching platforms moves that problem instead of solving it.
Then price the real deployment at the headcount you expect in 18 months, not today's, including viewers. Use the 5, 15 and 50-user table above as the template and fill in your own mix. The gap between the marketing tier and the actual invoice is almost always viewer licensing, and it's the one number worth getting right before anyone signs anything.
Camellia writes about analytics and business intelligence software for B2B teams. Pricing verified against vendor pricing pages in August 2026.

Principal Product Marketing Strategist
On this page
- Key Facts
- Quick Comparison Table
- Why Teams Outgrow Zoho Analytics
- What Zoho Analytics Actually Costs
- What This Actually Costs at 5, 15 and 50 Users
- 1. Looker Studio - Free, and Already Connected to Half Your Data
- 2. Metabase - The Open Source Escape Hatch From Row Limits
- 3. Microsoft Power BI - The Cheapest Credible Paid Seat in BI
- 4. Preset (Managed Apache Superset) - Free to Five Users, Then Twenty Dollars a Seat
- 5. Databox - Flat-Fee Dashboards for Marketing and Revenue Metrics
- 6. Amazon QuickSight - Cheap Viewers, If You Already Run on AWS
- 7. Grafana - Free Dashboards Built for Operational Data
- 8. Hex - Notebooks for the One Person Who Actually Writes SQL
- 9. Sigma Computing - Spreadsheet-Native BI on Top of a Warehouse
- 10. Holistics - A Governed Semantic Layer at a Flat Monthly Fee
- 11. Tableau - The Visual Ceiling, at a Real Per-Seat Price
- 12. ThoughtSpot - Ask a Question Instead of Filing a Dashboard Request
- 13. Qlik Cloud Analytics - Unlimited Users Once You Pass the Starter Tier
- 14. Domo - Free Seats, Consumption-Priced Platform
- The Free Tier Reality Check
- Sizing and Persona Fit
- Stage Fit
- Migrating Off Zoho Analytics: What Actually Transfers
- How to Choose: Decision Framework
- What to Do Next