Best Domo Alternatives in 2026: 14 Tools With Pricing You Can Actually Predict
Turn this article into takeaways for your work.


Each assistant summarizes the article only for you and suggests best practices for your work.
Updated August 2026
Domo is a genuine all-in-one data platform, not just a dashboarding tool: ETL and ELT pipelines, a governed cloud data warehouse, BI and visualization, plus low-code apps built with Domo Everywhere and Domo Workflows, all under one login. If you want the closest peers making the same all-in-one bet, start with Sisense, ThoughtSpot and Qlik Cloud Analytics below. If your data already lives inside Microsoft or Google, Power BI, Tableau and Looker are the pragmatic default. And if a lighter, budget-predictable dashboard tool is closer to what you actually need than a full data platform, Klipfolio, Databox, Metabase, Preset and Grafana get you there without a platform-wide commitment.
So why does a Domo account still end up on a shortlist of alternatives? The vendor publishes no pricing page with a single figure on it, not a tier name, not a starting number. That's because Domo doesn't charge per user at all: seats are free, and the actual product is a pool of consumption credits, spent on data storage, table updates, workflow runs and ML inference, that you commit to annually or over a multi-year term. That's a genuinely different cost model from every seat-priced competitor in this guide, and it's the reason a Domo bill can move even when headcount doesn't. Every price in this article was checked against the vendor's own pricing page in August 2026, and where a vendor publishes nothing, this guide says so instead of borrowing a stale number from a review site. For the full 15-tool category view, start with the Best Business Intelligence Tools 2026 roundup.
Key Facts
- Wasted cloud spend rose to 29% in 2026, reversing five years of decline, and organizations are exceeding their cloud budgets by 17% on average, per Flexera's 2026 State of the Cloud Report, based on a survey of more than 750 cloud decision-makers. Consumption-priced platforms like Domo sit squarely inside that risk.
- Domo's median annual contract runs about $50,000, ranging from roughly $10,920 to $175,245 (reported), per Vendr's marketplace data drawn from 91 verified purchases. Domo does not publish these figures; this is third-party deal data, not a vendor rate card.
- Nearly two-thirds of BI and analytics teams say AI has either accelerated or refocused their planning, and 50% now rate their own AI maturity as advanced or intermediate, according to Dresner Advisory's 17th Edition Business Intelligence Market Study, published in 2026.
- Gartner named Microsoft a Leader in the 2026 Magic Quadrant for Analytics and Business Intelligence Platforms for the nineteenth consecutive year, per Microsoft's own Power BI blog recap of the report. Category leadership at that platform's price point is a real part of the pull away from Domo.
- ThoughtSpot was named a Leader in the same 2026 Gartner Magic Quadrant, the only independent (non-hyperscaler-owned) vendor in the Leaders quadrant, per ThoughtSpot's July 2026 announcement.
Quick Comparison Table
| Tool | Best For | Starting Price | Key Strength | Key Limitation |
|---|---|---|---|---|
| Microsoft Power BI | Teams already living in Microsoft 365 | Free (personal); Pro $14.00/user/mo paid yearly | Deepest Excel, Teams and Fabric integration of any tool here | Real governed sharing at scale needs Fabric capacity, priced separately |
| Tableau | Teams that want the deepest visual analytics craft | Creator $75, Explorer $42, Viewer $15/user/mo, billed annually (Standard edition) | Best-in-class visual exploration and a huge community of built techniques | Creator seats get expensive fast across a large analyst team |
| Qlik Cloud Analytics | Teams that want associative, not query-based, exploration | Starter $300/mo (10 users, 10GB), billed annually | Associative engine surfaces relationships SQL-style tools miss | Capacity based; growth means buying more GB, not more seats |
| Sisense | Product teams embedding analytics into their own app | No published price (Self-Serve trial or Enterprise) | Built from the ground up for white-label, embedded BI | Zero pricing signal anywhere, same opacity problem as Domo |
| ThoughtSpot | Teams that want natural-language search over governed data | Essentials from $25/user/mo billed annually (5-50 users) | Spotter conversational AI plus a 2026 Gartner Leader placement | Full governed rollout needs the pricier Pro tier |
| Sigma Computing | Teams that want a literal spreadsheet interface on the warehouse | No published price (trial and demo only) | Writes back to the warehouse; no separate BI extract to maintain | No pricing signal published at all |
| Looker (Google Cloud) | Teams standardizing a single governed semantic layer (LookML) | No published price; quote-only, annual commitment | One modeling layer serves dashboards, embedding and AI agents alike | No self-serve entry point; every deployment starts with a sales call |
| Metabase | Small teams that want a real free, self-hosted option | Free (self-hosted, unlimited users); Cloud Starter $100/mo, or $90/mo billed annually | Genuinely free open-source edition, not a crippled trial | The free tier is self-hosted only; Cloud starts paid from day one |
| Zoho Analytics | SMBs wanting an always-free plan plus room to grow | Always-free (2 users, 10,000 rows); paid from $25/mo | Real free tier plus a full paid ladder inside one product | Row and user caps climb fast once you're past the free plan |
| Amazon QuickSight | Teams already deep in the AWS data stack | Author $24, Reader $3/user/mo, plus a $250/mo account fee once Pro features are on | Pay-per-session Reader pricing fits huge, occasional-viewer audiences | A flat per-account infrastructure fee applies before you've added a single Pro user |
| Klipfolio | Agencies and ops teams wanting unlimited seats on one flat bill | $120/mo (Base), billed annually, unlimited users | No per-seat math ever; price is set by dashboard count, not headcount | No free plan, and dashboard caps (3 to 40) still gate growth |
| Databox | Teams that want one KPI view pulled from many marketing/sales tools | Free (1 user, 3 sources); Pro $159/mo billed annually (unlimited users) | Free tier is real, and Pro unlocks unlimited users at a flat price | Data source counts stay capped even on paid tiers |
| Preset (Apache Superset) | Teams wanting open-source SQL-native BI without self-hosting it | Free forever, up to 5 users; Professional $20/user/mo billed annually | Built on Apache Superset, so nothing is ever vendor-locked | Governance and enterprise features are thinner than a full platform like Domo |
| Grafana | Engineering and DevOps teams needing live operational dashboards | Free (OSS and Grafana Cloud Free); Pro $19/mo platform fee plus usage | Best-in-class for real-time, high-frequency operational metrics | Not built for governed business reporting the way Domo or Power BI are |
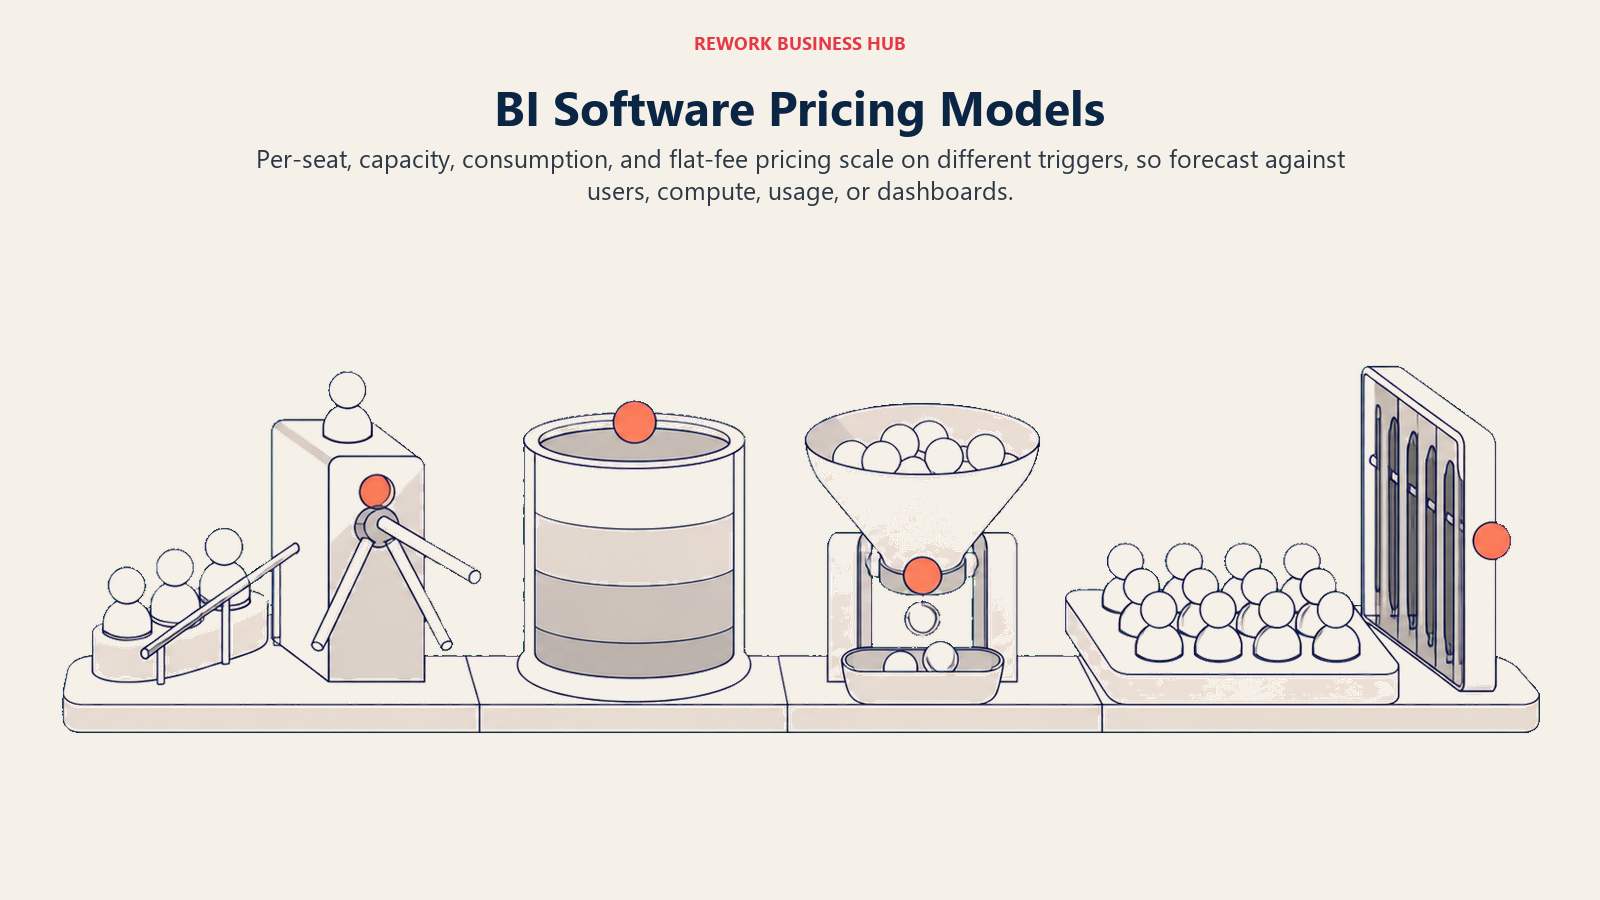
Pricing Models: Per Seat vs Capacity vs Consumption vs Flat Fee
Domo's consumption-credit model isn't unique in this guide, but it is the least transparent version of it. Here's how the four pricing shapes behave when a team's actual usage doubles.
| Model | How it's billed | Examples in this guide | What happens when usage doubles |
|---|---|---|---|
| Per seat | Price scales with named or active users | Power BI, Tableau, ThoughtSpot, Zoho Analytics, QuickSight Author/Reader, Databox Pro (per-source add-ons) | Cost is predictable and linear; doubling headcount roughly doubles the bill, easy to forecast |
| Capacity based | Price scales with a fixed resource band (data volume, compute), extra users often free | Qlik Cloud Analytics | Cost jumps in steps when you cross a GB or compute threshold, not gradually, so a mid-year surge means an unplanned tier upgrade |
| Consumption or credit based | Price scales with metered usage (rows processed, workflow runs, ML inference, tokens) drawn from a pre-purchased pool | Domo (storage, table updates, workflows, ML inference); Looker's Conversational Analytics token overages ($3.00/1M input, $20.00/1M output tokens) | Cost is the hardest to forecast of the four; usage can double without headcount changing at all, and a true-up at renewal can arrive as a surprise |
| Flat platform fee | One price for the platform regardless of seats, gated by a different limit (dashboards, data sources) | Klipfolio (dashboard count), Lightdash Cloud (mentioned for contrast, unlimited users at a flat rate) | Cost stays flat as more people view dashboards; the real growth constraint is the unrelated cap (dashboard count, source count), not usage |
Why Teams Leave Domo
| Reason | What it looks like in practice | Who feels it most |
|---|---|---|
| No published price anywhere | There's no figure to budget against before a sales call even starts | Teams that need a number before they can request approval |
| Consumption credits are hard to forecast | Storage, table updates, workflows and ML inference all draw from the same pool, so usage can spike without a headcount change | Finance and procurement trying to model next year's renewal |
| Annual or multi-year lock-in with no rate card | You commit to a credit volume for a year or more before you know your real burn rate | Teams evaluating Domo for the first time, with no prior usage data to model from |
| Renewal true-up risk | If usage grew past the committed credit pool, the true-up conversation happens at renewal, not proactively | Teams that scaled dashboards, workflows or data volume mid-contract |
| Breadth over depth in any single layer | ETL, warehouse, BI and apps are all present, but a team that only needs one of those four may find each layer shallower than a specialist tool | Teams that already have a warehouse (Snowflake, BigQuery) and just want BI on top |
| Per-seat or capacity pricing wins on transparency | A tool that names a dollar figure per user or per GB is easier to model than a shared credit pool | Teams that value a rate card they can plan against over a unified platform |
The Seven Paths Out of a Domo Evaluation
Almost nobody evaluating Domo alternatives is starting cold. You already decided connected, governed reporting across the company matters, or you wouldn't have bought Domo in the first place. What the evaluation usually resolves is one of seven different questions.
| Path | What you've decided | Tools covered here |
|---|---|---|
| Stay on a governed all-in-one platform | The combined ETL-warehouse-BI-apps idea is right, but Domo's pricing or fit isn't | Sisense, ThoughtSpot, Qlik Cloud Analytics |
| Default to your existing cloud ecosystem | Microsoft or Google already owns your data stack, so BI should live inside it | Microsoft Power BI, Tableau, Looker |
| Move to AI-native, spreadsheet-style self-service | You want natural-language and warehouse-native modeling over a rigid dashboard builder | Sigma Computing |
| Go open source and self-hosted | Licensing cost matters more than a managed platform, and you have the engineering capacity to run it | Metabase, Preset (Apache Superset), Grafana |
| Go lighter: dashboards and KPI reporting only | You need a KPI view or client-facing dashboard, not a full data platform | Klipfolio, Databox |
| Stay AWS-native | Your data already lives in AWS and QuickSight is the path of least resistance | Amazon QuickSight |
| Cover the whole company on one budget-friendly ladder | You need BI plus a real free tier for the long tail of casual, occasional users | Zoho Analytics |
Read the section below that matches your answer, or read straight through if you're still deciding.
1. Microsoft Power BI: The Default When You're Already on Microsoft 365
Power BI is the most widely deployed BI tool in the world for one structural reason: it's an Excel-adjacent product, not a separate destination, and Gartner named Microsoft a Leader in the 2026 Magic Quadrant for Analytics and Business Intelligence Platforms for the nineteenth consecutive year running. Where Domo bundles ETL, warehouse, BI and apps into one credit pool, Power BI leans on the rest of the Microsoft stack, Fabric for the data layer, Teams for distribution, Copilot for AI, rather than owning every layer itself.
Methodology and fit. DAX-based semantic modeling, a large library of visuals, and direct query or import connections to virtually every enterprise data source make Power BI the practical choice for teams that already standardized on Microsoft. One pricing note worth flagging: Power BI Pro moved to $14.00 a user a month paid yearly; if you're still budgeting off the old $10 figure, that's stale.
| Pros | Cons |
|---|---|
| Deepest Microsoft 365, Teams and Excel integration of any tool in this guide | Sharing at real scale needs Fabric capacity, a separate purchase decision |
| DAX and the semantic model layer are genuinely powerful once learned | The learning curve for DAX is real, unlike Domo's more visual Beast Mode calculations |
| Gartner Leader for 19 consecutive years signals long-term platform stability | Premium Per User adds cost fast if you need its extra features broadly |
Pricing. Free for personal use (can't share). Pro is $14.00 per user per month, paid yearly. Premium Per User is $24.00 per user per month, paid yearly. Fabric capacity, needed for large-scale governed sharing, is priced separately by capacity unit and region.
Best for: Teams already standardized on Microsoft 365 who want BI as an extension of tools people already use, not a separate platform to learn. If Power BI itself becomes the incumbent you're shortlisting away from, the Best Power BI Alternatives guide covers that reverse direction, and the Power BI vs Tableau comparison works through that specific choice directly.
2. Tableau: The Deepest Visual Analytics Craft
Tableau, now part of Salesforce, remains the tool most analysts point to when visual exploration and design quality matter more than anything else. Where Domo optimizes for connected, governed dashboards across a whole company, Tableau optimizes for the individual analyst building something genuinely insightful, then sharing it.
Methodology and fit. Tableau's drag-and-drop visual grammar, its huge library of community-built techniques, and Tableau Pulse's AI-driven metric monitoring make it the default pick for data teams that treat visualization as a craft, not just a delivery mechanism. It sits comfortably alongside a Salesforce CRM deployment, but doesn't require one.
| Pros | Cons |
|---|---|
| Best-in-class visual exploration, still the reference point competitors get measured against | Creator seats, the tier most analysts need, get expensive across a large team |
| Massive community of shared techniques, dashboards and training content | Enterprise-edition pricing is inconsistently published across Tableau's own pages, so budget from Standard edition figures only |
| Tableau Pulse adds AI-driven metric monitoring on top of traditional dashboards | Less of a unified data platform than Domo; ETL and warehousing are someone else's job |
Pricing. Tableau Cloud, Standard edition, billed annually: Creator $75, Explorer $42, Viewer $15 per user per month. Enterprise edition costs more (Creator $115) but published figures for Explorer and Viewer at that tier are inconsistent across Tableau's own site, so quote Standard edition only until you have a direct quote.
Best for: Analyst-heavy teams where visual quality and exploratory depth matter more than owning the ETL and warehouse layer too. The Best Tableau Alternatives guide covers who else competes here if Tableau becomes the incumbent instead.
3. Qlik Cloud Analytics: Associative Exploration, Capacity Priced
If Qlik is the incumbent rather than the candidate, Qlik Sense alternatives covers the exit in the other direction.
Qlik's associative engine is a genuinely different approach from every SQL-query-based tool in this guide: instead of running one query per chart, it holds the whole dataset in memory and lets users click through relationships that a predefined query would never have surfaced. Gartner named Qlik a Leader in the 2026 Magic Quadrant for the sixteenth consecutive year.
Methodology and fit. Qlik Sense no longer sells the old per-user "Business" plan; Qlik Cloud Analytics is capacity priced now, meaning the constraint is data volume (GB), not headcount, and extra users are free above the Starter tier. That's a meaningfully different budget conversation than Domo's credit pool, since at least the GB tiers and dollar figures are published.
| Pros | Cons |
|---|---|
| Associative engine surfaces relationships a query-based tool would miss entirely | Capacity model means growth means buying more GB, a step-function cost, not a gradual one |
| Extra users are free once you're on Standard tier or above | Enterprise tier requires a 250GB minimum commitment |
| Gartner Leader for 16 consecutive years, deep enterprise track record | Migrating an associative data model is a genuinely different skill from SQL-based BI tools |
Pricing. Starter $300 a month (10 users, 10GB), Standard $825 a month (25GB, extra users free), Premium $2,750 a month (50GB), Enterprise quoted with a 250GB minimum. All billed annually.
Best for: Teams that want to explore data associatively rather than through predefined queries, and who can budget in GB rather than seats.
4. Sisense: Built for Embedding, Not Just Internal Dashboards
And if you are shopping away from Sisense rather than toward it, Sisense alternatives separates the embedded-first options from the internal-BI ones.
Sisense's whole design center is different from Domo's: instead of a company-wide internal reporting platform, it's built to be embedded inside someone else's product, white-labeled so end customers never know a third-party BI engine is running underneath.
Methodology and fit. The platform's Compose SDK and headless architecture let product teams drop analytics into a SaaS product's UI without it looking bolted-on. That's a genuinely different job than what Domo, Power BI or Tableau are built for, all three assume an internal audience logging into a dashboard, not an embedded experience inside a third-party app.
| Pros | Cons |
|---|---|
| Purpose-built for white-label, embedded analytics inside another product | No pricing signal published anywhere, the same opacity problem as Domo |
| Compose SDK gives engineering teams real control over the embedded experience | Two named plans only (Self-Serve trial, Enterprise), nothing in between |
| Headless architecture separates the analytics engine from the UI cleanly | Less suited to a purely internal, company-wide reporting use case |
Pricing. No published figures. Two plans named on the pricing page: Self-Serve (free trial) and Enterprise (contact sales).
Best for: Product and engineering teams building analytics into a customer-facing SaaS product, not evaluating a company's internal reporting stack.
5. ThoughtSpot: Conversational Search Over Governed Data
ThoughtSpot's pitch is natural-language search as the primary interface, not a bolt-on feature: type a question, get a chart, drill in conversationally. Gartner named ThoughtSpot a Leader in the 2026 Magic Quadrant, and notably the only independent vendor, meaning not owned by a hyperscaler, in that Leaders quadrant.
Methodology and fit. Spotter, ThoughtSpot's conversational AI agent, is built on top of a governed semantic layer, so answers stay grounded in approved metrics rather than freeform guesses. Pricing changed meaningfully in 2026: Essentials moved to $25 a user a month, not the old flat "$95 a month for 20 users" bundle some older comparisons still cite.
| Pros | Cons |
|---|---|
| Conversational search (Spotter) is core to the product, not an add-on | Full governed rollout across a large org needs the pricier Pro tier |
| The only independent vendor named a Leader in the 2026 Gartner Magic Quadrant | Row limits (25M on Essentials) constrain very large datasets at the entry tier |
| Embedded Developer tier is free for the first year (10 users) | Enterprise embedded pricing is custom, no published ceiling |
Pricing. Essentials from $25 a user a month billed annually (5 to 50 users, up to 25M rows). Pro from $50 a user a month billed annually (up to 1,000 users, 250M rows). Enterprise is custom. Embedded: Developer tier free for one year (10 users), Enterprise embedded custom.
Best for: Teams that want natural-language search as the default way people interact with data, backed by a governed semantic layer rather than a loose chatbot on top of raw tables.
6. Sigma Computing: The Warehouse as the Interface
Sigma makes a different architectural bet than every tool above it: instead of importing or extracting data into a separate BI layer, it writes queries directly against the warehouse (Snowflake, BigQuery, Databricks) in a spreadsheet-style interface, and can write back to it too.
Methodology and fit. For teams that already invested heavily in a modern cloud warehouse, Sigma's pitch is that there's no second copy of the data to maintain, no separate extract to keep in sync, unlike Domo's own data warehouse layer, which duplicates data your team may have already centralized elsewhere.
| Pros | Cons |
|---|---|
| No separate BI extract; queries run live against your existing warehouse | No pricing signal published at all, free trial and demo only |
| Spreadsheet-style interface lowers the learning curve for Excel-native analysts | Requires an existing modern warehouse investment to get the full benefit |
| Write-back capability lets business users adjust models without leaving the tool | Younger governance track record than Qlik, Tableau or ThoughtSpot |
Pricing. No published price. Free trial and a demo request are the only options on the pricing page as of August 2026.
Best for: Teams that already centralized data in a modern cloud warehouse and want BI to sit directly on top of it, not duplicate it into a separate platform the way Domo does.
7. Looker (Google Cloud): One Governed Semantic Layer, Quote Only
Looker, the Google Cloud core product, is a different thing from Looker Studio, and mixing the two up is the single most common pricing mistake in this category. Looker Studio is free. Looker (core) is not, and Google named it a Leader in the 2026 Gartner Magic Quadrant for the third consecutive year.
Methodology and fit. LookML, Looker's modeling layer, defines metrics once and reuses them across dashboards, embedded analytics and, increasingly, AI agents, the same "define once, use everywhere" idea Domo pursues with Beast Mode calculations, but built specifically for governance at scale. Every platform (Standard, Enterprise, Embed) includes 10 Standard users and 2 Developer users, then requires a quote for anything beyond that.
| Pros | Cons |
|---|---|
| LookML gives one semantic layer that feeds dashboards, embedding and AI agents alike | No self-serve entry point; every deployment starts with a sales conversation |
| Gartner Leader for the third consecutive year, deep Google Cloud data-stack ties | Annual commitment (1, 2 or 3 year terms) is the only contract shape offered |
| Conversational Analytics token overage pricing is at least published transparently | Easy to confuse with the separately priced, free Looker Studio product |
Pricing. No published price for Looker core; Standard, Enterprise and Embed editions are all quote-only, with 1, 2 or 3 year annual commitments. Each platform includes 10 Standard users and 2 Developer users. Conversational Analytics data-token overages are published: $3.00 per 1M input tokens, $20.00 per 1M output tokens, effective October 1, 2026. Looker Studio itself is free; Looker Studio Pro is a paid per-user, per-project license at $9 per user per project per month.
Best for: Teams standardizing one governed metrics layer across BI, embedding and AI agents inside a Google Cloud data stack. The Best Looker Alternatives guide covers the reverse direction if Looker becomes the incumbent you're evaluating away from.
8. Metabase: The Genuinely Free Self-Hosted Option
Metabase draws a hard line between its two editions, and it matters: the free tier is the self-hosted, open-source edition, unlimited users, no seat cost at all, while Metabase Cloud, the hosted version, starts on a paid plan from day one. Anyone repeating "Metabase is free" without that distinction is missing the actual pricing model.
Methodology and fit. For a team with the engineering capacity to self-host, Metabase gets you a real, unlimited-user BI tool at zero license cost, a fundamentally different economics than Domo's credit-metered consumption. For a team that wants someone else to run it, Cloud is a normal paid SaaS product.
| Pros | Cons |
|---|---|
| Self-hosted open source is genuinely free with unlimited users, not a crippled trial | The free tier requires you to host and maintain it yourself |
| Cloud Starter and Pro tiers are named with clear per-user overage pricing | Enterprise features (SSO, advanced permissions) start around $20,000 a year |
| Simple enough that non-technical users can self-serve basic questions quickly | Less modeling depth than Looker's LookML or Tableau's calculation engine |
Pricing. Open Source, self-hosted: free, unlimited users. Cloud Starter: $90 a month billed annually ($1,080/year), 5 users included, plus $6 per extra user per month. Cloud Pro: $517.50 a month billed annually ($6,210/year), 10 users included, plus $12 per extra user per month. Enterprise: custom, from roughly $20,000 a year.
Best for: Engineering-capable teams that want a real, free, unlimited-user BI tool and are willing to host it themselves, or small teams happy to pay a modest Cloud Starter fee instead.
9. Zoho Analytics: An Always-Free Plan With Room to Grow
Zoho Analytics is the one tool in this guide with a genuine always-free plan, not just a time-limited trial: 2 users and 10,000 rows, free indefinitely, inside the broader Zoho suite.
Methodology and fit. For SMBs already using other Zoho products (CRM, Books, People), Analytics slots in as a natural add-on. The paid ladder scales cleanly from there, though row and user caps climb fast once you're past the free tier, so budget for the next rung up sooner than the free plan suggests.
| Pros | Cons |
|---|---|
| Real always-free plan (2 users, 10,000 rows), not a time-boxed trial | Free-tier row and user limits are tight for anything beyond a pilot |
| 20% discount on annual billing across every paid tier | Public pricing page renders through a JS calculator, so bookmark the help-center figures instead |
| Deep native ties to the rest of the Zoho suite | Less analytical depth than Tableau, Qlik or ThoughtSpot for complex modeling |
Pricing. Always-free plan: 2 users, 10,000 rows. Paid cloud plans start at $25 a month (2 users, 500,000 rows) and run to $495 a month (50 users, 50 million rows), with a 20% discount for annual billing. Extra users run about $6.40 a month each.
Best for: SMBs already in the Zoho ecosystem, or any small team that wants to start on a genuinely free plan and grow into a paid tier only once the need is proven.
10. Amazon QuickSight: Built for AWS-Native Teams
QuickSight's pricing model looks unusual next to every other tool here because it's built around two very different user types: Authors who build dashboards, and Readers who only view them, priced and even billed by session in one option.
Methodology and fit. SPICE, QuickSight's in-memory engine, and native ties to Redshift, S3 and the rest of AWS make this the practical default for teams whose data already lives there. One line item is easy to miss: a flat $250-a-month per-account infrastructure fee kicks in once Pro users or Q&A (QuickSight's natural-language feature) are enabled, on top of the per-user rates.
| Pros | Cons |
|---|---|
| Pay-per-session Reader pricing fits large, occasional-viewer audiences well | The $250/month account fee applies before you've added a single Pro user |
| Deepest native integration with Redshift, S3 and the rest of AWS | SPICE storage is billed separately at $0.38 per GB per month |
| Reader capacity pricing (500 sessions for $250/month) scales predictably | Less of a unified data platform than Domo; ETL is still your team's job |
Pricing. Author $24, Author Pro $40, Reader $3, Reader Pro $20 per user per month. Reader capacity option: 500 sessions for $250 a month, $0.50 per extra session. SPICE storage: $0.38 per GB per month. A $250-a-month per-account infrastructure fee applies once Pro users or Q&A are enabled.
Best for: Teams already standardized on AWS who want BI pricing that scales with actual usage patterns (heavy authors vs. occasional viewers) rather than one flat per-seat rate.
11. Klipfolio: Unlimited Users, Priced by Dashboard Count
Klipfolio flips the usual pricing logic: every plan includes unlimited users, and the real constraint is how many dashboards you're allowed to build, from 3 on the entry tier up to 40 on the top one.
Methodology and fit. That structure makes Klipfolio a clean fit for agencies and ops teams that need to put dashboards in front of many stakeholders, clients, department heads, whole company all-hands screens, without doing per-seat math every time someone new needs a login.
| Pros | Cons |
|---|---|
| Unlimited users on every tier; no per-seat cost ever appears | No free plan at all, so there's no way to test-drive without paying |
| Price is predictable and flat once you know your dashboard count | Dashboard caps (3 to 40) still gate how much you can build, even with unlimited viewers |
| Simple enough to deploy without a dedicated BI team | Less analytical depth than a full platform for complex, ad hoc modeling |
Pricing. Base $120/month, Grow $190/month, Team $310/month, Team+ $600/month, all billed annually with unlimited users; dashboard limits run 3, 10, 20 and 40 respectively. No free plan.
Best for: Agencies, ops teams and anyone who wants to put dashboards in front of a large, unpredictable audience without a per-seat bill growing alongside it.
12. Databox: One KPI View Pulled From Many Marketing and Sales Tools
Databox's job is narrower than Domo's by design: pull metrics from dozens of marketing, sales and finance tools into one KPI dashboard, rather than serving as a general-purpose data platform.
Methodology and fit. The free tier is real (1 user, 3 data sources), and the jump to Pro unlocks unlimited users at a flat price, an unusual and genuinely useful structure for teams that want everyone looking at the same numbers without paying per login.
| Pros | Cons |
|---|---|
| Free tier is real and usable, not a crippled trial | Data source counts stay capped even on paid tiers |
| Pro tier unlocks unlimited users at one flat monthly price | Growth of your reporting needs beyond a KPI dashboard means outgrowing Databox entirely |
| 20% discount for annual billing across every paid tier | Not a data platform; there's no ETL, warehouse or app layer underneath it |
Pricing. Free: $0 (1 user, 3 data sources). Analyst: $64/month billed annually (1 user, 5 sources). Pro: $159/month billed annually (unlimited users, 3 sources, $5.60/month per extra source). Growth: $399/month billed annually. Custom: quoted.
Best for: Marketing and sales teams that want a single always-on KPI view pulled from many point tools, not a full data platform to build and maintain.
13. Preset (Apache Superset): Open Source, Managed for You
Preset is the managed, hosted version of Apache Superset, the open-source SQL-native BI project. The relationship matters: you get Superset's engine and its total lack of vendor lock-in, with someone else running the infrastructure.
Methodology and fit. Superset itself is free to self-host, and a team with the operational appetite can run it that way at zero license cost, similar in spirit to Metabase's open-source edition. Preset trades a small monthly fee for not having to run that infrastructure yourself, with a real free tier up to 5 users before you pay anything.
| Pros | Cons |
|---|---|
| Built on Apache Superset, so nothing here is ever proprietary or locked in | Governance and enterprise features are thinner than a full platform like Domo or Looker |
| Starter tier is free forever up to 5 users, a genuine no-cost entry point | Self-hosting Superset directly requires real engineering capacity to maintain |
| Professional tier removes the user cap at a modest per-user rate | Less polished out-of-box experience than commercial-first tools like Tableau |
Pricing. Preset Starter: free forever, up to 5 users. Preset Professional: $20 per user per month billed annually, $25 billed monthly, unlimited users. Enterprise: custom. Apache Superset itself remains free to self-host.
Best for: Engineering-oriented teams that want SQL-native, open-source BI without either running the infrastructure themselves or getting locked into a proprietary platform.
14. Grafana: Live Operational Dashboards, Not Business Reporting
Grafana is a genuinely different tool from everything else in this guide, and it's worth being honest about that up front: it's built for real-time, high-frequency operational and infrastructure metrics, not governed business reporting the way Domo, Power BI or Tableau are.
Methodology and fit. Engineering and DevOps teams use Grafana to watch system health, latency, error rates and infrastructure metrics update live, a job none of the business-BI tools above are built for. It's rarely a full Domo replacement on its own, but it's frequently the tool that sits alongside a business BI platform for the operational half of the picture.
| Pros | Cons |
|---|---|
| Best-in-class for real-time, high-frequency operational and infrastructure metrics | Not built for governed business reporting, financial dashboards or executive summaries |
| Free tier (OSS, self-hosted, and Grafana Cloud Free) covers a lot of real use cases | Usage-based pricing (active users, metric series, log volume) can grow unpredictably, similar to Domo's own consumption risk |
| Huge open-source plugin ecosystem for infrastructure and IoT data sources | Business users outside engineering rarely adopt it as their primary reporting tool |
Pricing. Grafana OSS: free, self-hosted. Grafana Cloud Free: $0. Pro: $19/month platform fee plus usage (visualization $8 per active user, metrics from $6.50 per 1,000 series, logs from $0.05 per GB processed). Enterprise: from $25,000 a year.
Best for: Engineering and DevOps teams that need live operational visibility alongside, not instead of, a business-focused BI platform.
Stage Fit Matrix
| Tool | Startup 0-50 | Growth 50-250 | Mid-Market 250-1,000 | Enterprise 1,000+ |
|---|---|---|---|---|
| Microsoft Power BI | Strong | Strong | Strong | Strong |
| Tableau | Moderate | Strong | Strong | Strong |
| Qlik Cloud Analytics | Weak | Moderate | Strong | Strong |
| Sisense | Weak | Moderate | Strong | Strong |
| ThoughtSpot | Weak | Moderate | Strong | Strong |
| Sigma Computing | Weak | Moderate | Strong | Moderate |
| Looker (Google Cloud) | Weak | Weak | Moderate | Strong |
| Metabase | Strong | Strong | Moderate | Weak |
| Zoho Analytics | Strong | Strong | Moderate | Weak |
| Amazon QuickSight | Moderate | Strong | Strong | Strong |
| Klipfolio | Strong | Strong | Moderate | Weak |
| Databox | Strong | Strong | Weak | Weak |
| Preset (Apache Superset) | Moderate | Strong | Moderate | Weak |
| Grafana | Moderate | Strong | Strong | Strong |
Sizing and Persona Table
| Tool | Headcount sweet spot | Primary buyer | Secondary buyer |
|---|---|---|---|
| Microsoft Power BI | 20 to 20,000+ | Director of BI / IT | Finance / Operations lead |
| Tableau | 100 to 10,000+ | Director of Analytics | VP of Data |
| Qlik Cloud Analytics | 200 to 10,000+ | VP of Data / Director of BI | Enterprise Architect |
| Sisense | 50 to 5,000 (product-embedded) | VP of Product / Engineering | Director of Data |
| ThoughtSpot | 100 to 10,000+ | VP of Data and Analytics | CIO |
| Sigma Computing | 50 to 2,000 | Director of Analytics / Data Platform lead | CFO |
| Looker (Google Cloud) | 200 to 20,000+ | CIO / VP of Data | VP of Engineering |
| Metabase | 5 to 500 | Data Analyst / Engineering lead | Founder / Ops lead |
| Zoho Analytics | 2 to 200 | Ops Manager / Founder | Finance lead |
| Amazon QuickSight | 20 to 10,000+ | Cloud / Platform Engineering lead | Director of BI |
| Klipfolio | 10 to 500 | Agency lead / Ops Manager | Marketing Director |
| Databox | 5 to 250 | Marketing Manager | Sales Director |
| Preset (Apache Superset) | 10 to 1,000 | Data Engineer / Platform lead | Director of Analytics |
| Grafana | 10 to 5,000+ | DevOps / SRE lead | VP of Engineering |
Migration Considerations
Moving off Domo is rarely just a dashboard-rebuild project, because Domo's four layers each need a separate replacement plan.
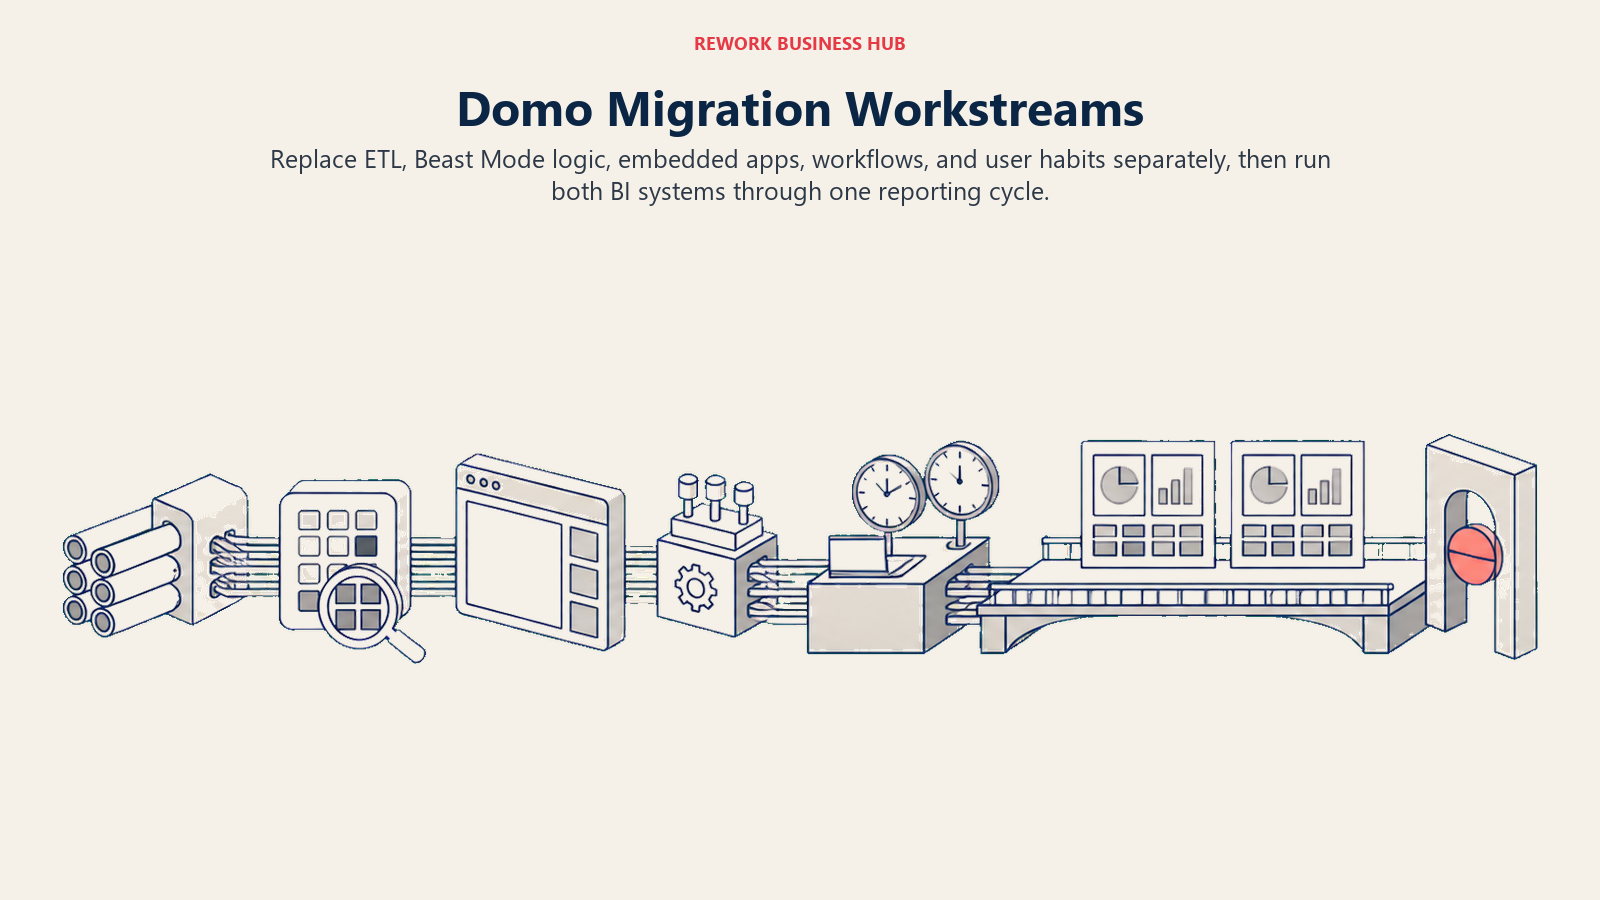
ETL and Magic ETL pipelines. Any transformation logic built in Domo's Magic ETL or DataFlows has to be rebuilt in whatever your new platform uses, dbt, a warehouse-native ELT tool, or the new BI tool's own pipeline layer if it has one. This is usually the single biggest line item in a migration estimate, not the dashboards themselves.
Beast Mode calculations and the semantic layer. Domo's Beast Mode calculated fields don't export cleanly to another tool's formula language (DAX in Power BI, LookML in Looker, Superset's SQL-based metrics). Budget time to re-derive and validate business logic, not just re-point connections.
Domo Everywhere and embedded apps. If you built customer-facing or partner-facing experiences with Domo Everywhere or the Domo Apps Framework, that's a genuine replatforming project, not a data migration, and Sisense or ThoughtSpot's embedded tooling are the more direct like-for-like landing spots.
Domo Workflows. Any automation logic built on Domo Workflows needs an equivalent home, often outside the BI tool entirely, in a workflow or automation platform, since most of the tools above are BI-only and don't replace a workflow engine.
User retraining and a parallel-run period. Whichever tool you land on, run both systems in parallel through at least one full reporting cycle (month-end close, board reporting) before fully cutting over, and budget the retraining time as seriously as the license cost. For general guidance on what makes a dashboard actually usable once it's rebuilt, the Dashboard Design Drives Decisions guide is worth reading before, not after, you rebuild your top reports. And if Domo was also doing double duty as your finance team's planning or expense-reporting layer, that's a separate replacement decision entirely, covered in the Best FP&A Software 2026 and Best Expense Management Software 2026 roundups.
If the actual job is revenue reporting to leadership rather than general BI, that's a discipline worth handling separately from the tool choice: the Revenue Operations Dashboard, RevOps Metrics That Matter and Board-Ready Revenue Reporting guides cover what to report and how, independent of which BI tool sits underneath it.
How to Choose: Decision Framework
The shortlist gets easier when you choose the operating job first and the vendor second.
| If you need... | Choose |
|---|---|
| Deep Microsoft 365, Excel and Teams integration | Microsoft Power BI |
| The most polished visual analytics craft for a dedicated analyst team | Tableau |
| Associative exploration that surfaces relationships a query wouldn't | Qlik Cloud Analytics |
| To embed white-label analytics inside your own product | Sisense |
| Natural-language search as the primary interface, backed by governance | ThoughtSpot |
| BI that queries your warehouse directly with no separate extract | Sigma Computing |
| One governed semantic layer feeding dashboards, embedding and AI agents | Looker (Google Cloud) |
| A genuinely free, self-hosted, unlimited-user option | Metabase |
| An always-free plan with room to grow inside one product | Zoho Analytics |
| Pricing that scales with AWS-native usage patterns, not flat seats | Amazon QuickSight |
| Unlimited users on a flat bill, gated by dashboard count instead | Klipfolio |
| One KPI view pulled from many marketing and sales tools | Databox |
| Open-source SQL-native BI without running the infrastructure yourself | Preset (Apache Superset) |
| Live operational and infrastructure dashboards alongside your BI tool | Grafana |
Frequently Asked Questions about Domo Alternatives
How much does Domo actually cost?
Domo publishes no pricing page with figures at all, and it doesn't charge per user, seats are free. The real cost is a pool of consumption credits, spent on storage, table updates, workflows and ML inference, that you commit to annually or over a multi-year term. Third-party deal data from Vendr puts the median annual contract around $50,000, ranging from about $10,920 to $175,245, but that's reported deal data, not a vendor-published rate.
Why doesn't Domo charge for user seats?
Domo's model shifted to consumption credits rather than per-seat licensing, so adding more people to view dashboards doesn't directly increase cost. What does increase cost is usage: more data stored, more table updates, more workflow runs and more ML inference draw down the same shared credit pool, whether one person or a thousand people are logged in.
Which Domo alternative has the most transparent pricing?
Klipfolio, Zoho Analytics and Databox all publish clear dollar figures with no sales call required to see them. Amazon QuickSight and Metabase also publish full per-tier pricing. Sisense, Sigma Computing and Looker publish nothing at all, similar to Domo itself.
Does any Domo alternative offer a genuinely free tier?
Yes, several, but read the fine print. Metabase's free tier is the self-hosted open-source edition, not the hosted Cloud product. Zoho Analytics and Databox both have real always-free plans with usage caps. Preset's Starter tier is free forever up to 5 users. Grafana OSS and Grafana Cloud Free are both genuinely free.
What's the cheapest way to move off Domo?
It depends what you actually need. If you have engineering capacity to self-host, Metabase's open-source edition or Apache Superset directly are free. If you want something managed without self-hosting, Zoho Analytics' free plan or Databox's free tier cost nothing to start, though both have real usage caps you'll hit as you scale.
Should we stay on an all-in-one platform or move to our existing cloud ecosystem's default tool?
Stay on an all-in-one platform, closer to what Domo already gives you, if the combined ETL-warehouse-BI-apps bundle is the right shape and only the pricing model or vendor relationship needs to change; Sisense, ThoughtSpot and Qlik Cloud Analytics are the closest peers. Move to your ecosystem default if you already run Microsoft or Google Cloud and would rather have BI live inside that stack than duplicate a warehouse layer Domo also builds; Power BI, Tableau and Looker fit that path.
Is Looker the same thing as Looker Studio?
No, and mixing them up is the most common pricing mistake in this category. Looker Studio is a free tool for building reports from Google Analytics, Sheets and other connected sources. Looker (the Google Cloud core product) is a quote-only, enterprise semantic-layer platform built around LookML. Looker Studio Pro sits in between, a paid per-user, per-project license at $9 per user per project per month.
Is open source BI (Metabase, Superset, Grafana) actually free, or is there a hidden cost?
The license itself is genuinely free in all three cases. The real cost is engineering time: someone has to host, patch, scale and secure the deployment, which is a real ongoing cost even though no invoice shows up for it. If you'd rather pay for that to be someone else's job, Metabase Cloud and Preset (managed Superset) are the paid, hosted equivalents of the same open-source engines.
What to Do Next
Pick your path before you book a single demo. If Domo's all-in-one bundle is the right shape and only the credit model or vendor relationship needs to change, shortlist two from Sisense, ThoughtSpot and Qlik Cloud Analytics, and price a proof of concept against your actual data volume, not a demo dataset. If you already run Microsoft or Google Cloud, start with Power BI, Tableau or Looker and treat the migration as an ecosystem consolidation, not just a tool swap. If engineering capacity is available and license cost matters more than a managed platform, pilot Metabase or Apache Superset directly before paying for anything. And if the real job was always narrower than Domo's full platform, a KPI dashboard, not a data warehouse, look at Klipfolio or Databox before signing anything bigger. Whichever path you take, get three numbers in writing before you commit: the actual unit cost at your real usage volume (not the list price), what happens to that cost if usage doubles within the contract term, and the year-two renewal number, since a consumption or capacity model can look cheap in year one and very different at true-up.
Camellia covers analytics, business intelligence and data tooling for B2B teams. Pricing in this guide was verified against vendor pricing pages in August 2026.

Principal Product Marketing Strategist
On this page
- Key Facts
- Quick Comparison Table
- Pricing Models: Per Seat vs Capacity vs Consumption vs Flat Fee
- Why Teams Leave Domo
- The Seven Paths Out of a Domo Evaluation
- 1. Microsoft Power BI: The Default When You're Already on Microsoft 365
- 2. Tableau: The Deepest Visual Analytics Craft
- 3. Qlik Cloud Analytics: Associative Exploration, Capacity Priced
- 4. Sisense: Built for Embedding, Not Just Internal Dashboards
- 5. ThoughtSpot: Conversational Search Over Governed Data
- 6. Sigma Computing: The Warehouse as the Interface
- 7. Looker (Google Cloud): One Governed Semantic Layer, Quote Only
- 8. Metabase: The Genuinely Free Self-Hosted Option
- 9. Zoho Analytics: An Always-Free Plan With Room to Grow
- 10. Amazon QuickSight: Built for AWS-Native Teams
- 11. Klipfolio: Unlimited Users, Priced by Dashboard Count
- 12. Databox: One KPI View Pulled From Many Marketing and Sales Tools
- 13. Preset (Apache Superset): Open Source, Managed for You
- 14. Grafana: Live Operational Dashboards, Not Business Reporting
- Stage Fit Matrix
- Sizing and Persona Table
- Migration Considerations
- How to Choose: Decision Framework
- What to Do Next