Power BI vs Tableau: Which BI Platform Fits Your Team in 2026?
Turn this article into takeaways for your work.


Each assistant summarizes the article only for you and suggests best practices for your work.
Updated August 2026
If you're an analytics lead, a CIO, or the RevOps or finance leader picking the BI platform your company will standardize on, Power BI and Tableau are probably your final two. Both are named Leaders in Gartner's 2026 Magic Quadrant for Analytics and BI Platforms, both pass procurement review, and "which one is more powerful" stopped being useful years ago. The decision comes down to what's on your desktop, how finance likes to model numbers, and what you'll pay once you count Explorers and Viewers, not just the analysts building dashboards.
This comparison is built for that decision, not a feature race. We'll walk through what each platform costs at 25, 50, and 100 users with a realistic role mix, what DAX and Power Query M feel like next to VizQL, calculated fields, and LOD expressions, and where Copilot and Tableau's Agent and Pulse stack actually stand in 2026. We're also hand checking the two numbers most comparison articles get wrong: Power BI Pro's real price, and which operating systems each desktop app runs on. Neither platform wins outright. The right one depends on whether your company already lives in Excel and Microsoft 365, or whether visual exploration and a Salesforce-native data layer matter more.
TL;DR
| Power BI | Tableau | |
|---|---|---|
| Best for | Teams standardized on Microsoft 365, Excel, and Azure | Teams prioritizing visual exploration, often alongside Salesforce |
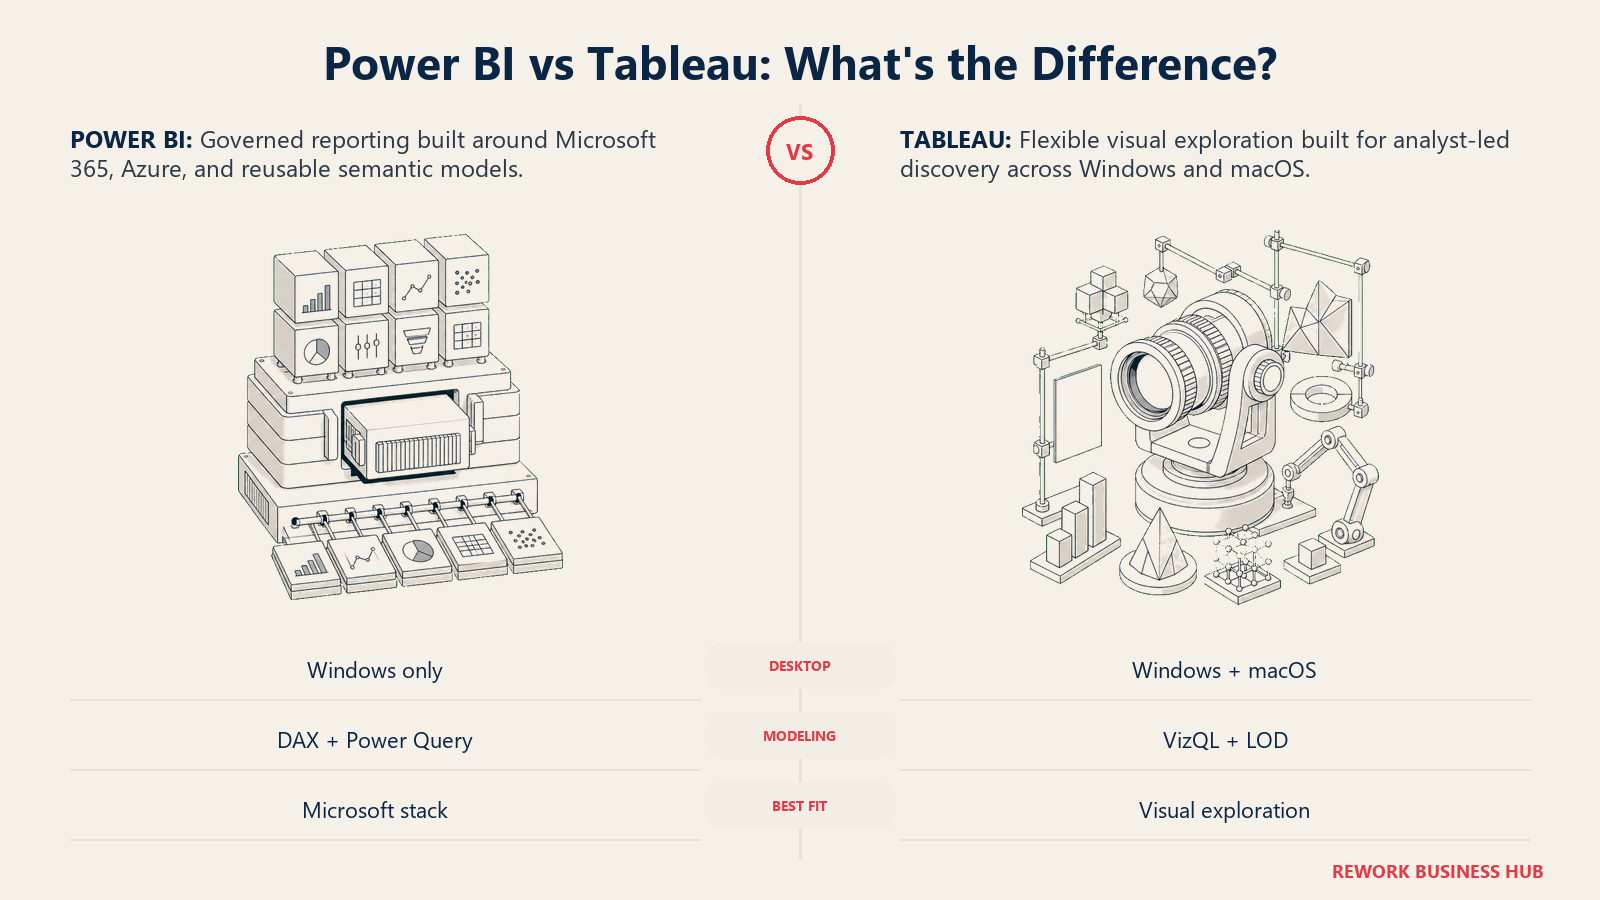
| Desktop OS | Windows only | Windows and macOS, native Apple Silicon since 2024.2 |
| Entry paid tier | Pro, $14.00/user/month, paid yearly | Viewer, $15/user/month, paid yearly (Cloud Standard) |
| Full-authoring tier | Premium Per User, $24.00/user/month, paid yearly | Creator, $75/user/month, paid yearly (Standard) |
| Free tier | Yes, but can't share or publish content | No permanent team tier, only a 14-day trial and public-only Tableau Public |
| Calculation model | DAX for measures, Power Query M for transforms | VizQL under the hood; calculated fields and LOD expressions |
| AI assistant | Copilot, needs a paid Fabric F2+ or Power BI Premium P1+ capacity (a Pro or PPU licence alone is not enough) | Tableau Agent plus full Pulse, needs the separately quoted Tableau+ bundle |
| Governance stack | Microsoft Purview, tenant admin portal, Fabric domains | Site roles, project permission templates, Data Management add-on |
| 2026 Gartner Magic Quadrant | Leader, 19th consecutive year | Leader, 14th consecutive time |
Key Facts
- Gartner named Microsoft a Leader in the 2026 Magic Quadrant for Analytics and Business Intelligence Platforms for the 19th consecutive year, and Salesforce Tableau a Leader for the 14th consecutive time, in the same report published June 29, 2026 (Microsoft Fabric Community, Salesforce).
- Power BI Pro rose from $10 to $14.00 per user/month, paid yearly, after Microsoft's April 2025 price increase; Premium Per User costs $24.00 per user/month, paid yearly (microsoft.com).
- Tableau Cloud's Standard edition prices Creator at $75, Explorer at $42, and Viewer at $15, all per user per month, billed annually (tableau.com/pricing).
- Power BI has 30 million monthly active users across more than 375,000 organizations, per Microsoft's own recap of the platform's first decade (Power BI blog).
- BARC's BI & Analytics Survey found that almost 30% of surveyed companies currently run Power BI in production and almost 60% have evaluated it, the widest evaluation footprint BARC tracks in the category (BARC).
Who Each Platform Is Really For
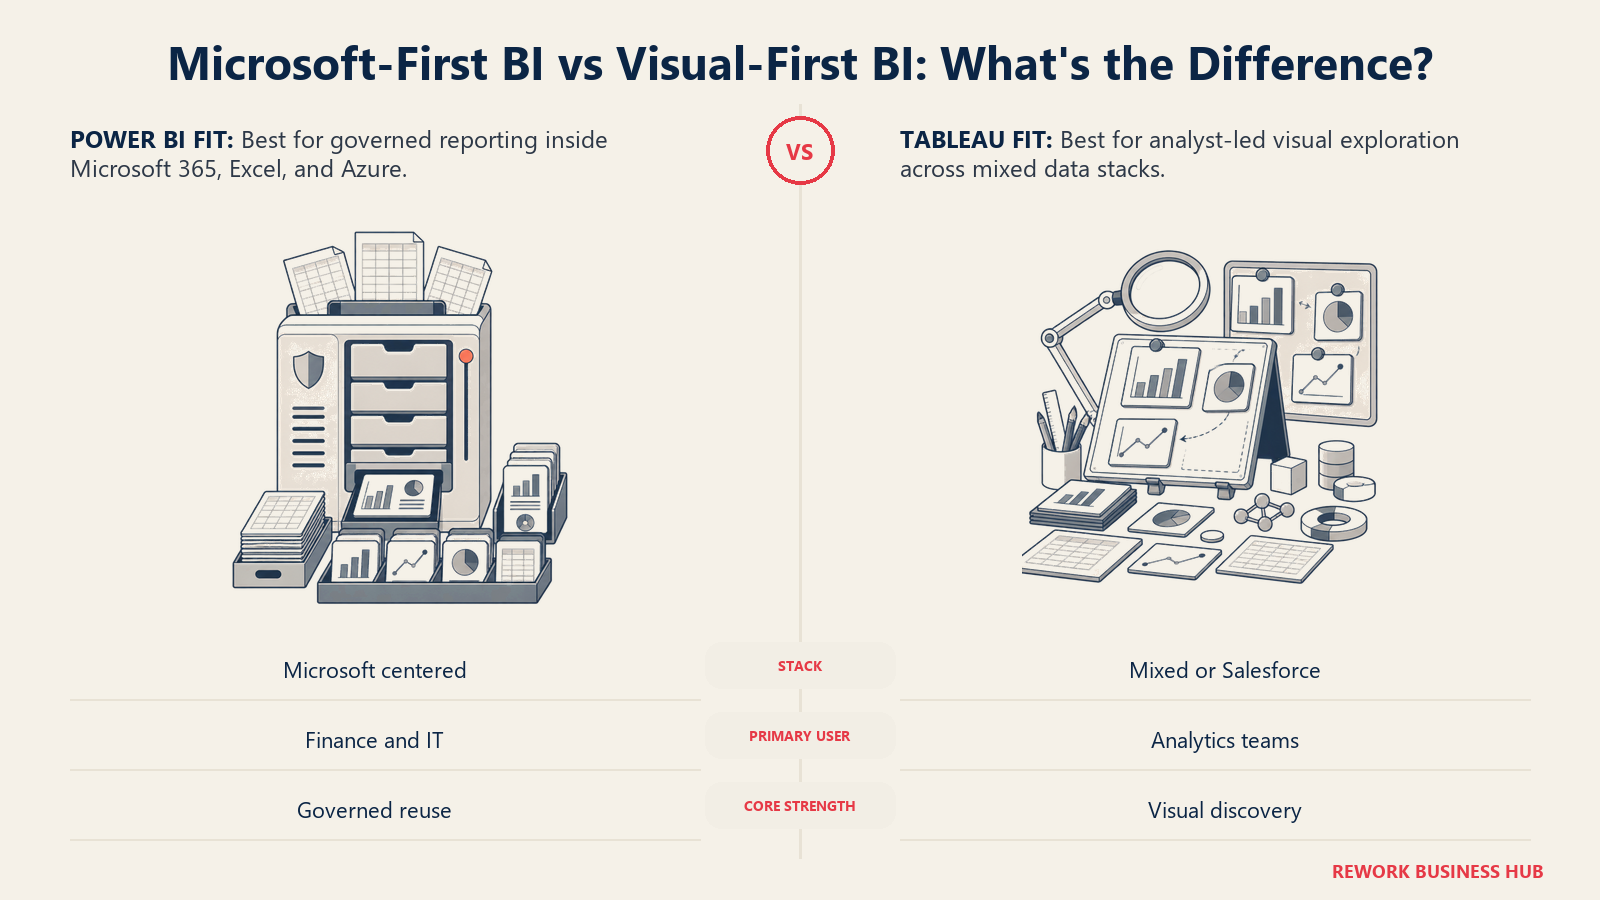
Both vendors sell to companies that need a governed, company-wide reporting standard, but the buyer who gets the most value looks different once you get past the pitch. Power BI's natural buyer already runs on Microsoft 365, Excel, and Azure, and wants BI to feel like an extension of tools people already use. Tableau's natural buyer cares most about visual exploration and often already has Salesforce as system of record, or a genuinely mixed data stack.
| Power BI | Tableau | |
|---|---|---|
| Primary buyer | IT and data teams inside the Microsoft 365 and Azure stack | Data and analytics teams prioritizing visual exploration |
| Company already runs on | Excel-heavy finance and ops, Teams, SharePoint, Azure | A mixed-vendor stack, Salesforce CRM, or a dedicated analytics function |
| Where it's strongest | An IT-governed reporting standard, pricing scales cleanly for casual users | Deep visual and statistical exploration, ad hoc analysis |
| Finance and FP&A fit | Strong: DAX carries Excel intuition, PivotTable analysts ramp fast | Adequate: possible, but the tool is visualization-first |
| Sales and RevOps fit | Strong with Dynamics 365; native embedding into Teams and Power Apps | Strong where Salesforce is system of record, via native RevOps use through Agentforce |
| Product and data science fit | Adequate; Python/R visuals work, Fabric notebooks are the deeper investment | Strong; a long history inside advanced-analytics teams |
| Executive and board fit | Adequate; Org apps and paginated reports cover print-style output | Strong; Pulse's newsfeed-style metric delivery is built for this audience |
| Buying trigger | "One governed standard, and we already pay for Microsoft 365" | "Analysts need to explore visually, and we run Salesforce or a varied stack" |
Neither profile is more sophisticated. A finance team that lives in Excel ramps up faster on DAX. A company where Salesforce already owns the customer data model loses something real by standardizing on a tool with no native path into that data.
Licensing: Pro, Premium Per User, and Fabric Against Creator, Explorer, Viewer
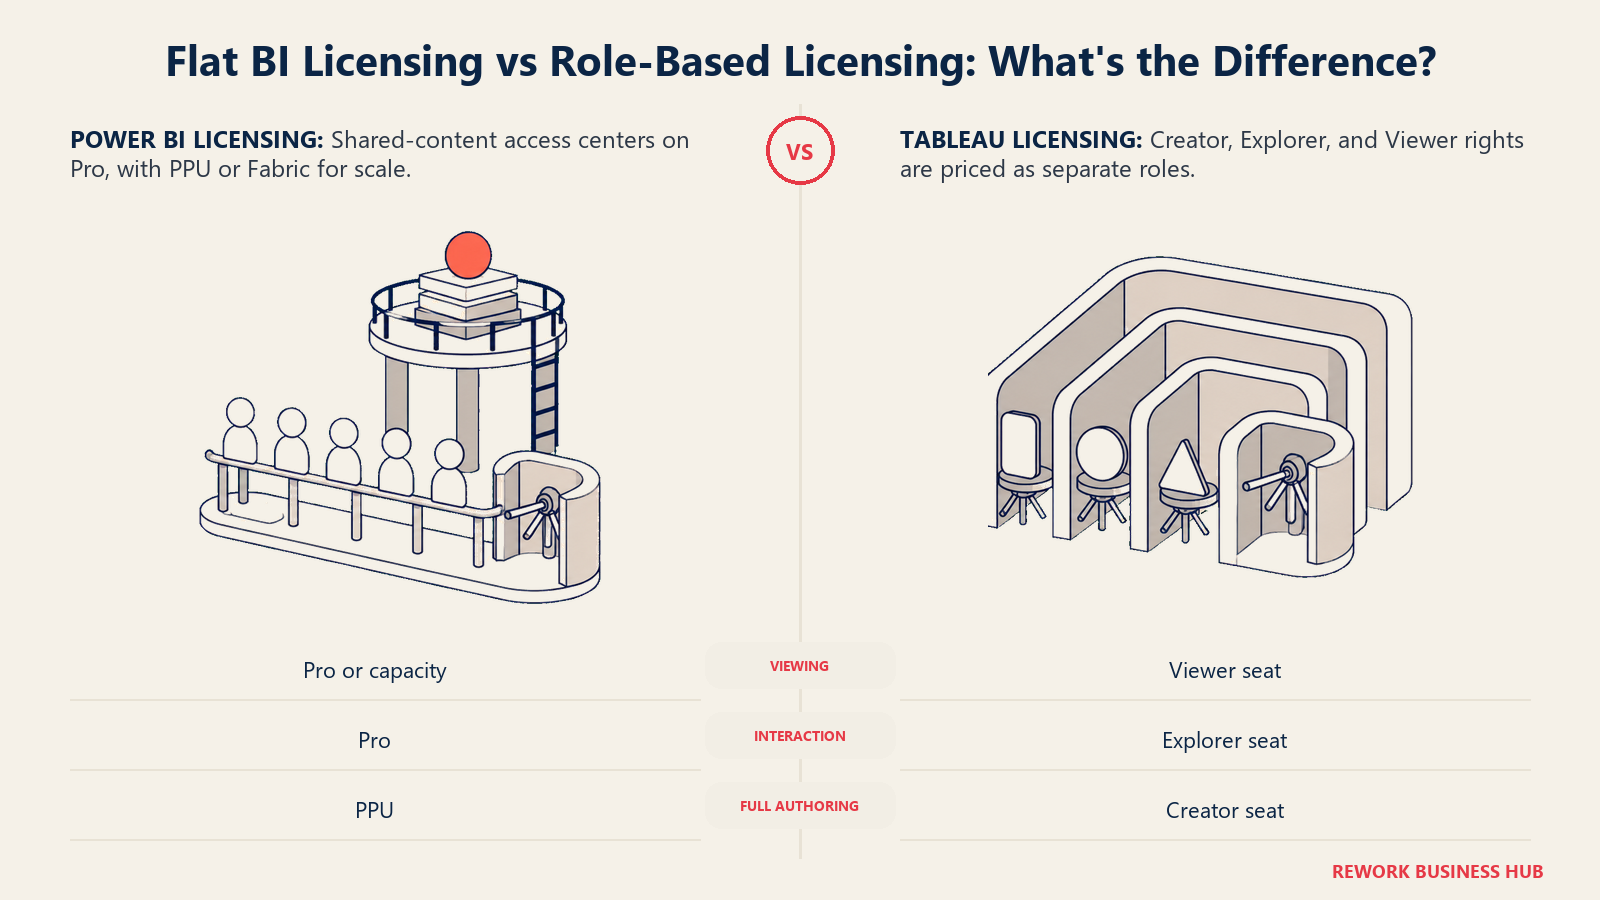
This is the structural difference driving almost everything else in this comparison. Power BI licenses by what a person is allowed to do overall (view your own work for free, publish and collaborate on Pro, or unlock enterprise-scale models on Premium Per User), with an org-wide Fabric capacity option layered on top. Tableau licenses by role instead: Viewer, Explorer, and Creator are three separate, named tiers with different prices and rights, so a person who only reads dashboards costs meaningfully less than one who builds them.
| Power BI | Tableau (Cloud, Standard edition) | |
|---|---|---|
| Entry tier | Free: $0, build/view your own reports, can't share | No internal equivalent; Tableau Public is free, public-data-only |
| Read-only / entry-paid tier | Pro covers anyone viewing shared content, $14.00/user/month paid yearly | Viewer: read-only, filter and drill into dashboards, $15/user/month paid yearly |
| Interact / customize tier | No separate tier; interacting also requires Pro | Explorer: edit workbooks, build from published sources, no new connections, $42/user/month paid yearly |
| Full authoring / enterprise tier | Premium Per User: 100GB models (vs. 1GB Pro), 48 refreshes/day (vs. 8), paginated reports, deployment pipelines, $24.00/user/month paid yearly | Creator: full authoring, new connections, calculated fields, LOD expressions, publishing, $75/user/month paid yearly |
| Org-wide capacity option | Fabric capacity (F-SKUs): pay-as-you-go per capacity-unit hour, or a reservation saving about 41%; lets Free-license viewers into a capacity-backed workspace | No equivalent; every Viewer is billed per person, regardless of audience |
| Desktop app OS | Windows only | Windows and macOS, native Apple Silicon since 2024.2 |
| What gates the next tier up | Sharing and collaboration rights, not role | What a person can build, not just view |
| Enterprise-only pricing | Not applicable; one per-user-plus-capacity model | Enterprise costs more (Creator $115/user/month); this article quotes Standard only since Enterprise's Explorer/Viewer figures are inconsistent across Tableau's own pages |
Check two things by hand before budgeting around either number. Power BI Pro is not $10 anymore, Microsoft raised it to $14.00/user/month, paid yearly, in April 2025, and plenty of comparison articles still quote the old figure. And Power BI Desktop genuinely doesn't run natively on a Mac, no roadmap for one, so an Apple-hardware team needs a cloud VM, Parallels, or the browser-based service to author reports, while Tableau Desktop ships a fully native macOS build, Apple Silicon included, since release 2024.2.
Real Cost at 25, 50, and 100 Users
Vendor pricing pages give you a per-seat number, not what your team costs. So we built three seat-mix scenarios using role definitions that map onto both platforms: Creators build models from scratch and need the top tier; Explorers are self-service analysts who interact with and customize existing content but rarely start from a blank connection; Viewers only consume finished dashboards. On Power BI, with no dedicated "interact but don't build" tier, Explorers and Viewers both land on Pro, and only Creators needing enterprise-scale models move to Premium Per User. On Tableau, all three map to their own named tier. These numbers assume straight per-user licensing with no Fabric capacity purchase, the realistic starting point before a capacity SKU pencils out.
25 Users
| Role | Count | Power BI tier | Annual cost | Tableau tier | Annual cost |
|---|---|---|---|---|---|
| Creators | 5 | Premium Per User, $288/yr | $1,440 | Creator, $900/yr | $4,500 |
| Explorers | 8 | Pro, $168/yr | $1,344 | Explorer, $504/yr | $4,032 |
| Viewers | 12 | Pro, $168/yr | $2,016 | Viewer, $180/yr | $2,160 |
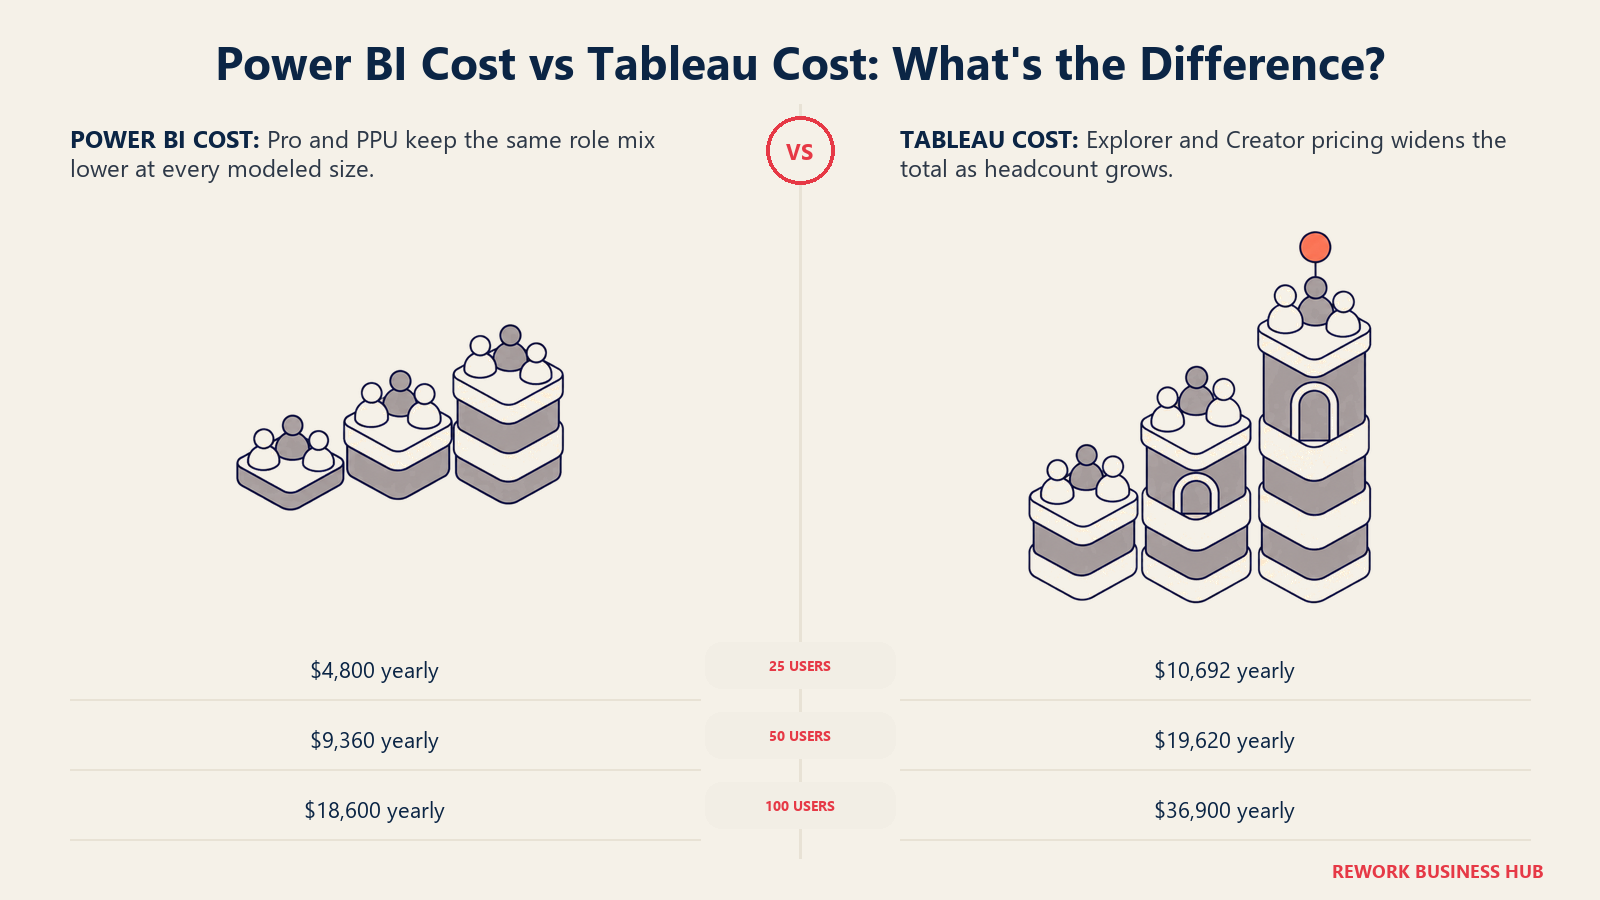
| Total (25 users) | 25 | $4,800/year | $10,692/year |
50 Users
| Role | Count | Power BI tier | Annual cost | Tableau tier | Annual cost |
|---|---|---|---|---|---|
| Creators | 8 | Premium Per User, $288/yr | $2,304 | Creator, $900/yr | $7,200 |
| Explorers | 15 | Pro, $168/yr | $2,520 | Explorer, $504/yr | $7,560 |
| Viewers | 27 | Pro, $168/yr | $4,536 | Viewer, $180/yr | $4,860 |
| Total (50 users) | 50 | $9,360/year | $19,620/year |
100 Users
| Role | Count | Power BI tier | Annual cost | Tableau tier | Annual cost |
|---|---|---|---|---|---|
| Creators | 15 | Premium Per User, $288/yr | $4,320 | Creator, $900/yr | $13,500 |
| Explorers | 25 | Pro, $168/yr | $4,200 | Explorer, $504/yr | $12,600 |
| Viewers | 60 | Pro, $168/yr | $10,080 | Viewer, $180/yr | $10,800 |
| Total (100 users) | 100 | $18,600/year | $36,900/year |
The gap widens with scale mostly because Tableau prices interaction, not just viewing. Its Explorer tier ($42/month) costs three times Power BI's Pro tier ($14/month) for a comparable user, and Power BI has no separate, pricier tier for people who touch content without building it, everyone above Free just needs Pro. Power BI's $14 Pro tier already undercuts Tableau's $15 Viewer-only tier per person, so the gap rarely closes in Tableau's favor on raw dollars. What Tableau's Viewer buys instead is a cleaner audit story: it's contractually locked out of editing, whereas a Pro license technically carries edit rights your admin restricts at the workspace level. For a large, read-only audience (a board, an all-hands dashboard), a Fabric capacity reservation shifts this further in Power BI's favor, since capacity-backed workspaces let viewers use free licenses instead of paying per-person Pro. Microsoft doesn't publish a flat F-SKU figure since capacity runs through a regional calculator, but reservations save about 41% over pay-as-you-go. Tableau has no equivalent; every Viewer, at any audience size, is $15 per person, per month.
Data Modeling and Calculation Languages: DAX and Power Query M vs VizQL
Power BI splits data work into two languages. Power Query M handles get-and-transform work, cleaning, joining, and reshaping data before it loads into the model. DAX (Data Analysis Expressions) handles everything after: measures, calculated columns, KPIs. DAX borrows Excel's formula syntax closely enough that power users recognize the shape immediately, but it introduces row context and filter context, concepts with no real Excel equivalent, and that's usually where the learning curve bites.
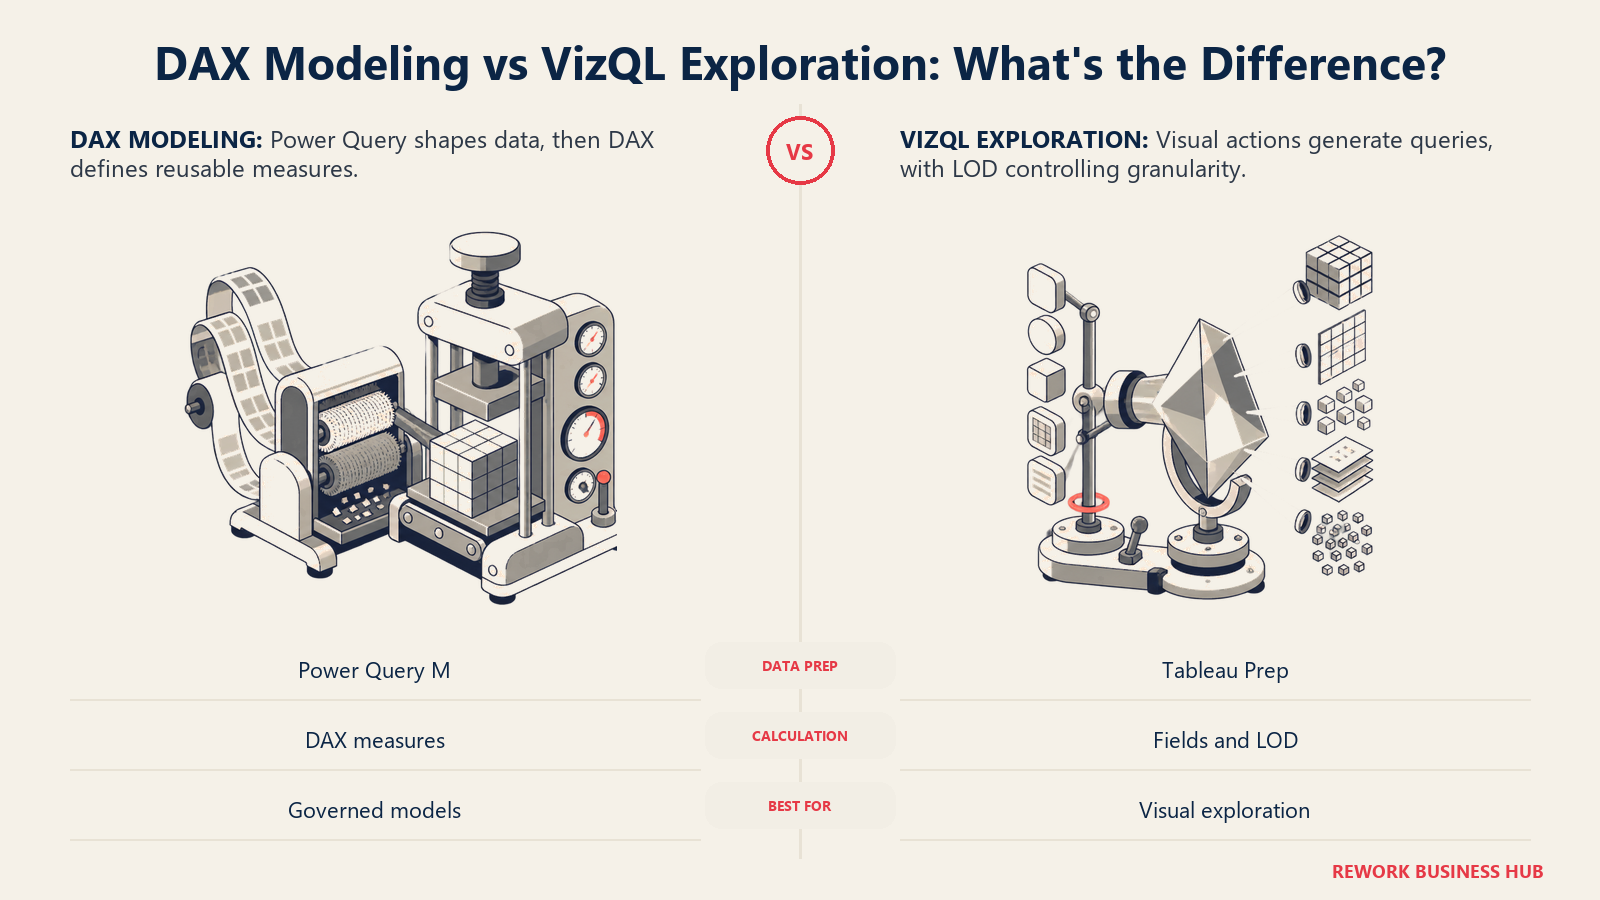
Tableau's model works differently underneath. VizQL is the query engine translating drag-and-drop actions into optimized queries against your source, so most everyday chart-building never requires a formula at all. For custom logic, Tableau exposes calculated fields, using Excel-like formula syntax for row and aggregate math, and LOD (Level of Detail) expressions (FIXED, INCLUDE, EXCLUDE), to control exactly what granularity a calculation runs at, independent of what's on the visual.
| Power BI | Tableau | |
|---|---|---|
| Data shaping and ETL | Power Query M | Tableau Prep (separate product), plus native joins/unions |
| Calculation language | DAX (Data Analysis Expressions) | Calculated fields, plus LOD expressions (FIXED, INCLUDE, EXCLUDE) |
| Underlying query engine | VertiPaq columnar engine (Import mode), or DirectQuery pass-through | VizQL, translates visual actions directly into queries |
| Learning curve for Excel-fluent analysts | Familiar syntax, but row/filter context is a genuinely new concept | Calculated fields feel Excel-like; LOD expressions are their own concept |
| Best for | Reusable, governed semantic models shared across reports | Exploratory analysis where the model builds itself as you drag fields |
| Where the steeper investment sits | DAX, past a simple sum or average, filter context especially | LOD expressions, for a different granularity than the visual |
Data Connectivity and Refresh
Both platforms cover hundreds of native connectors, and neither is meaningfully behind on raw count. Where they diverge is depth in their home ecosystem and how the engines pull and refresh data.
| Power BI | Tableau | |
|---|---|---|
| Native connectors | Hundreds, deepest for Microsoft, Azure, and Dynamics 365 | Hundreds, broad third-party and legacy database coverage |
| In-memory engine | VertiPaq (Import mode) | Hyper (extracts) |
| Live query mode | DirectQuery, or Composite models mixing Import and DirectQuery | Live connection, queried on each interaction |
| On-prem-to-cloud bridge | On-premises data gateway | Tableau Bridge |
| Refresh frequency (per license) | Pro: up to 8/day; Premium Per User: up to 48/day | Set at the site and Creator level, not gated by Viewer or Explorer |
| Where it's deepest | Microsoft 365, Dynamics 365, and the Azure data estate | Salesforce and Data Cloud, plus a long-standing legacy-database catalog |
Visualization Depth and Design Control
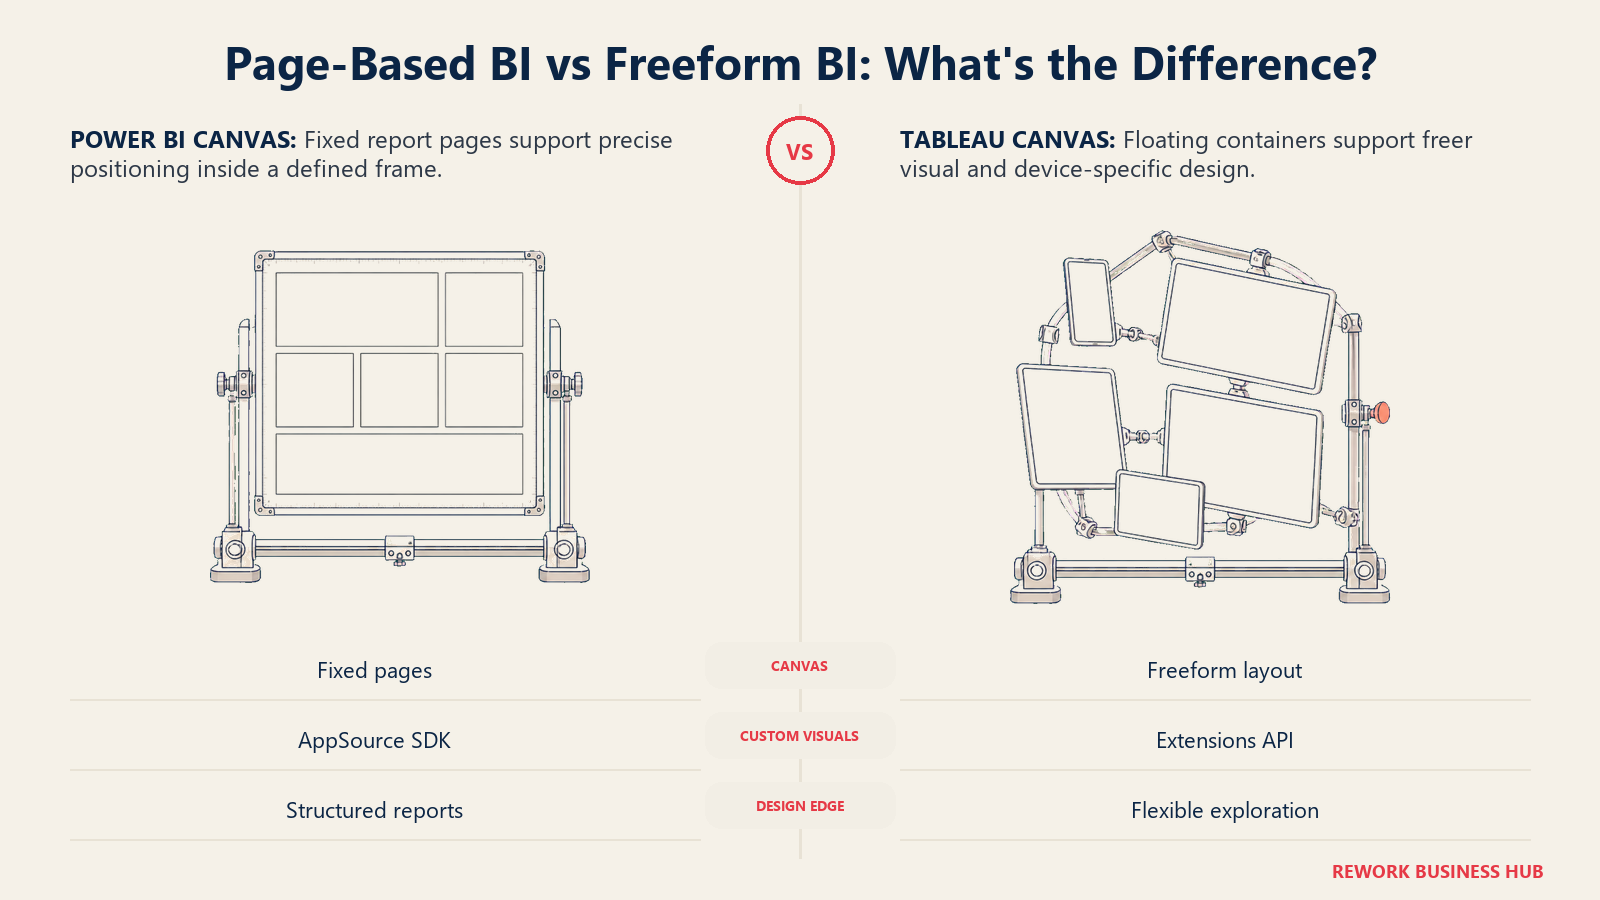
Tableau is still generally regarded as the more design-flexible tool for pixel-level control and freeform layout, a reputation that predates Power BI. Power BI has closed a real amount of that gap with a growing native chart library and an AppSource marketplace of custom visuals, but the remaining polish gap comes down to design discipline as much as raw capability. Whichever you pick, our dashboard design guide applies either way: the tool doesn't save a dashboard with the wrong information architecture.
| Power BI | Tableau | |
|---|---|---|
| Canvas model | Fixed-size report pages, pixel-level positioning | Freeform floating layout, containers, device-specific dashboards |
| Chart library | Native chart set plus the AppSource marketplace | Native chart set plus an extension gallery |
| Pixel-level formatting control | Improved in recent releases, still page-bound | A long-standing strength, often cited as more design-flexible |
| Mobile-optimized layouts | Power BI Mobile app, mobile-specific report layout | Device Designer for phone, tablet, and desktop layouts |
| Custom visual development | Power BI visuals SDK (TypeScript) | Tableau Extensions API |
Governance and Administration
Both platforms are built for a central IT or governance function to run, not to spread organically, but the admin surfaces sit in different ecosystems.
| Power BI | Tableau | |
|---|---|---|
| Admin surface | Tenant-level Power BI and Fabric admin portal | Site admin console per Cloud site, or Server |
| Sensitive-data controls | Microsoft Purview sensitivity labels and DLP policies | Data Management add-on: lineage, migration, certified sources |
| Workspace or project permission model | Workspace roles: Viewer, Contributor, Member, Admin | Project-level permission templates, lockable or customizable |
| Data lineage and cataloging | Fabric OneLake catalog, integrated with Purview | Tableau Catalog, part of the Data Management add-on |
| Large-org data mesh pattern | Fabric domains | Multiple Cloud sites, or separate Server instances |
Embedded and External Sharing
If part of the decision is customer-facing embedded analytics, not just internal dashboards, both platforms support it, under different pricing assumptions.
| Power BI | Tableau | |
|---|---|---|
| Customer-facing embedding | Power BI Embedded, capacity-priced, contact sales | Embedding API v3, licensed by consumption or agreement |
| Public, unauthenticated sharing | Publish to web, a public link, no login | Tableau Public, free, public workbooks only |
| Curated internal distribution | Org apps, GA rolling out through 2026 | Tableau Cloud sites, project-level curated views |
| Typical buyer for the embedded use case | ISVs already on Azure | ISVs already on Salesforce or Data Cloud |
Ecosystem and Hiring Pool
The talent pool is a real cost, even off the pricing page: it shapes how fast you can staff a rollout and backfill a departure.
| Power BI | Tableau | |
|---|---|---|
| Certification track | Microsoft PL-300, Power BI Data Analyst Associate | Tableau Desktop Specialist, Certified Data Analyst, Certified Consultant |
| Talent pool breadth | Very broad, overlapping with the Excel and Microsoft 365 user base | Broad, more concentrated in dedicated analytics and BI roles |
| Community and forums | Microsoft Fabric Community, high volume given the install base | Tableau Community forums, plus a long-running User Group network |
| Often already bundled into | Microsoft 365 E5 | Standalone purchase, though bundled into some Salesforce deals via Tableau+ |
| Where hiring tends to be easier | Business analysts and finance staff already fluent in Excel | Dedicated data analysts and BI specialists with visualization training |
For a broader view of the toolchain a modern analytics function needs beyond BI licensing, see our data analyst tools and tech stack guide.
AI Features in 2026: Copilot vs Tableau Agent and Pulse
Both vendors have shipped real, generally available AI features by 2026, not demo-ware, but both gate the most useful capability behind a purchase a plain entry-tier license doesn't include, the second pricing trap in this category after the Power BI Pro number.
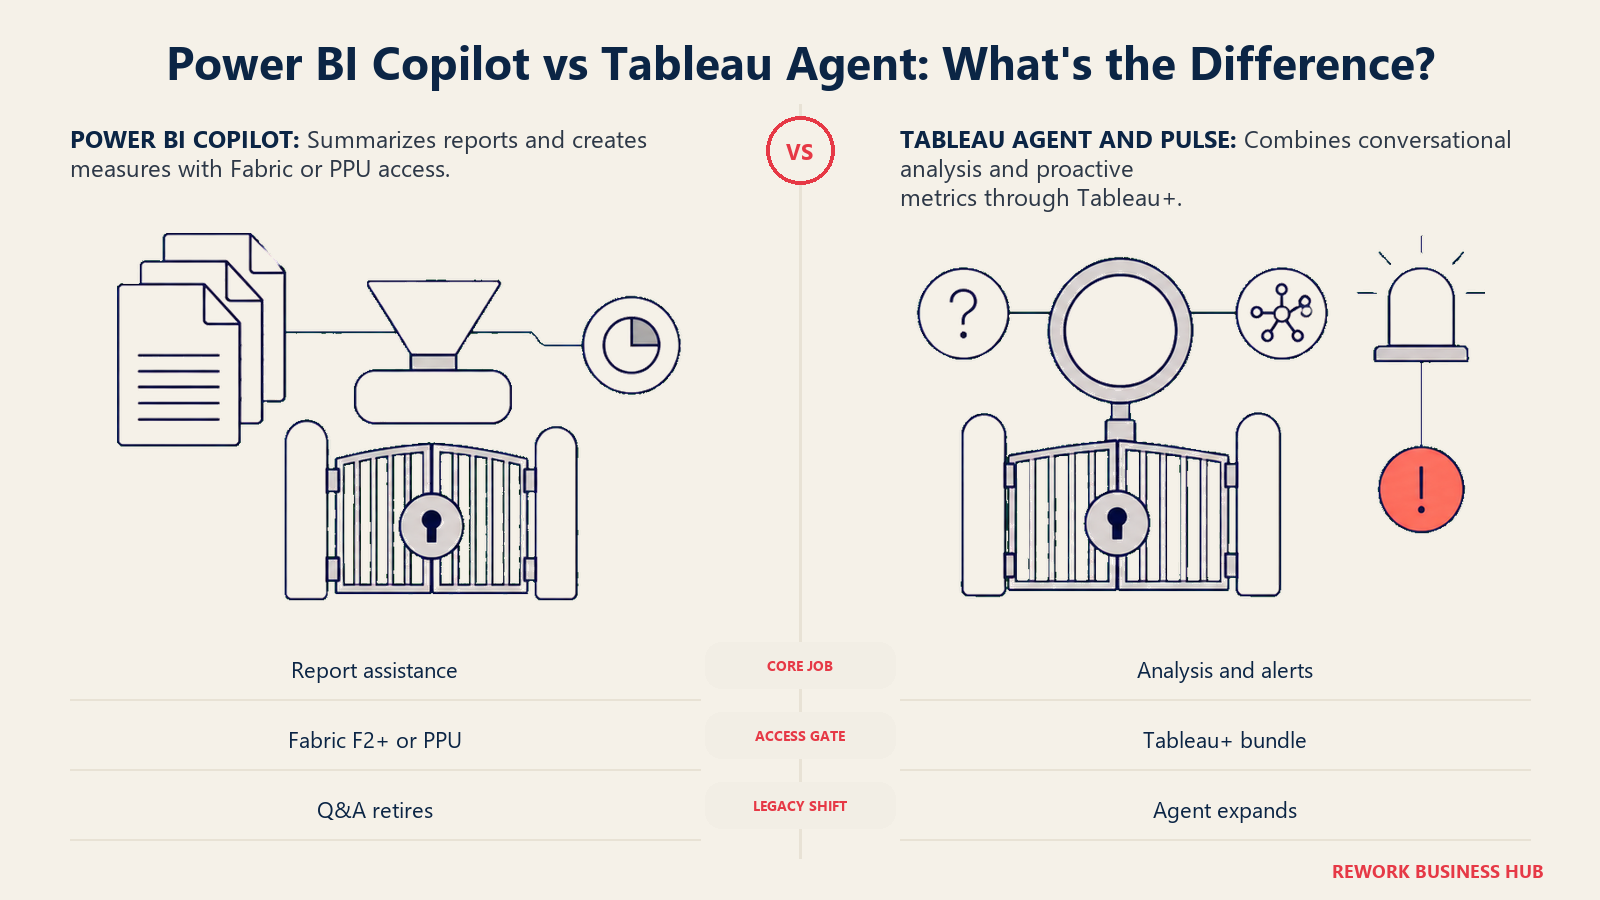
On the Microsoft side, Power BI's Copilot chat pane reached general availability, letting you ask questions about a report, request page summaries, and generate DAX measures in plain language. But Copilot itself requires a paid Fabric capacity at F2 or higher, or Power BI Premium at P1 or higher. Microsoft states plainly that a Power BI Pro or Premium Per User licence alone is not sufficient, so neither a $14 Pro seat nor a $24 PPU seat unlocks it on its own. Microsoft is also retiring the older Power BI Q&A feature in December 2026, pushing everyone toward Copilot.
On the Tableau side, Tableau Pulse delivers a proactive, newsfeed-style feed of personalized metrics and anomaly explanations, and Tableau Agent (renamed from "Agentforce for Analytics" in July 2026) lets non-technical users ask natural-language questions and build calculations conversationally, both built on Salesforce's Einstein Trust Layer and Agentforce. The catch mirrors Power BI's: full Tableau Agent access and premium Pulse features require the separately, custom-quoted Tableau+ bundle, not standard licensing.
| Power BI / Fabric | Tableau | |
|---|---|---|
| Core AI product | Copilot: chat pane, report summarization, DAX/measure generation | Tableau Agent: conversational analysis, plus Pulse: proactive metric newsfeed |
| What license actually unlocks it | Fabric F2+ capacity or Premium Per User; not on plain Pro | The Tableau+ bundle, separately custom quoted; not on Creator, Explorer, or Viewer |
| Underlying model layer | Microsoft's Copilot stack inside Fabric | Salesforce Einstein Trust Layer and Agentforce |
| Anomaly detection | Via Copilot-assisted insights inside Fabric | Native to Pulse, described by Salesforce as "agentic analytics" |
| Legacy natural-language feature | Power BI Q&A, being retired in December 2026 | Not applicable |
| 2026 status | Copilot chat pane reached general availability | Renamed from "Agentforce for Analytics" in July 2026, rolling out inside Tableau Next |
If board-level reporting and proactive anomaly alerts are the actual driver, read that decision against our board-ready revenue reporting guide before assuming either AI layer covers it out of the box.
Implementation and Time to Value
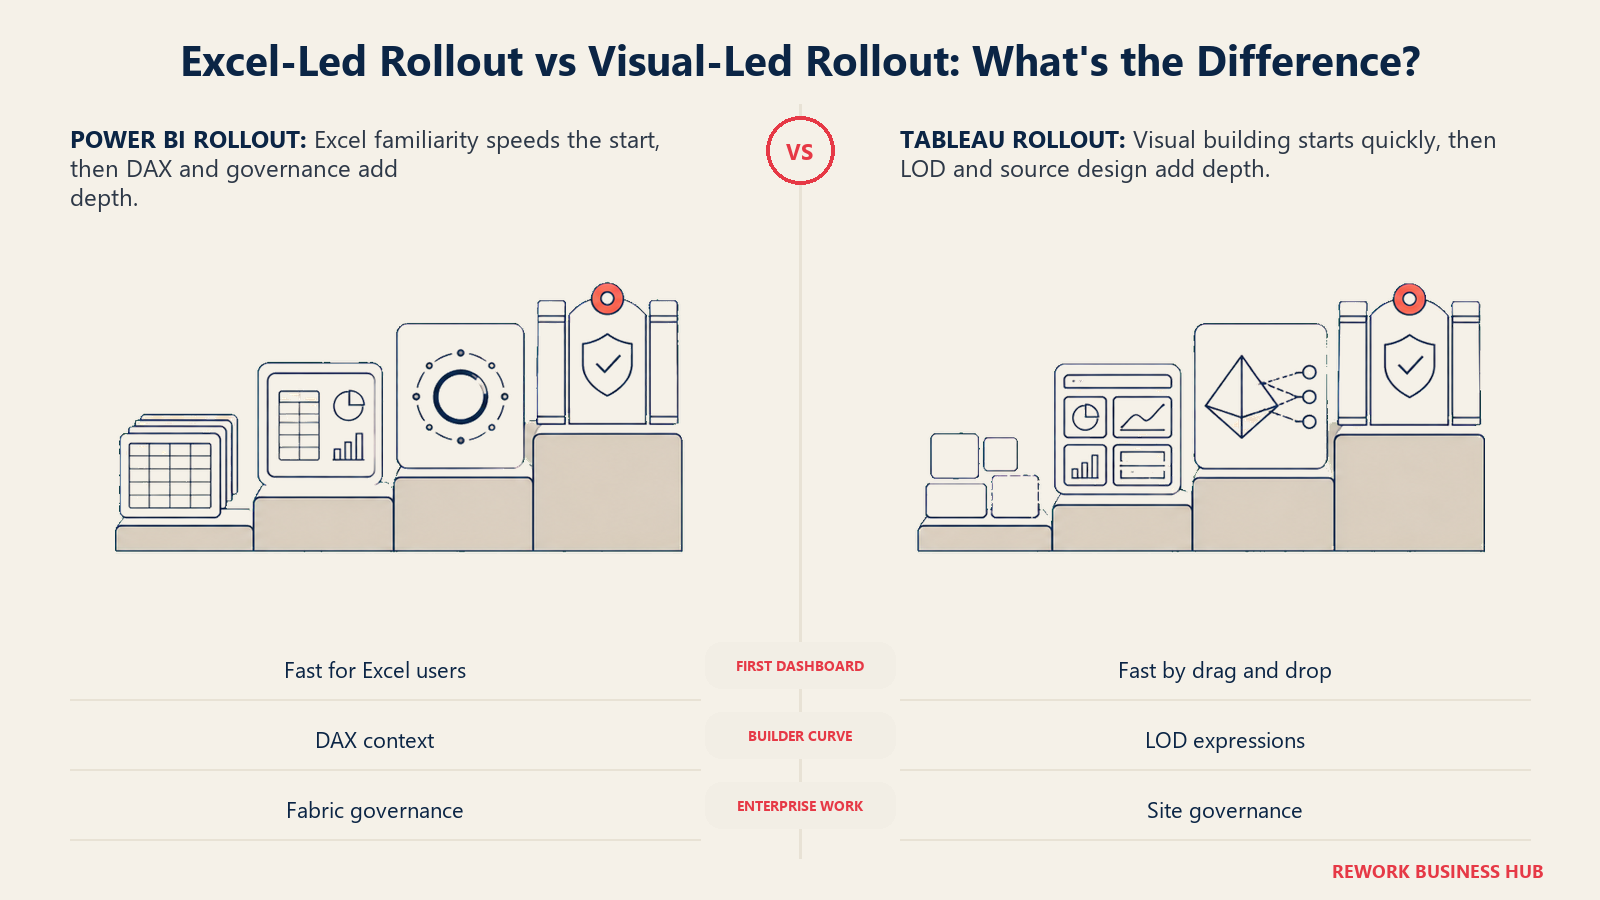
Both platforms are fast for an individual analyst's first dashboard, and slower once governance and certified sources enter the picture.
| Power BI | Tableau | |
|---|---|---|
| Time to a first dashboard | Fast; the PivotTable mental model carries over for Excel-fluent analysts | Fast; drag-and-drop building, no formula required for basic charts |
| Enterprise rollout (governance) | Weeks to months, depending on Fabric domain and sensitivity-label design | Weeks to months, depending on Data Management add-on and source design |
| Training load, read-only Viewer | Minimal, browser or mobile app consumption | Minimal, browser or mobile app consumption |
| Training load, Creator/PPU builder | DAX has a real learning curve past basic sums and averages | LOD expressions have a real learning curve past basic calculated fields |
| Migration friction from spreadsheets | Low; DAX and Power Query echo existing Excel muscle memory | Moderate; VizQL's drag-and-drop is a bigger shift from spreadsheet formulas |
When Power BI Is the Right Call
- Your company already runs on Microsoft 365, Excel, and Azure. DAX and Power Query build on skills finance and ops already have, and licensing often overlaps with an existing E5 agreement.
- You need a governed, company-wide standard without a per-role pricing penalty. Pro at $14/month covers anyone viewing or interacting with shared content, no pricier tier just for interaction.
- You have a large, mostly read-only audience. A Fabric capacity reservation lets viewers consume dashboards on free licenses, a mechanism Tableau has no equivalent for.
- You're building customer-facing analytics on Azure. Power BI Embedded plugs directly into an existing Azure-based ISV architecture.
When Tableau Is the Right Call
- Visual exploration and design quality are the priority, not just reporting. Tableau's pixel-level layout control and freeform canvas remain a genuine strength, and it shows in how analysts explore data.
- Salesforce is already your system of record. Tableau Next's native integration with Data Cloud and Agentforce gives it a data-proximity advantage for Salesforce-centric teams.
- You want cleaner role-based audit boundaries. A Viewer license is contractually locked out of editing, which some governance teams prefer over Power BI's workspace-level restrictions on an edit-capable Pro license.
- Your team works on Mac hardware. Tableau Desktop's native macOS build, Apple Silicon included, avoids the VM or Parallels workaround Power BI Desktop needs.
Decision Framework
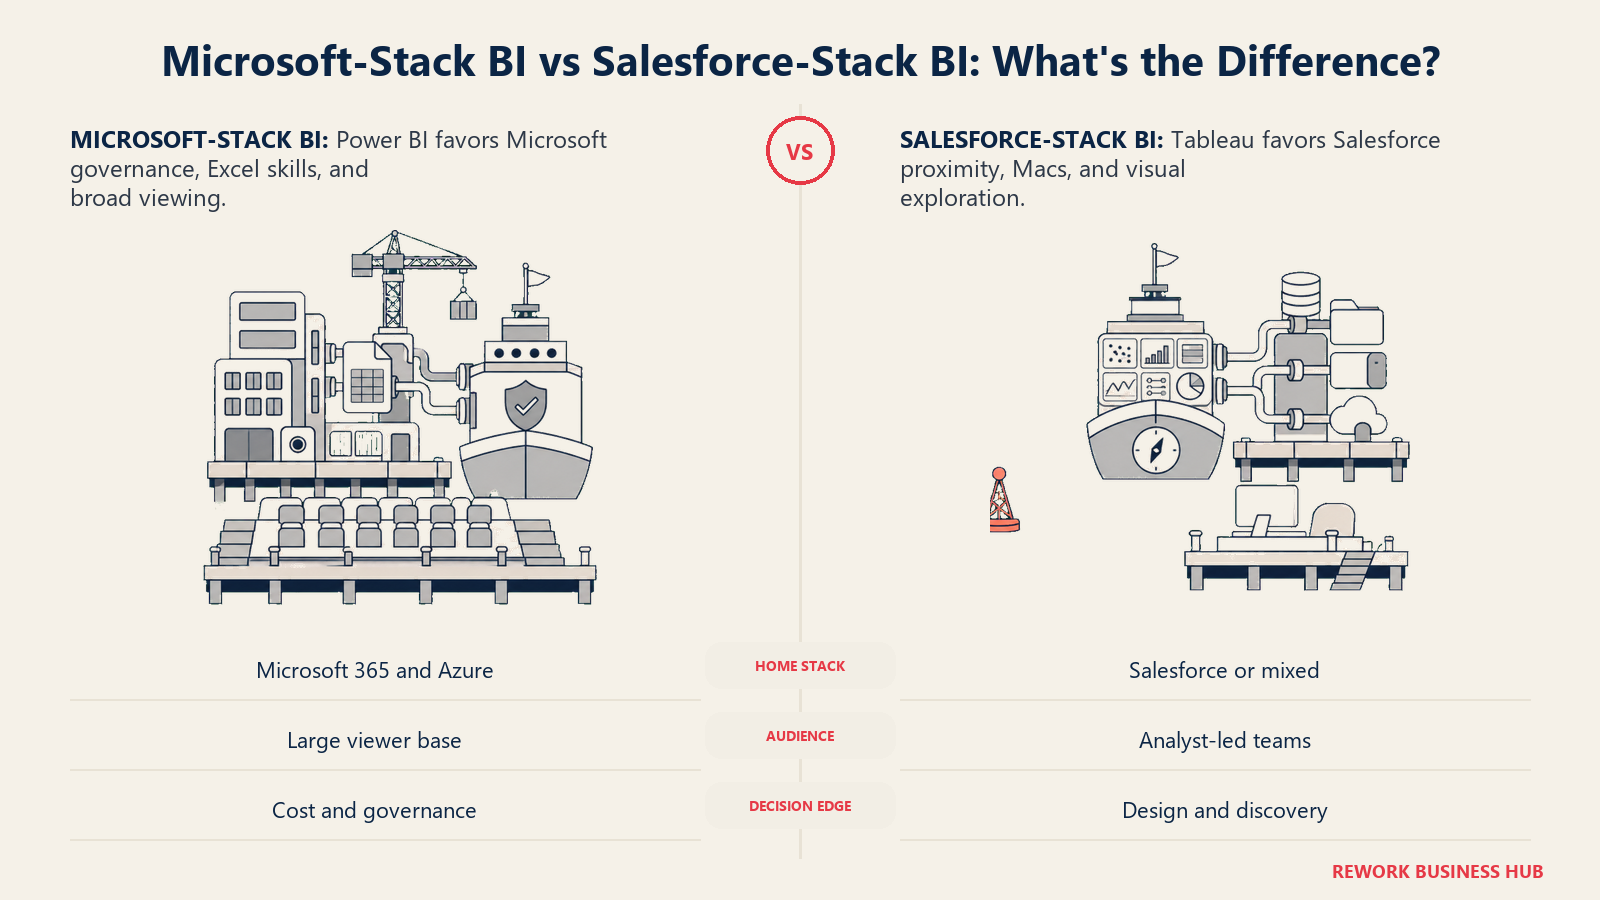
Use the signals below to match the platform to your existing stack, audience, design priorities, and licensing model.
| If this is true for you | Pick |
|---|---|
| Standardized on Microsoft 365, Excel, and Azure | Power BI |
| Want one flat per-user rate for anyone who views or interacts with content | Power BI |
| Salesforce is your system of record, want native Data Cloud integration | Tableau |
| Design flexibility and freeform layout matter more than governed reuse | Tableau |
| Analysts and designers work on Mac hardware | Tableau |
| Very large, mostly read-only internal audience | Power BI, via Fabric capacity |
| Want AI features at the entry tier, not gated behind a capacity/bundle purchase | Neither, budget for Fabric/PPU or Tableau+ regardless |
| Budget rules the decision and a free tool might be enough | See Power BI vs Looker Studio |
| Your real requirement is one governed metric definition, not a prettier chart | See Tableau vs Looker |
| Need a broader shortlist, not just these two | See our best BI tools for 2026 |
What to Do Next
- Map your real role mix, not just headcount. Count who builds models from scratch, who interacts with existing content, and who only views dashboards, then run both platforms' math against your own numbers using the tables above as a template.
- Confirm what you already own. If you pay for Microsoft 365 E5, check whether Power BI Pro is already included. If you're deep in a Salesforce contract, ask your account team what Tableau+ costs bundled versus standalone.
- Decide whether AI access is a launch requirement or phase two. Neither Copilot nor Tableau Agent ships free with an entry-tier license; budget for a paid Fabric or Premium capacity, or for Tableau+, separately.
- Test the calculation language with your team first. Build one real report in DAX and one in Tableau's calculated fields and LOD expressions, using your actual data. The gap shows up faster in practice than in any article.
- If neither platform is a clean fit, our best Power BI alternatives and best Tableau alternatives roundups cover the field. If what you actually need is one governed metric definition shared across both tools, the best Looker alternatives roundup covers the semantic-layer end of the category. Our best FP&A software guide and best CRM software guide are worth a look if the real gap sits upstream of BI.
Frequently Asked Questions about Power BI vs Tableau
Is Power BI Pro still $10 a month?
No. Microsoft raised Power BI Pro to $14.00 per user, per month, paid yearly, in April 2025. Plenty of comparison content online still quotes the old $10 figure, so verify against Microsoft's own pricing page before budgeting.
How much does Tableau cost per user?
Tableau Cloud's Standard edition prices Creator at $75, Explorer at $42, and Viewer at $15, all per user per month, billed annually. Enterprise edition costs more (Creator $115/user/month), but its published Explorer/Viewer figures are inconsistent across Tableau's own pages, so this article quotes Standard only.
Can I run Power BI Desktop on a Mac?
No. Power BI Desktop is Windows-only, with no native macOS build and no announced plans for one. Tableau Desktop runs natively on both Windows and macOS, including Apple Silicon, since release 2024.2.
Do I need Fabric capacity to get Power BI Copilot?
Yes. Copilot requires a paid Fabric capacity at F2 or higher, or Power BI Premium at P1 or higher. Microsoft's documentation is explicit that a Power BI Pro or Premium Per User licence alone is not sufficient, so neither a $14 Pro seat nor a $24 PPU seat unlocks it.
Is Tableau Agent included in a standard Tableau license?
No. Full Tableau Agent access and premium Pulse features require the separately, custom-quoted Tableau+ bundle. Standard Creator, Explorer, and Viewer licenses don't include it.
What's the real difference between DAX and Tableau's calculated fields and LOD expressions?
DAX handles measures and calculated columns inside Power BI's semantic model and introduces row and filter context, a genuinely new concept for most Excel users. Tableau's calculated fields use familiar Excel-like syntax, while LOD expressions (FIXED, INCLUDE, EXCLUDE) handle calculations at a different granularity than what's on the visual, their own learning curve.
Which platform is cheaper at scale, Power BI or Tableau?
In most realistic role mixes, Power BI's flat $14/month Pro tier undercuts Tableau's tiered Viewer, Explorer, and Creator pricing as team size grows. Tableau's role-based model does let you pay less for pure viewers, but Power BI's Pro tier already sits at or below Tableau's Viewer-only price, so the gap rarely closes in Tableau's favor on dollars alone.
Does either platform have a real free tier for teams?
Power BI's free tier lets you build and view your own reports but can't share or publish them, so it doesn't work for team collaboration. Tableau has no permanent free tier for internal use at all, only a 14-day trial and Tableau Public, free but limited to public, non-sensitive workbooks.

Principal Product Marketing Strategist
On this page
- TL;DR
- Key Facts
- Who Each Platform Is Really For
- Licensing: Pro, Premium Per User, and Fabric Against Creator, Explorer, Viewer
- Real Cost at 25, 50, and 100 Users
- 25 Users
- 50 Users
- 100 Users
- Data Modeling and Calculation Languages: DAX and Power Query M vs VizQL
- Data Connectivity and Refresh
- Visualization Depth and Design Control
- Governance and Administration
- Embedded and External Sharing
- Ecosystem and Hiring Pool
- AI Features in 2026: Copilot vs Tableau Agent and Pulse
- Implementation and Time to Value
- When Power BI Is the Right Call
- When Tableau Is the Right Call
- Decision Framework
- What to Do Next