Tempo Economizado vs. Impacto na Receita: Como Mensurar IA do Jeito Certo
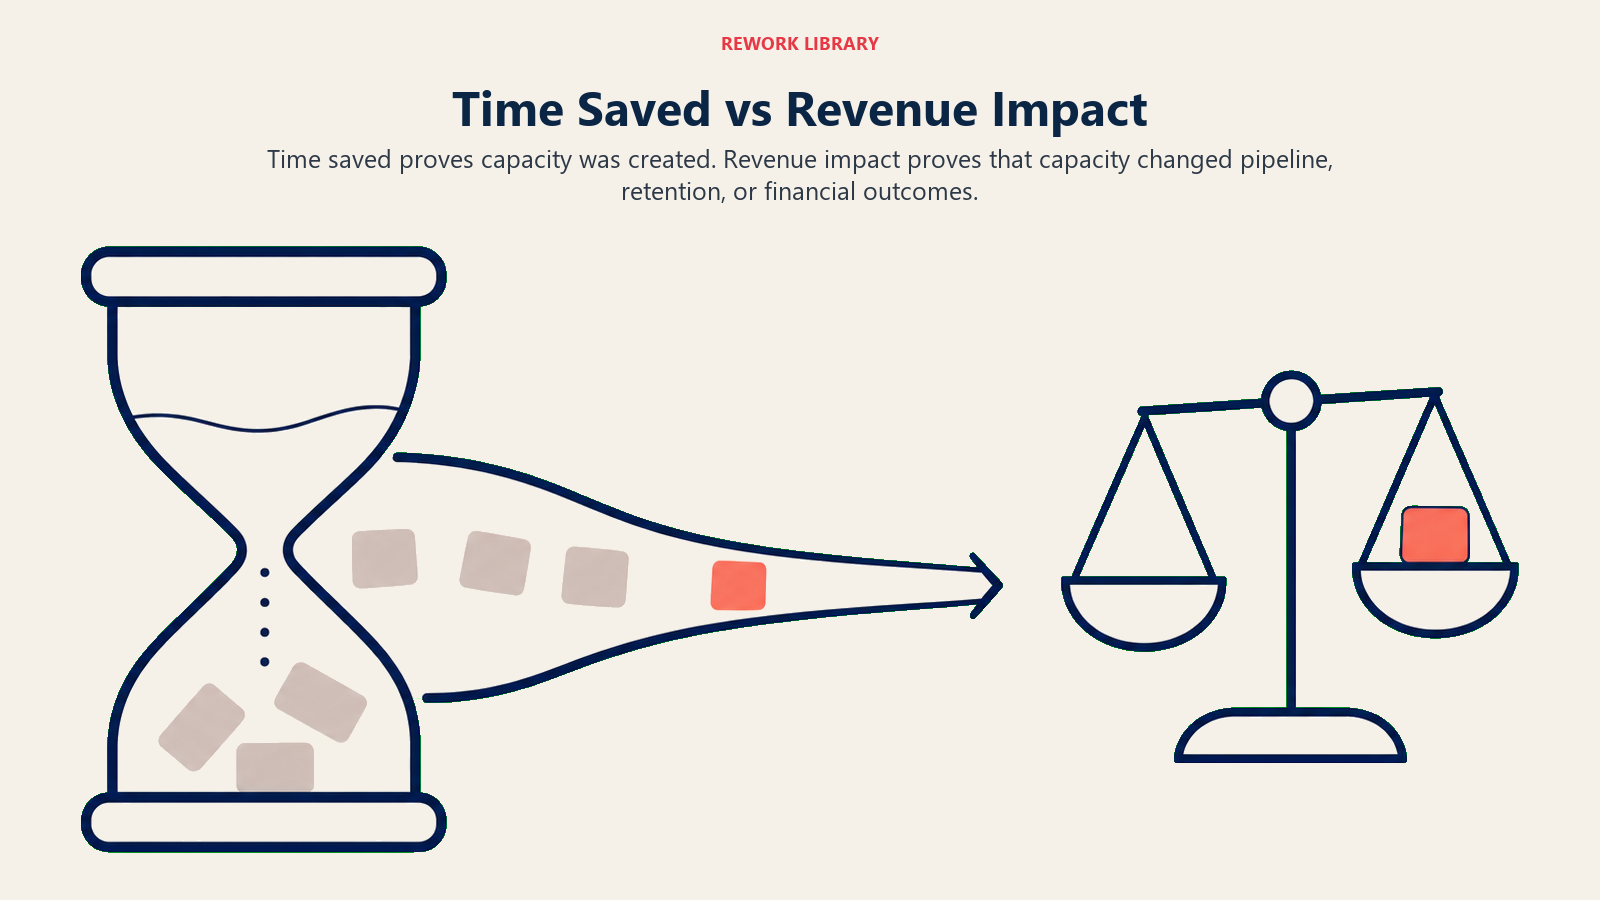
Turn this article into takeaways for your work.


Each assistant summarizes the article only for you and suggests best practices for your work.
"Economizamos 500 horas neste trimestre."
Parece um resultado sólido. O líder de operações apresenta o número, há um momento de silêncio impressionado, e então o chief financial officer (CFO) faz a pergunta para a qual ninguém preparou resposta.
"Então vocês reduziram o headcount?"
Silêncio.
Esta é a armadilha do tempo economizado. E é o erro de mensuração mais comum na implantação de IA. Não porque o tempo economizado não seja valioso. Frequentemente é. Mas porque o tempo economizado é a métrica mais fácil de coletar e a mais difícil de converter em um business case sem contexto adicional. As organizações recorrem a ela porque é imediata e visível. As equipes financeiras frequentemente a descartam porque não aparece no demonstrativo de resultados (P&L).
Uma pesquisa do MIT Sloan descobriu que o uso de IA no trabalho está crescendo, mas os ganhos de produtividade ficam para trás, com quase 25% dos trabalhadores sem economia mensurável de tempo alguma, e apenas um terço economizando quatro ou mais horas semanais. Isso está muito abaixo das 10 horas por funcionário que as organizações normalmente precisam para justificar investimento em escala.
Entender quando usar cada métrica, e como construir o modelo de atribuição para a mais difícil, é o núcleo prático da mensuração do retorno sobre investimento (ROI) em IA.
Por que o tempo economizado domina
Key Facts: Produtividade de IA e Mensuração de Receita
- Trabalhadores do conhecimento que usam ferramentas de IA relatam economizar uma média de 11,4 horas por semana, mas apenas 29% dos executivos afirmam conseguir mensurar de forma confiável o retorno sobre esse tempo. (Deloitte)
- Organizações avançadas em IA veem um aumento de 14% na receita por funcionário, em comparação com organizações que medem apenas o tempo economizado e não conseguem vincular capacidade a resultados de negócio. (Fullview)
- Uma em cada cinco organizações já realizou metas de ROI de iniciativas de produtividade com IA; outras 42% esperam alcançar suas metas de ROI em 12 meses. (Enterprise AI Report 2025)
O tempo economizado está por toda parte nos relatórios de IA por três razões. O ACE Framework ajuda a esclarecer por quê: as capacidades de Generate e Ingest produzem as economias de tempo mais visíveis, enquanto Predict e Execute produzem o impacto na receita que as finanças realmente querem ver.
É imediato. Você pode mensurá-lo no primeiro mês de implantação. Não há necessidade de aguardar resultados a jusante. Uma IA que resume notas de reuniões reduz o tempo de resumo de 15 minutos para 3 minutos, e você pode observar isso na segunda semana do piloto.
É visível. Ao contrário do impacto na receita, que exige conectar a atividade de IA aos resultados do Pipeline ao longo de uma janela de vários meses, o tempo economizado é observável no fluxo de trabalho específico onde a IA opera. Você pode assistir acontecer.
É fácil de contabilizar. Horas registradas antes da IA, horas registradas depois da IA. A matemática é simples. Para equipes sem infraestrutura de mensuração sofisticada, é frequentemente a única métrica que conseguem produzir.
Essas vantagens são reais. O tempo economizado é um indicador antecedente legítimo. O problema é que a maioria das equipes o reporta como indicador conclusivo, como se as horas economizadas fossem o fim da história. Não são. São o começo.
A armadilha do tempo economizado
Veja o que acontece na prática. Uma organização implanta uma ferramenta de IA que poupa a cada representante de vendas duas horas por semana em tarefas administrativas pós-chamada. 20 representantes, 2 horas cada, 50 semanas. São 2.000 horas por ano. A um custo combinado de R$200 por hora, isso representa R$400.000 em "mão de obra poupada."
O CFO olha para a folha de pagamento. Ela não mudou. O headcount é idêntico. Ninguém foi demitido. Os R$400.000 em economias não aparecem em lugar nenhum nas demonstrações financeiras.
Para onde foram as duas horas por representante? Para outro trabalho. Mais chamadas. Mais follow-up. Mais gestão de Pipeline. Provavelmente tudo valioso. Mas nada disso aparece como economia concreta a menos que se traduza em resultado de negócio mensurável: mais negócios fechados, ciclos mais rápidos, receita maior.
A métrica de tempo economizado estava correta. Mas foi apresentada como benefício financeiro antes de estabelecer o vínculo entre o tempo liberado e o resultado de negócio. Essa é a armadilha.
A solução não é parar de medir o tempo economizado. É:
(a) Tornar o plano de redistribuição de capacidade explícito antes da implantação, ou (b) Combinar o tempo economizado com o resultado a jusante que você espera que ele habilite, e então medir esse resultado.
Sem uma dessas opções, o tempo economizado é uma métrica de vaidade. Não inútil, mas não é um argumento financeiro.
Quando o tempo economizado É a métrica primária certa
O tempo economizado se torna uma métrica poderosa quando a capacidade liberada habilita diretamente o resultado de negócio em maior escala, ou quando a redução de headcount está genuinamente em pauta.
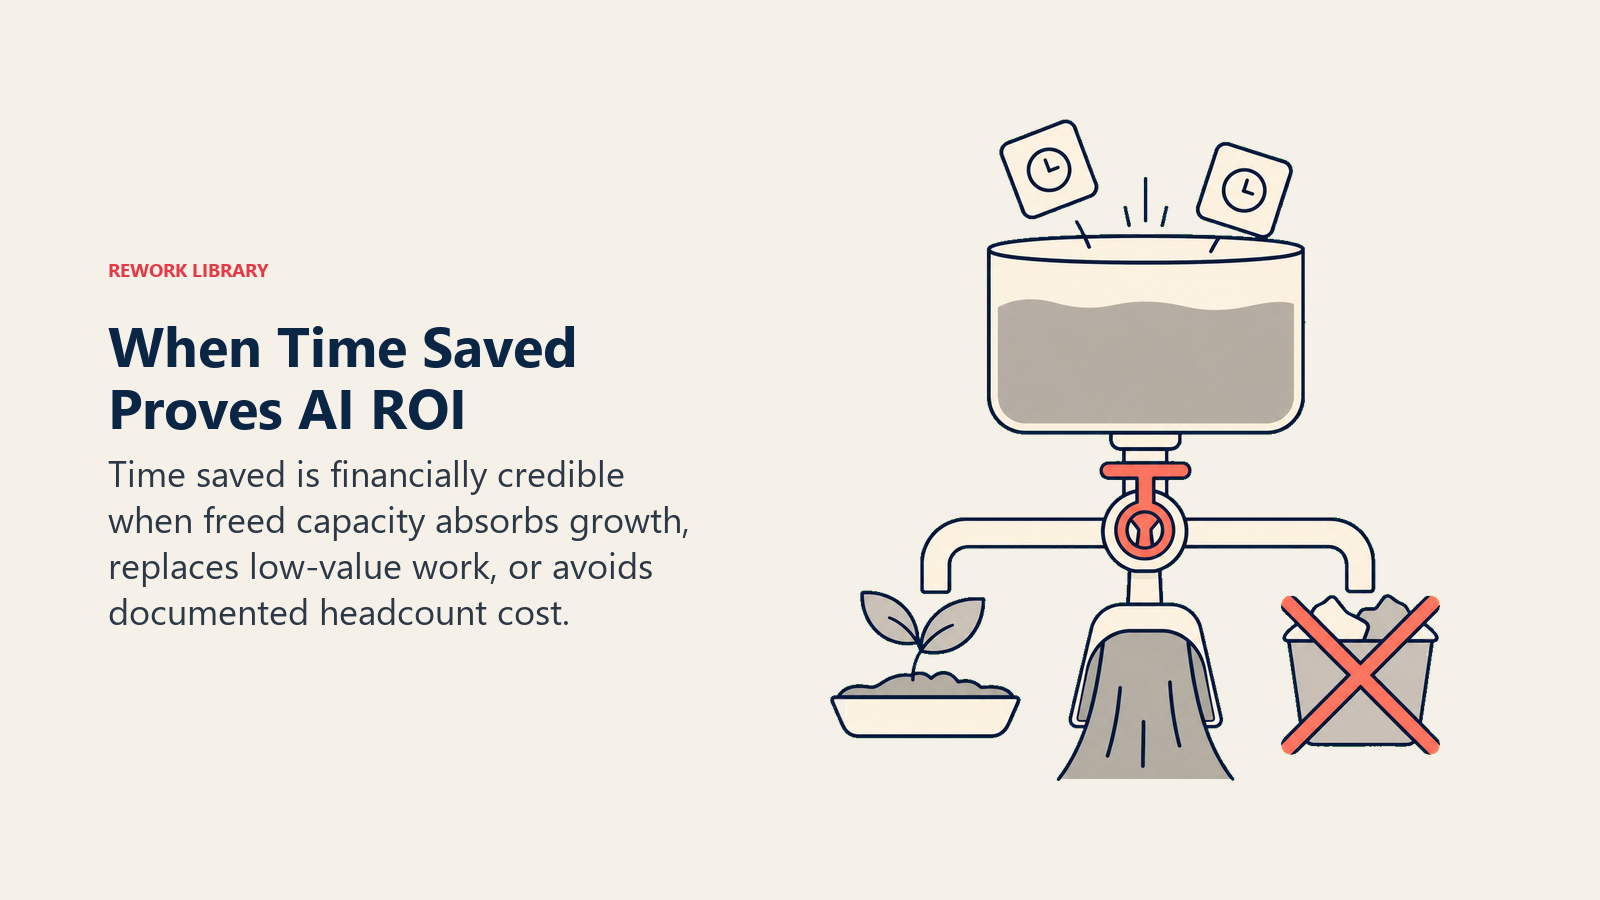
Empresas em crescimento. Se seu negócio está crescendo e você precisaria adicionar headcount proporcionalmente para lidar com o volume crescente, as economias de tempo habilitadas por IA são um argumento de evitação de custos. "Sem essa ferramenta de IA, precisaríamos de dois FTEs adicionais para lidar com nosso crescimento de volume projetado. A IA nos permite absorver esse crescimento com o headcount atual." Este é um argumento financeiro real e defensável. Requer que o plano contrafactual de headcount exista, documentado, no orçamento.
Trabalho de alto volume e baixo julgamento. Resolução de tickets de suporte ao cliente, processamento de documentos, entrada de dados, verificações de conformidade de rotina. Quando uma IA lida com 40% dos tickets de suporte de entrada de forma autônoma, o tempo liberado do agente pode comprovadamente atender mais clientes, ou o mesmo número de clientes com menos agentes. A matemática é direta quando volume e capacidade são mensuráveis.
Economias de tempo do tipo infraestrutura. Quando a IA elimina trabalho que era anteriormente necessário, mas não produzia valor de negócio (formatação manual de dados, entrada de dados redundante, geração de relatórios que ninguém lê), as economias de tempo são inequivocamente positivas. Não há pergunta sobre receita a jusante porque o tempo liberado vai para trabalho que sim produz valor.
O elemento comum: o tempo economizado importa quando a capacidade que ele cria tem um destino claro. "Nossos representantes passam menos tempo em tarefas administrativas" é incompleto. "Nossos representantes passam menos tempo em tarefas administrativas e mais tempo em conversas de vendas, e temos dados mostrando que o Pipeline deles cresceu X%" é um business case. Para o contexto de vendas especificamente, por que as operações de vendas são o caso de uso de IA com maior ROI mostra como o tempo liberado se converte em Pipeline quando a redistribuição de capacidade é explícita.
Impacto na receita: a métrica mais difícil e mais valiosa
O impacto na receita é a métrica que CFOs e conselhos realmente querem. Ele conecta a IA ao que determina a saúde organizacional: se o negócio cresce. O relatório de potencial econômico da IA generativa da McKinsey estima que a IA generativa poderia adicionar US$2,6 a US$4,4 trilhões em valor anual nos casos de uso, com os maiores ganhos vindo não de economias de tempo, mas de resultados adjacentes à receita em vendas, operações de clientes e pesquisa e desenvolvimento.
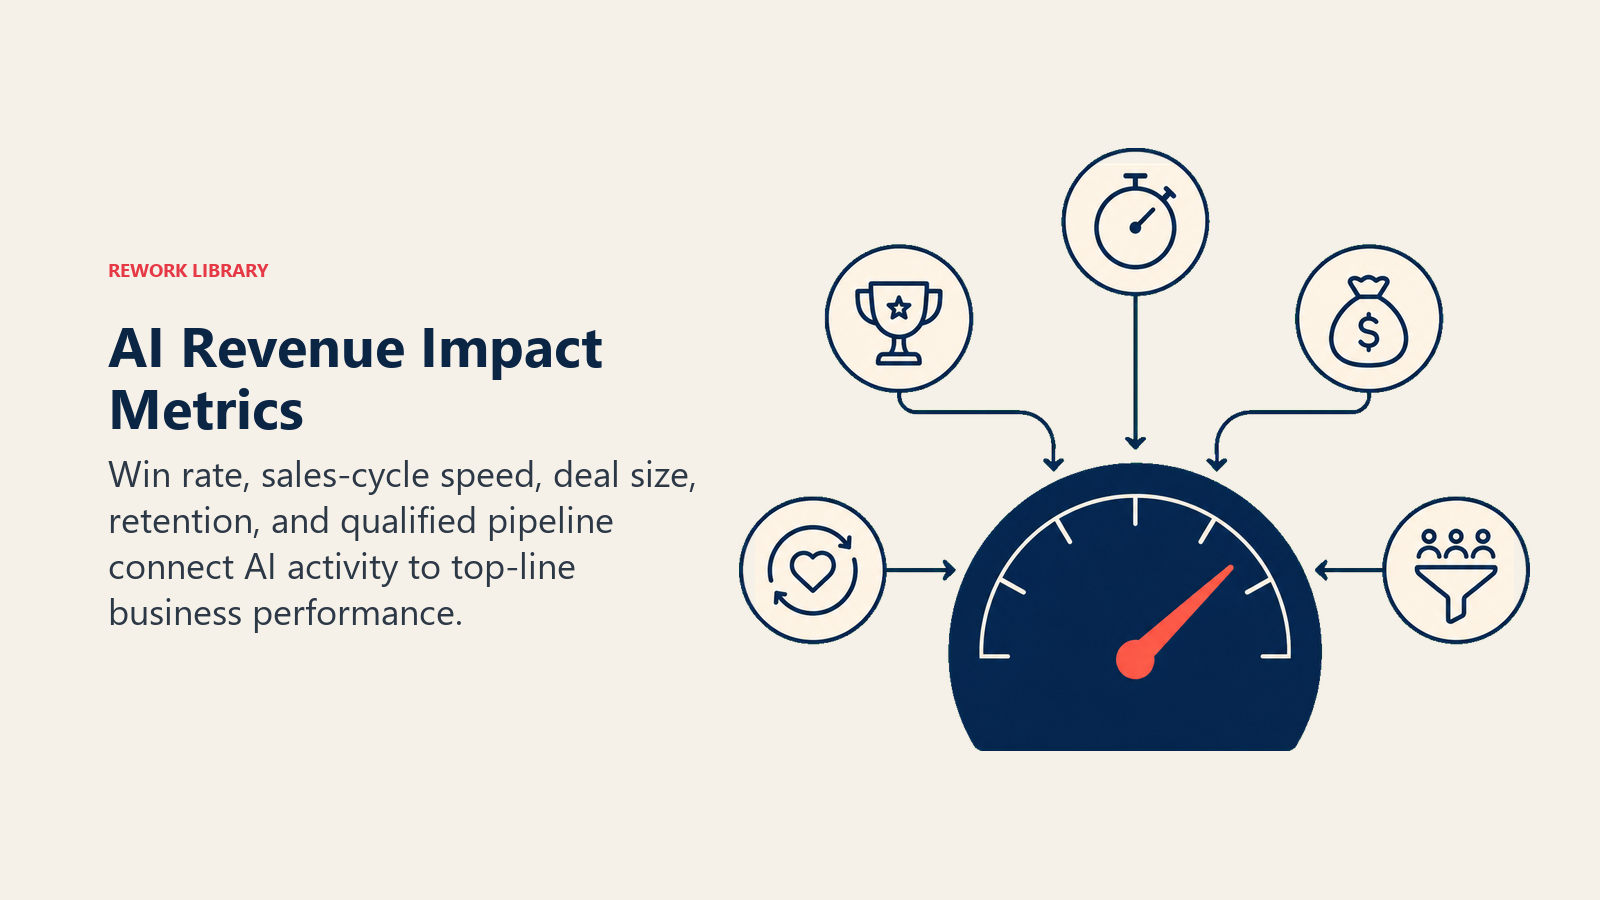
O impacto na receita mede como a IA muda os resultados que afetam diretamente a linha de cima:
- Taxa de fechamento em Pipeline qualificado
- Duração média do ciclo de vendas
- Tamanho do negócio ou receita média por usuário (ARPU)
- Taxa de retenção ou expansão de clientes
- Novo Pipeline gerado (volume de oportunidades qualificadas)
Essas métricas importam porque se traduzem diretamente em valores monetários. Uma melhoria de 3% na taxa de fechamento em R$100 milhões de Pipeline anual representa R$3 milhões em receita adicional fechada. Uma redução de 15 dias no ciclo médio de vendas é mensurável em termos de velocidade do Pipeline e capital de giro. Uma melhoria de 2% na retenção de receita líquida em R$25 milhões de annual recurring revenue (ARR) equivale a R$500.000 em receita anualizada.
O desafio é a atribuição. E é um desafio genuíno, não um detalhe menor de mensuração. O framework As 5 Dimensões do ROI em IA mostra como o impacto na receita se situa ao lado de quatro outras dimensões, cada uma exigindo sua própria linha de base e metodologia de mensuração.
O problema de atribuição
A receita é afetada por muitas variáveis simultaneamente. Quando você implanta uma ferramenta de assistência de vendas por IA no segundo trimestre, você também acabou de contratar três novos representantes, lançou um novo nível de produto, expandiu para dois novos territórios e mudou seus preços. Quanto do crescimento de receita do segundo trimestre veio da IA?
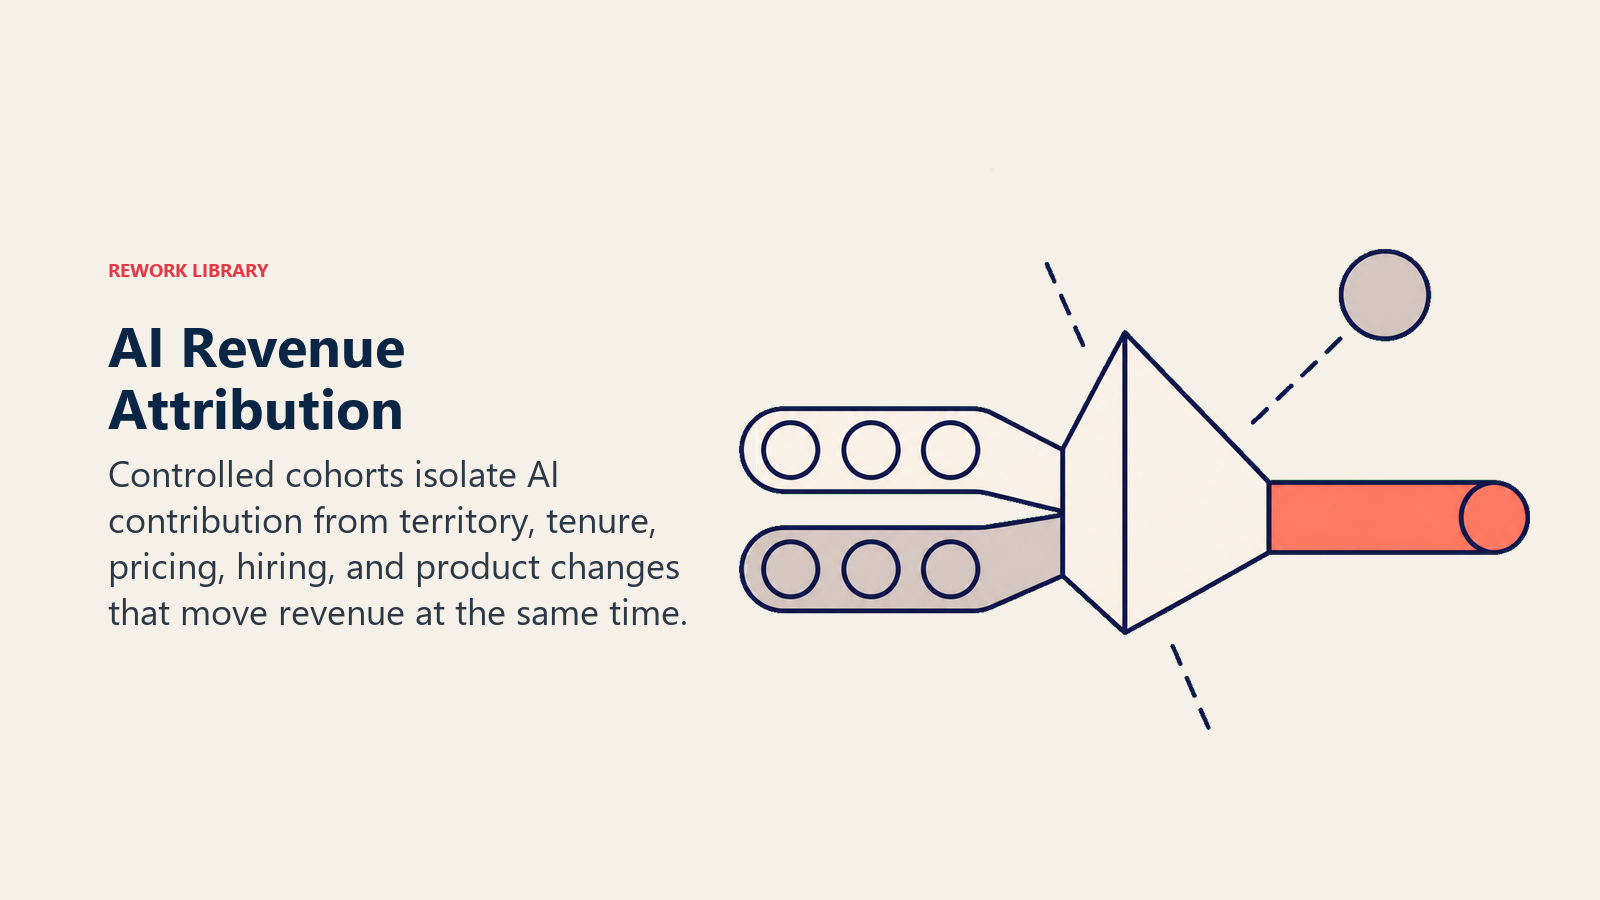
A resposta honesta, na maioria dos casos: você não sabe exatamente. Você pode estimar.
A forma correta de estimar é uma comparação controlada. Execute um experimento controlado onde alguns representantes usam a ferramenta de IA e outros não, com territórios, perfis de tempo de empresa e perfis de negócio comparáveis. Meça os resultados para ambos os grupos no mesmo período. A diferença entre os grupos é a melhor estimativa disponível da contribuição da IA. Uma pesquisa da Harvard Business School sobre IA, ROI e produtividade de vendas usa exatamente esse design controlado para isolar a contribuição de receita das ferramentas de vendas de IA de outras variáveis concorrentes.
Isso é mais difícil de executar do que parece. As equipes de vendas resistem a ser alocadas ao grupo de controle "sem IA". Os gerentes não querem que seus representantes fiquem em desvantagem. E a comparabilidade de territórios nunca é perfeita. Mas mesmo uma comparação controlada imperfeita é muito mais crível do que uma comparação pré/pós sem controles.
Se um experimento controlado não for viável, documente as variáveis de confusão explicitamente. "A receita aumentou 22% neste trimestre. Acreditamos que a IA contribuiu com aproximadamente 8-12% desse aumento com base na seguinte análise..." Em seguida, mostre a análise: dados por representante comparando representantes que adotam IA com adotantes tardios, controlando por tempo de empresa e território. A atribuição parcial com raciocínio documentado é crível. A atribuição indiferenciada não é.
Um exemplo real: o account executive e as 2 horas
Um account executive (AE) economiza 2 horas por semana com uma ferramenta de IA para resumo de reuniões e follow-up por e-mail. Ao longo de um trimestre, são aproximadamente 26 horas liberadas do trabalho administrativo.
Aqui está a pergunta honesta de mensuração: essas 26 horas se converteram em mais Pipeline?
Rastreie a atividade do representante no mesmo período: número de chamadas de descoberta, número de demos, número de follow-ups, Pipeline criado. Se os representantes habilitados por IA estão realizando 15% mais conversas de vendas do que os representantes sem IA em territórios comparáveis, você tem uma linha plausível entre economias de tempo e impacto no Pipeline.
Mas se as 26 horas foram para Slack, reuniões sobre reuniões e trabalho de preparação para negócios que já estavam no Pipeline, as economias de tempo não se converteram. São reais, mas ainda não são um argumento de negócio.
A distinção importa para decisões de investimento. Uma IA que libera tempo que permanece no orçamento geral de atividades da organização é algo bom de se ter. Uma IA que comprovadamente gera mais Pipeline por representante é um investimento estratégico. Você precisa da mensuração de acompanhamento para saber qual delas você tem.
O modelo híbrido: indicadores antecedentes e consequentes
O modelo híbrido permite que as equipes relatem sinais operacionais iniciais sem fingir que o impacto na receita aparece de imediato.
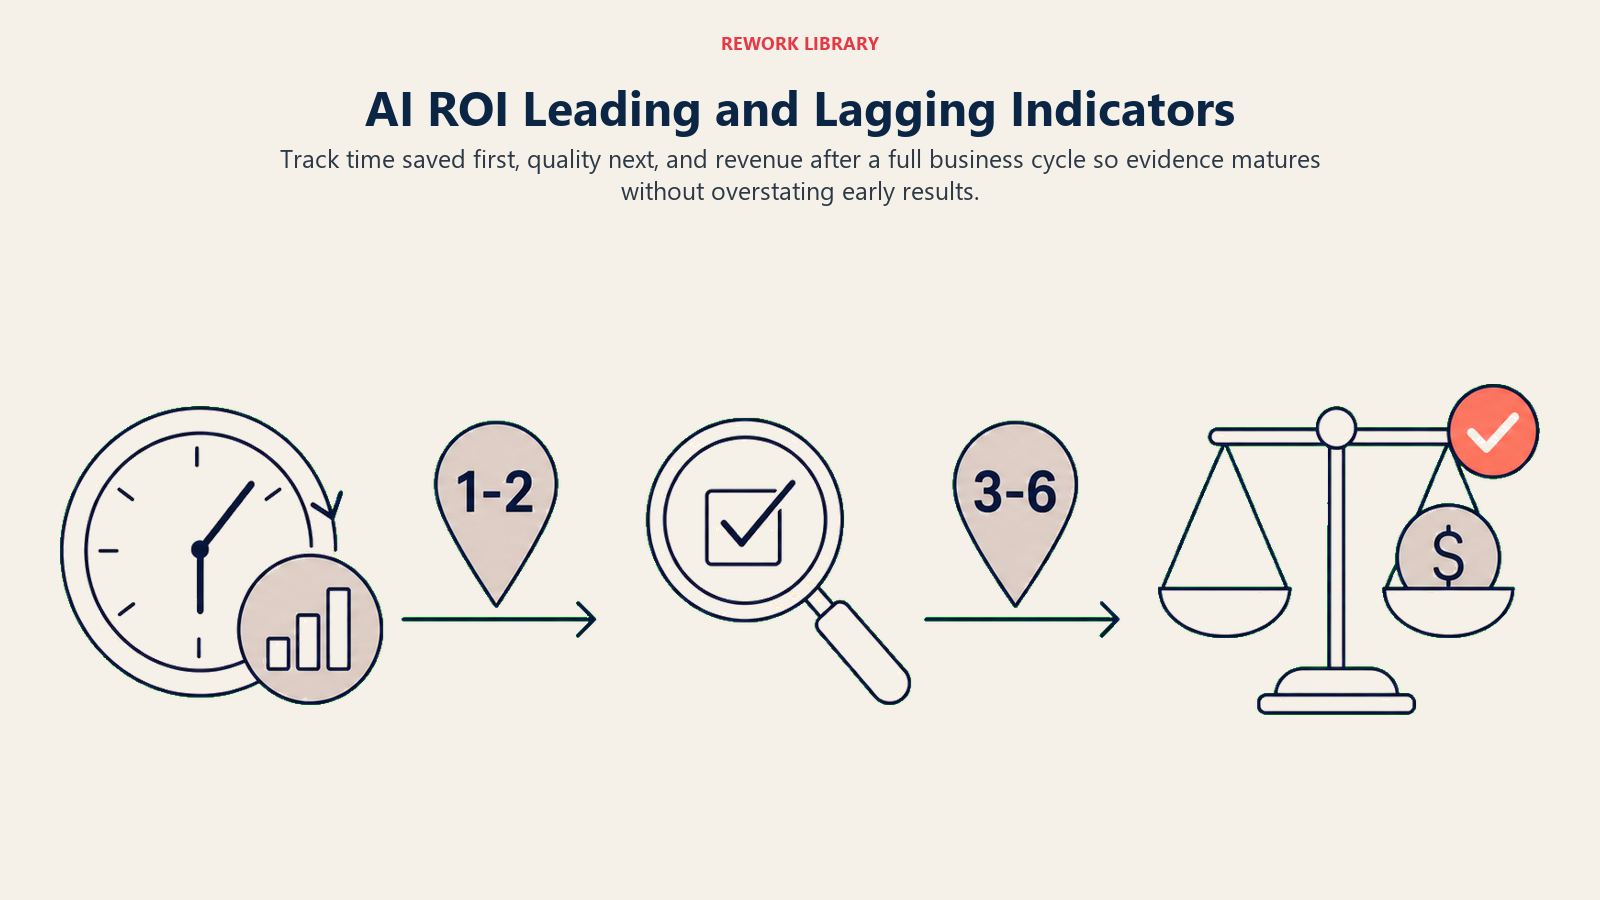
Programas de IA maduros usam ambas as métricas, com uma compreensão clara de qual é antecedente e qual é consequente.
O tempo economizado é um indicador antecedente. Ele diz se a IA está funcionando conforme projetado e gerando a capacidade esperada. Fornece algo a reportar nos primeiros 30 a 60 dias de implantação, quando o impacto na receita ainda não é visível.
O impacto na receita é um indicador consequente. Confirma se a capacidade gerada pela IA realmente se traduziu em resultados de negócio. Leva um ciclo de vendas completo ou mais para ser visível, que é tipicamente 90 a 180 dias para B2B software as a service (SaaS).
O modelo híbrido funciona assim:
Meses 1-2: Reporte o tempo economizado. Mostre a comparação com a linha de base. Documente como a capacidade liberada está sendo redistribuída.
Meses 3-6: Adicione métricas de melhoria de qualidade. Tempo de resposta, precisão dos resultados, pontuações de satisfação do cliente para interações assistidas por IA. Esses são sinais antecipados de impacto a jusante.
Meses 6-18: Mensuração do impacto na receita. Taxa de fechamento, velocidade do Pipeline, comparação de ARPU entre coortes que usam IA e de controle. É quando você pode contar a história completa.
O CFO que descarta o tempo economizado no segundo mês está sendo impaciente demais. O líder de transformação que para no tempo economizado no décimo oitavo mês está deixando as evidências mais importantes sem mensurar.
Qual métrica usar para qual audiência
Cada stakeholder precisa de uma prova diferente, porque o conselho, o CFO, o líder de operações e o RH absorvem o risco da IA por lentes distintas.
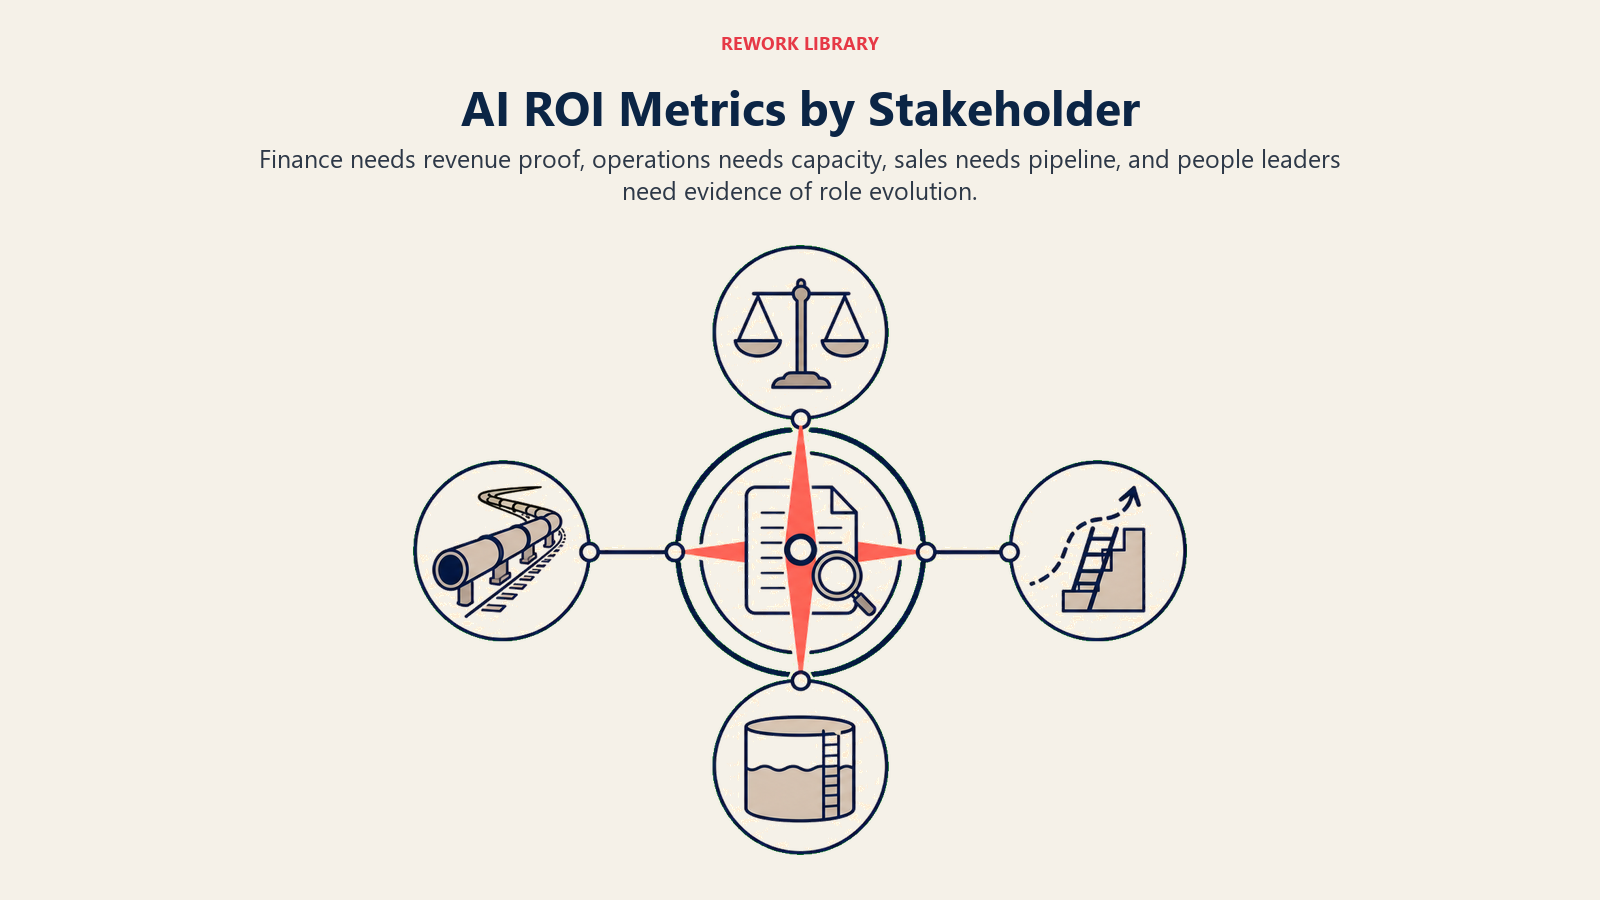
Nem todo stakeholder precisa do mesmo enquadramento.
Conselho e CFO: Lidere com impacto na receita. Eles se preocupam com o P&L e se o investimento está gerando retornos que justifiquem o custo. Apresente o tempo economizado como contexto, não como conclusão. Mostre a metodologia de mensuração e a abordagem de atribuição. Se o impacto na receita ainda não é mensurável, diga isso honestamente e explique o plano para mensurá-lo.
Liderança de operações: Lidere com tempo economizado e métricas de capacidade. Líderes de operações entendem volume, taxa de transferência e utilização de headcount. O tempo economizado com uma narrativa clara de redistribuição de capacidade ressoa com eles. Adicione melhoria de qualidade para mostrar que a IA não está trocando velocidade por precisão.
Gestão de vendas: Lidere com métricas de Pipeline e dados de taxa de fechamento. Gerentes de vendas se preocupam com o cumprimento de cota e a velocidade dos negócios. "Representantes que usam IA estão criando 18% mais Pipeline por trimestre" reverbera de forma diferente de "representantes que usam IA economizam 2 horas por semana." Conecte a IA às métricas pelas quais os gerentes já são avaliados.
RH e líderes de pessoas: Lidere com uma narrativa de upskilling e evolução de funções. O tempo economizado não é a história para o RH; é a preocupação (substituição de empregos). Enquadre a IA como habilitadora para que os funcionários passem menos tempo em trabalho de baixo julgamento e mais tempo no trabalho que requer julgamento humano: gestão de relacionamentos, resolução de problemas complexos, decisões criativas. Mostre que as funções estão evoluindo, não sendo eliminadas. Evolução de Funções com IA: O Que Muda para Quem oferece aos Chief Human Resources Officers (CHROs) o mapa por função de que precisam para ter essa conversa com confiança.
Os mesmos dados subjacentes suportam todas essas narrativas. A diferença é qual dimensão você lidera.
O Teste de Conversão Tempo-Para-Valor
O Teste de Conversão Tempo-Para-Valor é um diagnóstico de duas perguntas para qualquer afirmação de economia de tempo com IA: (1) A capacidade liberada tem um destino nomeado dentro do negócio, documentado antes da implantação? (2) Existe uma métrica de receita ou qualidade consequente que confirmará se essa capacidade entregou valor de negócio em 90 a 180 dias? Se ambas as respostas forem sim, o tempo economizado é um business case legítimo. Se qualquer resposta for não, o tempo economizado é uma métrica de vaidade até que você adicione o elo faltante.
Quotable: "A armadilha do tempo economizado se fecha quando as finanças olham para a folha de pagamento. 20 representantes economizando 2 horas por semana a R$200 por hora equivale a R$400.000 em economias de mão de obra que nunca aparecem nas demonstrações financeiras, porque o headcount não mudou."
Quotable: "Uma melhoria de 3% na taxa de fechamento em R$100 milhões de Pipeline anual representa R$3 milhões em receita adicional fechada. Essa conversão de atividade de IA em resultado de negócio é o número que o CFO realmente quer ver."
Quotable: "A mensuração do impacto na receita requer linhas de base capturadas antes da implantação. Organizações que pulam as linhas de base pré-implantação perdem permanentemente a capacidade de provar o ROI de receita, porque o período pré-IA não pode ser reconstruído."
| Audiência | Métrica Principal | Métrica de Suporte | Tradução de Negócio |
|---|---|---|---|
| Conselho / CFO | Impacto na receita (taxa de fechamento, ARPU, retenção) | Tempo economizado como contexto | Retorno monetário sobre investimento |
| Liderança de operações | Tempo economizado + taxa de transferência | Melhoria de qualidade | Argumento de capacidade e escalonamento |
| Gestão de vendas | Pipeline criado por representante | Delta de taxa de fechamento | Vinculação ao cumprimento de cota |
| RH / Pessoas | Narrativa de evolução de funções | Métricas de engajamento / upskill | Crescimento de habilidades, não substituição |
Rework Analysis: Com base em padrões de mensuração de IA empresarial, organizações que constroem modelos de mensuração híbridos antecedente-consequente (tempo economizado nos meses 1-2, melhoria de qualidade nos meses 3-6, impacto na receita nos meses 6-18) mantêm a aprovação do orçamento de IA significativamente melhor do que aquelas que reportam apenas métricas de tempo economizado. O modelo híbrido fornece às finanças algo crível em cada ciclo de relatório enquanto os dados de receita consequentes amadurecem.
O pré-requisito de infraestrutura de mensuração
A mensuração do impacto na receita requer linhas de base. Capturadas antes da implantação. Com a mesma metodologia que você usará após a implantação.
Se você planeja medir a melhoria da taxa de fechamento, precisa da taxa de fechamento atual por representante, por segmento e por território, antes de implantar a ferramenta de IA. Se não tiver, não poderá comparar.
Se você planeja medir a velocidade do Pipeline, precisa da média atual de dias em cada etapa, antes da implantação. Se não tiver, não poderá comparar.
Se você não construiu essa infraestrutura antes de implantar, a mensuração do impacto na receita se torna quase impossível. Você ficará com o tempo economizado porque é a única métrica que não requer uma linha de base pré-IA.
Esta é a lição operacional mais importante na mensuração do ROI em IA: o trabalho de mensuração acontece antes da implantação, não depois. O artigo Measuring AI Pattern ROI mostra como instrumentar linhas de base no nível do padrão antes que qualquer implantação comece.
Leia As 5 Dimensões do ROI em IA para o framework completo em todas as cinco categorias de mensuração. E leia Por Que o ROI em IA é Difícil de Provar para um relato honesto de por que mesmo programas de mensuração bem projetados lutam com a atribuição. Os desafios estruturais são reais, e entendê-los antecipadamente é melhor do que descobri-los durante uma apresentação ao conselho.
O tempo economizado é uma métrica legítima. O impacto na receita é o que justifica o orçamento. Construa a infraestrutura para medir ambos, e saiba qual história você está contando para quem. Para trazer essa narrativa de mensuração para a conversa de orçamento, A Conversa com o CFO sobre Orçamento de IA cobre exatamente quais métricas ressoam em cada etapa da avaliação do CFO.
Perguntas Frequentes
Qual é a diferença entre tempo economizado e impacto na receita na mensuração de IA?
O tempo economizado mede as horas liberadas de trabalho manual ou repetitivo, enquanto o impacto na receita mede se essas horas liberadas se converteram em mais negócios fechados, ciclos de vendas mais rápidos, maior retenção ou maior receita média por usuário. O tempo economizado é um indicador antecedente observável em semanas. O impacto na receita é um indicador consequente que requer um ciclo completo de vendas ou serviço para confirmar.
Por que o tempo economizado falha como business case?
O tempo economizado falha como business case autônomo porque as horas liberadas raramente aparecem nas demonstrações financeiras. Se 20 representantes economizam cada um 2 horas por semana, a folha de pagamento não muda e a "mão de obra poupada" não está no P&L. O argumento só se sustenta quando a capacidade liberada tem um destino documentado, como mais conversas de vendas ou maior volume de tickets, e quando uma métrica de resultado a jusante confirma a conversão.
Quando o tempo economizado é a métrica primária certa?
O tempo economizado é a métrica primária mais forte para empresas em crescimento onde a alternativa à IA é o crescimento proporcional de headcount, para trabalho de alto volume e baixo julgamento como suporte ao cliente ou processamento de documentos, e para economias do tipo infraestrutura onde a IA elimina trabalho que não produzia valor de negócio. Em cada caso, a capacidade liberada tem um destino claro e mensurável.
Quanto tempo leva para o impacto na receita da IA se tornar mensurável?
O impacto na receita normalmente se torna mensurável após um ciclo completo de vendas ou serviço, que é de 90 a 180 dias para a maioria das organizações B2B. Organizações que esperam impacto na receita nos primeiros 30 dias estão medindo cedo demais. O modelo híbrido reporta o tempo economizado nos meses 1-2, melhoria de qualidade nos meses 3-6 e impacto na receita nos meses 6-18.
Qual é o melhor método para atribuir ganhos de receita à IA?
O método mínimo crível é uma comparação controlada: alguns funcionários usam a ferramenta de IA, outros não, com territórios, tempo de empresa e perfis de negócio comparáveis. A diferença de resultado entre os grupos é a melhor estimativa disponível da contribuição da IA. Se um experimento controlado não for viável, documente todas as variáveis de confusão explicitamente e apresente atribuição parcial com análise fundamentada, em vez de afirmações antes e depois sem controles.
Como o ROI em IA deve ser apresentado a um CFO?
Lidere com o impacto na receita se disponível. Apresente o tempo economizado como contexto, não como conclusão. Mostre a metodologia de mensuração e a abordagem de atribuição. Se o impacto na receita ainda não é mensurável, diga isso e explique o cronograma e o plano para mensurá-lo. Uma atribuição parcial crível com ressalvas honestas é mais persuasiva do que um número confiante que não resiste a uma pergunta de acompanhamento.

Co-Founder, Rework.com
On this page
- Por que o tempo economizado domina
- A armadilha do tempo economizado
- Quando o tempo economizado É a métrica primária certa
- Impacto na receita: a métrica mais difícil e mais valiosa
- O problema de atribuição
- Um exemplo real: o account executive e as 2 horas
- O modelo híbrido: indicadores antecedentes e consequentes
- Qual métrica usar para qual audiência
- O Teste de Conversão Tempo-Para-Valor
- O pré-requisito de infraestrutura de mensuração