The 5 Dimensions of AI ROI: A Complete Measurement Framework
Turn this article into takeaways for your work.


Each assistant summarizes the article only for you and suggests best practices for your work.
The CFO asks for the AI return on investment (ROI) number before approving the next tranche of investment. You look at your dashboard. The sales team saved 340 hours last quarter. The support AI resolved 42% of tickets without human touch. Your customer data is better organized than it's ever been.
But the CFO isn't asking how many hours you saved. She's asking whether the AI investment is generating more value than it costs. And the honest answer is: you're measuring some of the value but not all of it. You're probably measuring the easiest part, not the most important part.
This is the AI ROI problem. Not that AI doesn't generate value. It often does. But most organizations measure one dimension of that value, call it "the ROI," and either oversell AI to the board or undersell it because they're missing components.
The 5-dimension ROI framework gives you the full picture. For the structural reasons why proving that ROI is so hard, Why AI ROI Is Hard to Prove covers what the vendor pitch left out.
Why single-dimension ROI misleads
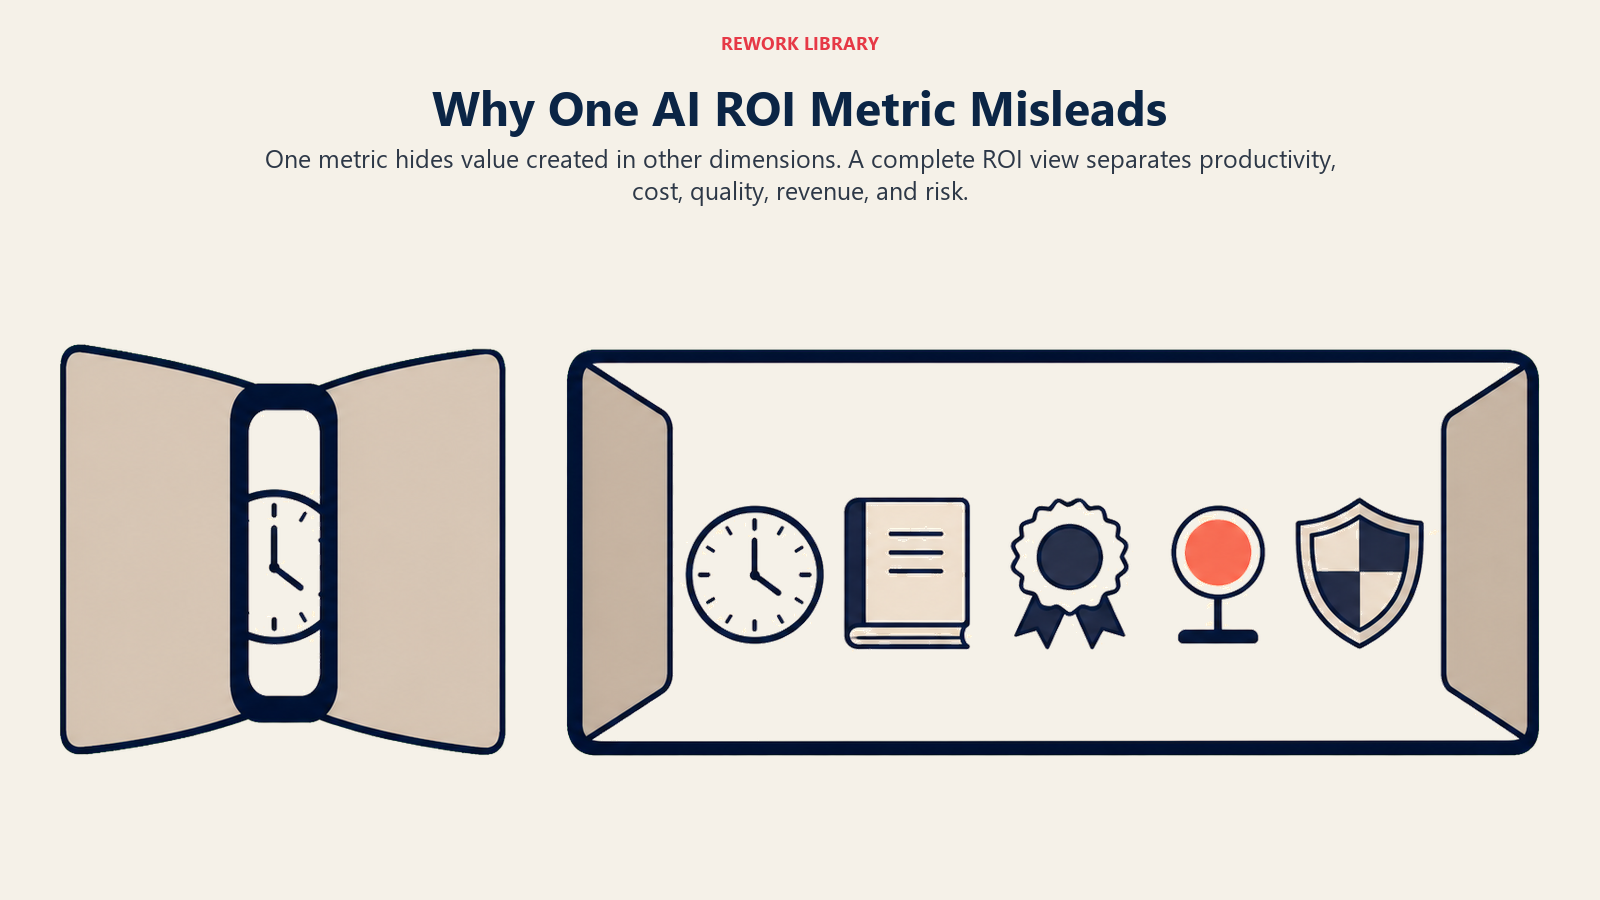
Single-dimension ROI tells an incomplete story in both directions.
Key Facts: AI ROI Measurement
- Only 29% of executives say they can reliably measure return on AI investment, even as 86% of enterprises increased AI budgets in 2025. (Deloitte)
- Just 25% of AI initiatives deliver expected ROI; 42% of companies abandoned most of their AI projects in 2025, up from 17% the prior year. (Master of Code)
- Companies that achieve production-scale AI report average returns of 1.7x, with cost savings of 26-31% in supply chain, finance, and operations. (Deloitte)
McKinsey's analysis of the economic potential of generative AI estimates that 75% of generative AI's total annual value concentrates in just four business functions: marketing and sales, customer operations, software engineering, and research and development. That concentration matters because it means an organization measuring only "hours saved across the company" will miss the majority of the value, which shows up in quality and revenue dimensions, not time.
An AI tool that saves 20 hours per week per employee but increases the error rate in outputs looks great on a time-saved dashboard. Add quality measurement, and it might be a net negative investment. The time saved doesn't compensate for the error remediation, the customer impact, and the trust erosion.
An AI tool that improves decision quality by 12% but doesn't save measurable hours looks useless on a productivity dashboard. Frame it correctly as risk reduction and quality improvement, and it might be one of your best investments of the year.
A complete ROI framework requires all five dimensions, measured against pre-deployment baselines, evaluated together. The combination tells you whether the investment is working. Any one dimension in isolation will mislead you in one direction or the other.
Dimension 1: Time Saved
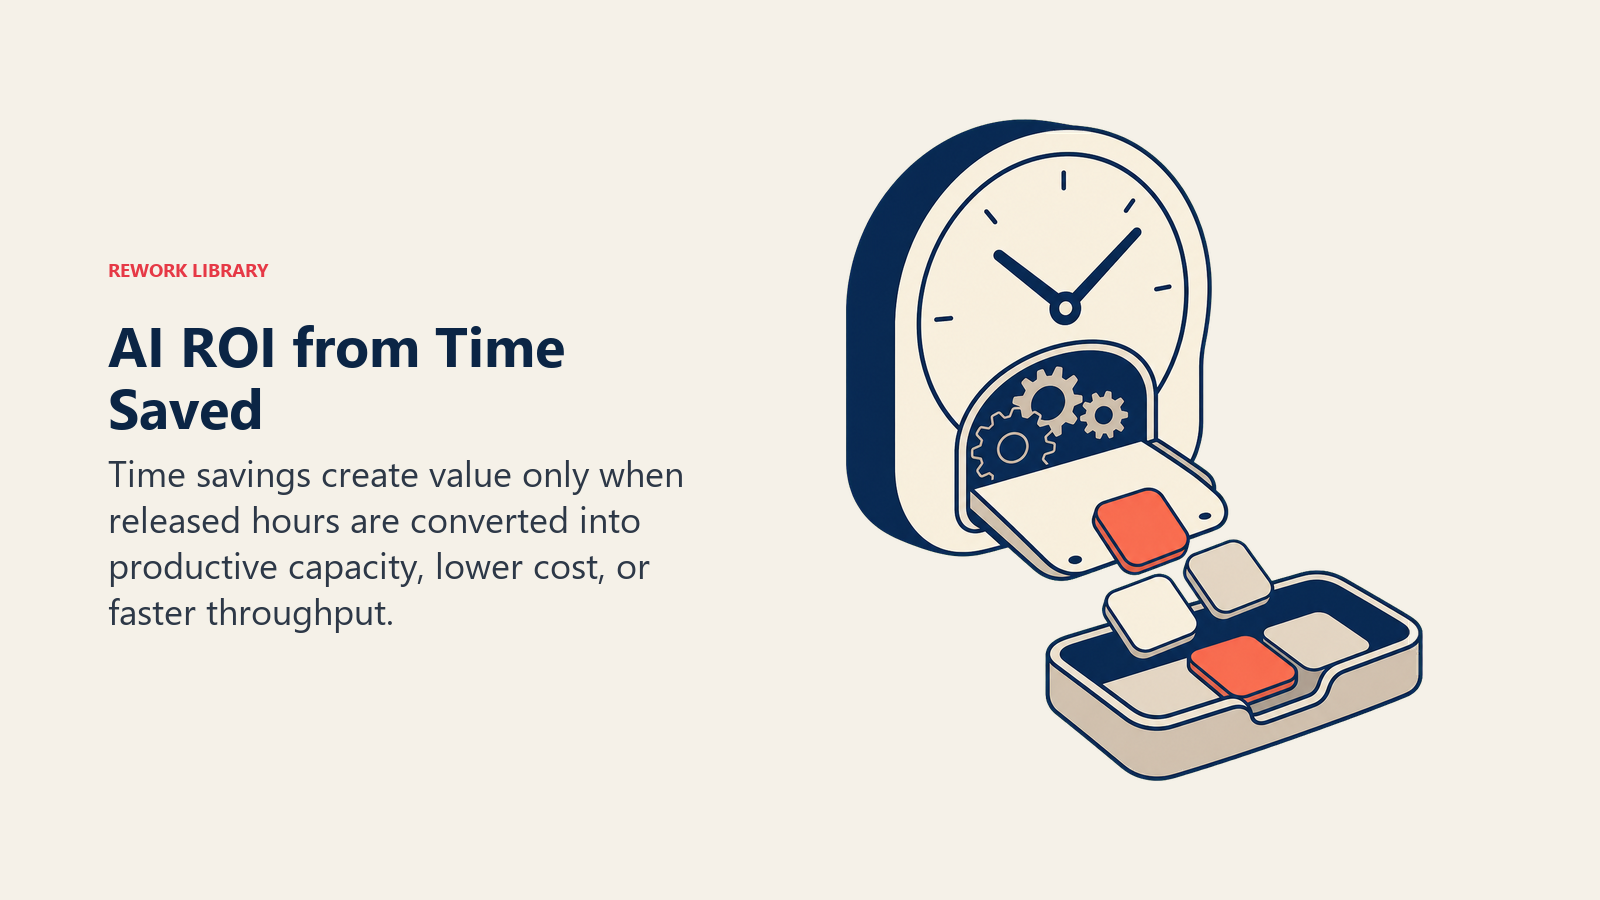
What it measures: Hours per week per user freed from manual, repetitive, or low-judgment work.
How to baseline before deployment: Time-motion study or process audit. Before deploying the AI tool, have team members track time spent on the specific tasks the AI will assist with for two to three weeks. Be specific: "time spent summarizing call notes" is a useful baseline; "time spent on post-call admin" is too broad to measure.
Alternatively, use an existing time-tracking system if your team already logs activity by task type. The baseline window should be at least two weeks to account for variation.
How to measure post-deployment: Same tracking methodology, same team, same time window. The delta is your time saved. Multiply by hourly cost of the employee's time (blended rate, not fully-loaded cost) to get the first-order dollar figure.
Common mistake: Measuring input time saved without measuring output quality or throughput. An AI that cuts call summarization from 12 minutes to 2 minutes is impressive on time-saved metrics. But if the summaries require 5 minutes of human correction, the real savings are smaller. And if the summaries are wrong often enough to affect rep behavior, you may have a quality problem masking as a time win.
When this dimension matters most: High-volume, low-judgment work where the time savings directly translate to capacity for higher-value work. Document processing, data entry, meeting notes, initial data enrichment. Also critical for customer support, where time saved per ticket directly affects cost per resolution. The ACE Framework's Ingest and Generate capabilities produce the most visible time-saved numbers because they operate on the highest-volume, most repetitive tasks.
What to watch: Time saved rarely converts automatically to headcount reduction. Employees fill freed time with other work. That's fine and often valuable, but it means the dollar conversion is softer than it looks. You need a specific plan for how the freed capacity will be used to show hard dollar impact.
Dimension 2: Cost Reduction
What it measures: Fewer tools, reduced headcount growth rate, lower cost of error remediation, reduced overhead for specific processes.
How to baseline before deployment: Current tool spend for the category the AI replaces or consolidates, plus the full-time equivalent (FTE) hours and cost associated with the manual process being automated. Include vendor contracts that will be terminated, seat licenses that will be reduced, and the management overhead of the tools being replaced.
How to measure post-deployment: Actual tool spend reduction (hard dollar), FTE cost of the process post-deployment versus pre-deployment, and the cost of errors that AI prevented versus the baseline error rate.
Common mistake: Counting cost avoidance as hard savings before it materializes. "We avoided hiring two people because AI handles the work" is a real economic argument. But if those two roles weren't budgeted anyway, the cost avoidance doesn't show up as savings anywhere on the profit and loss (P&L) statement. Finance teams are right to be skeptical of cost avoidance claims that don't tie to specific budget lines.
A better framing for cost avoidance: "Without this AI investment, we would have needed to add two FTEs to maintain current output levels as we grow. The AI allows us to maintain throughput as we scale without those hires." This is a growth-enabling cost reduction, not a current-period saving, and should be presented as such.
When this dimension matters most: Scaling businesses where the alternative to AI is proportional headcount growth. If your current processes require one human per X units of work, and AI allows you to increase X without increasing headcount, the cost reduction is real and compounding. Also important for software as a service (SaaS) consolidation: if an AI tool replaces three existing point solutions, the net cost may be neutral or negative. The SaaS AI Maturity Stages model shows how cost reduction compounds as organizations move through later maturity stages.
Dimension 3: Quality Improvement
What it measures: Accuracy rates, conversion rates, error rates, customer satisfaction scores (Net Promoter Score, Customer Satisfaction Score), output consistency.
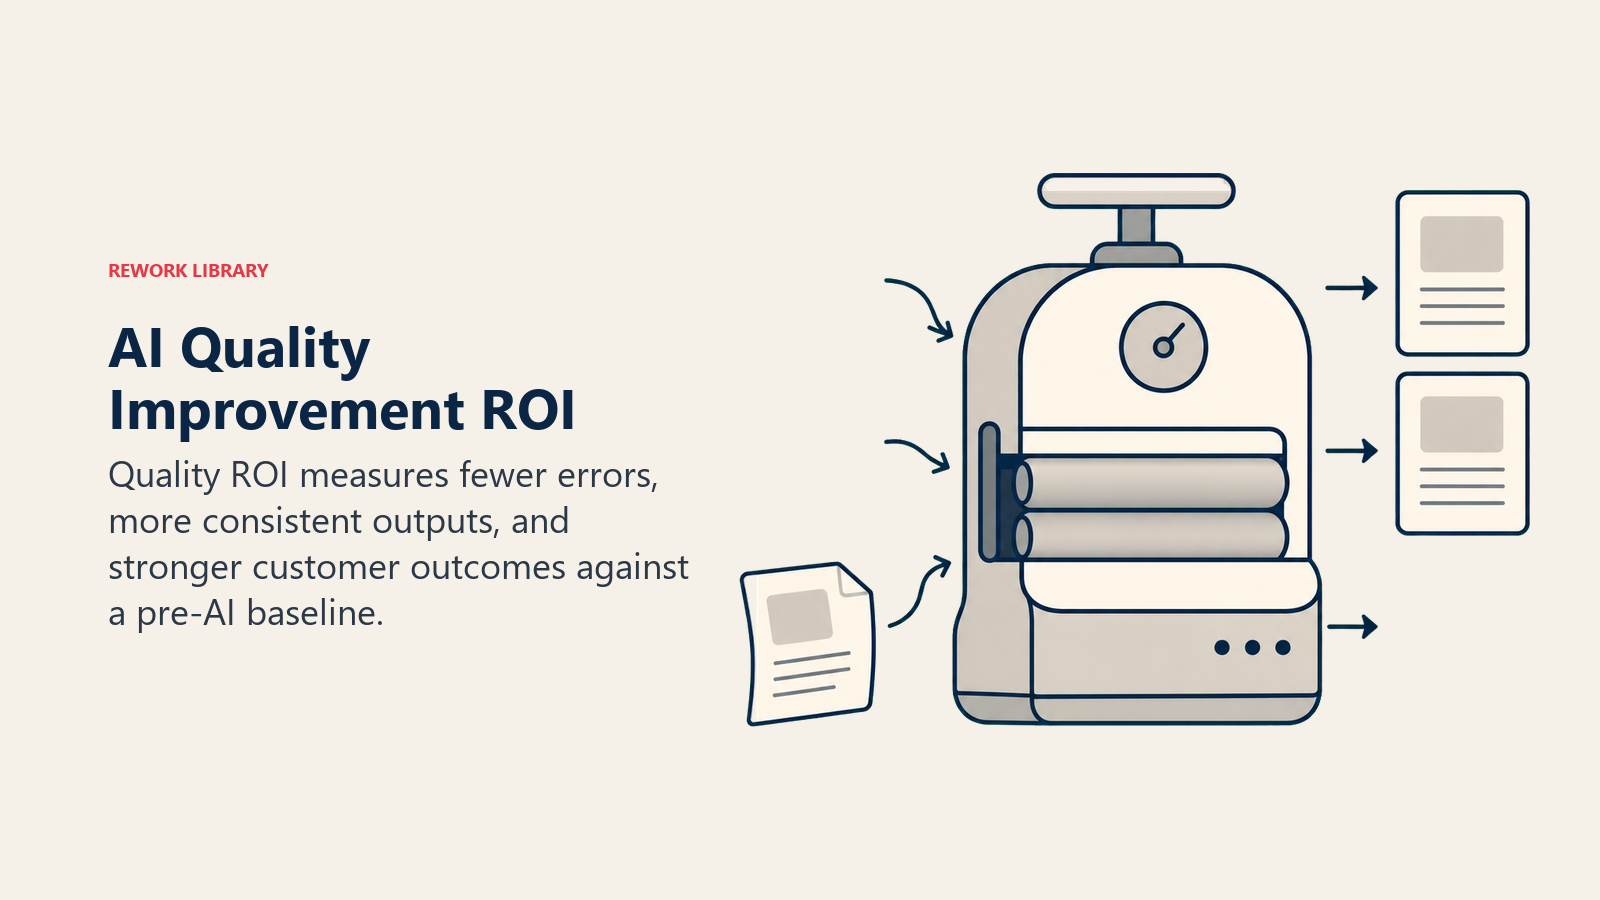
How to baseline before deployment: Current error rate for the process being improved. Current conversion rate for AI-assisted workflows (for example, lead-to-opportunity conversion rate before AI scoring). Current customer satisfaction scores for AI-affected customer touchpoints. These numbers must be captured before deployment or they cannot be used as a baseline.
This is the most commonly skipped baseline, and the omission makes quality improvement nearly impossible to prove. The Stanford HAI AI Index consistently notes that across enterprise deployments, organizations still lack standardized approaches to measuring concrete performance gains from AI. This is precisely why pre-deployment baselines are the starting point, not an optional add-on.
How to measure post-deployment: Same metrics, same methodology, same customer segment. The delta is your quality improvement. Convert to dollars where possible: a 2% improvement in close rate on $10M in pipeline is a calculable number. A 5-point improvement in customer satisfaction scores for the customers handled by AI versus a control group is a calculable impact on renewal rates if you have the data.
Common mistake: No pre-AI baseline, so improvements can't be proven. By the time a team wants to show quality improvement, the pre-AI period is gone and can't be reconstructed. If you haven't built measurement infrastructure before deployment, you can't show quality ROI later.
A secondary mistake: measuring the quality of the AI output rather than the quality of the business outcome. An AI that produces accurate summaries is not the same as an AI that improves decision quality. Track the thing that matters downstream, not the AI output itself.
When this dimension matters most: Customer-facing workflows where quality directly affects renewal, expansion, or acquisition. Sales assist tools where proposal or follow-up quality affects win rates. Compliance-adjacent processes where error reduction is a regulatory and financial benefit simultaneously.
Dimension 4: Revenue Impact
What it measures: More deals closed, shorter sales cycles, higher average revenue per user (ARPU), better upsell rates, improved customer retention.
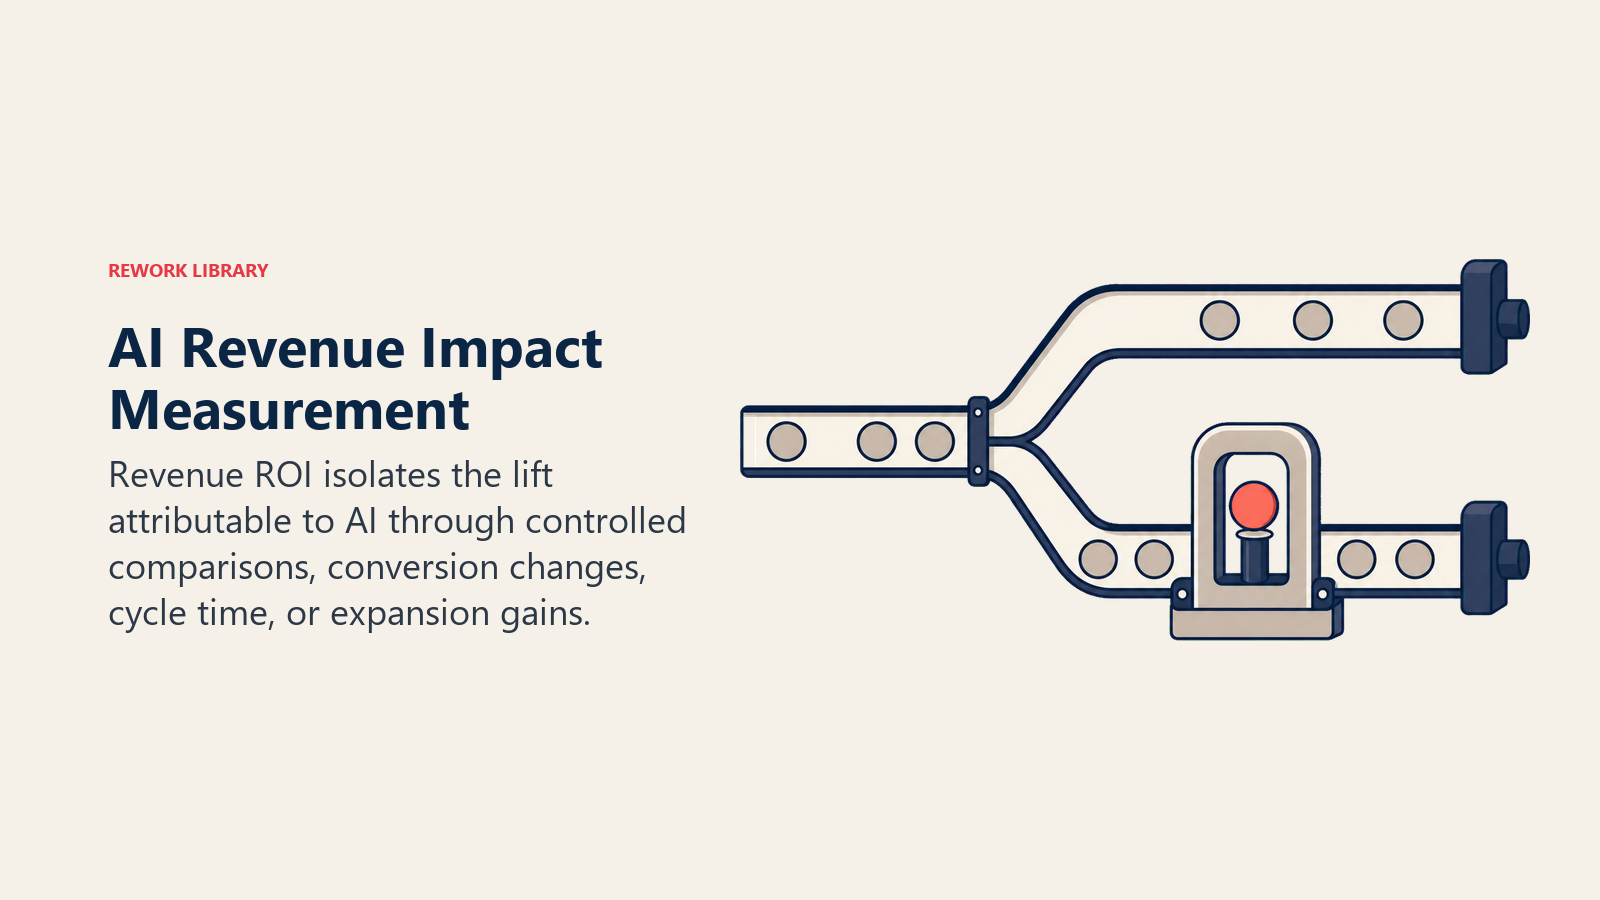
How to baseline before deployment: Current pipeline velocity (days in each stage), win rate by segment, average ARPU for AI-targeted vs. non-AI-targeted customers, customer retention rate for AI-served vs. non-AI-served segments.
How to measure post-deployment: This is the hardest dimension to measure cleanly, because revenue is affected by many variables simultaneously. The honest approach is a controlled experiment: some reps use the AI tool, some don't, and you compare outcomes between the two groups over a meaningful period (at minimum one full sales cycle, ideally one to two quarters).
If a controlled experiment isn't feasible, use pre/post comparison with clear documentation of what else changed during the same period (new rep hires, new territories, product launches, pricing changes). The more confounders you document, the more credible your attribution.
Common mistake: Attributing all revenue gains to AI when multiple factors changed simultaneously. McKinsey's State of AI research tracks the share of organizations reporting measurable revenue impact from AI year over year, and even among mature adopters, clean attribution remains the most-cited measurement challenge. If you deployed AI sales assist in the same quarter you launched a new product, changed your pricing model, and hired three senior reps, the revenue increase cannot be attributed to AI alone. Presenting it as AI ROI is not credible and will damage your credibility with the board and chief financial officer (CFO).
Partial attribution is honest and defensible. "We believe AI contributed X% of the Y% improvement in win rate, based on the controlled comparison between AI-using and non-AI-using reps, with other factors held constant." That's a credible claim. "AI drove a 15% revenue increase" when you can't actually isolate AI's contribution is not.
When this dimension matters most: Sales and revenue operations, where the math between AI investment and pipeline impact is most direct. Customer success, where AI's impact on retention has measurable annual recurring revenue (ARR) implications.
Dimension 5: Risk Reduction
What it measures: Fewer compliance errors, better audit trails, reduced fraud losses, lower legal exposure, reduced cost of error remediation.
How to baseline before deployment: Current compliance incident rate (number of incidents per period), cost of remediation per incident type, fraud loss rate, cost of manual compliance review per period.
How to measure post-deployment: Incident rate, fraud rate, and remediation cost compared to baseline. For AI that improves audit trail completeness or compliance documentation quality, the baseline is the current cost and frequency of compliance failures or gaps.
Common mistake: Treating risk reduction as unquantifiable and therefore leaving it out of the ROI model. Risk reduction often has the clearest dollar value of any ROI dimension, especially in regulated industries. A compliance violation that costs $500,000 in remediation and a $200,000 fine is a very quantifiable risk event. If AI reduces the probability of that event from 3% to 1%, the expected value of risk reduction is (2% x $700,000) = $14,000 per period. That's real money.
For fraud-adjacent processes, the math is often even cleaner. If an anomaly-detection AI reduces fraud losses by a measurable amount, the dollar impact is direct.
When this dimension matters most: Regulated industries (financial services, healthcare, legal) where compliance failures have quantified cost. High-volume transactional processes where fraud or error risk is measurable. Any organization with significant liability exposure for AI-affected decisions. The AI Risk Register: What to Track gives you the scoring format for quantifying risk reduction in board-presentable terms.
The 5-Dimension AI ROI Map
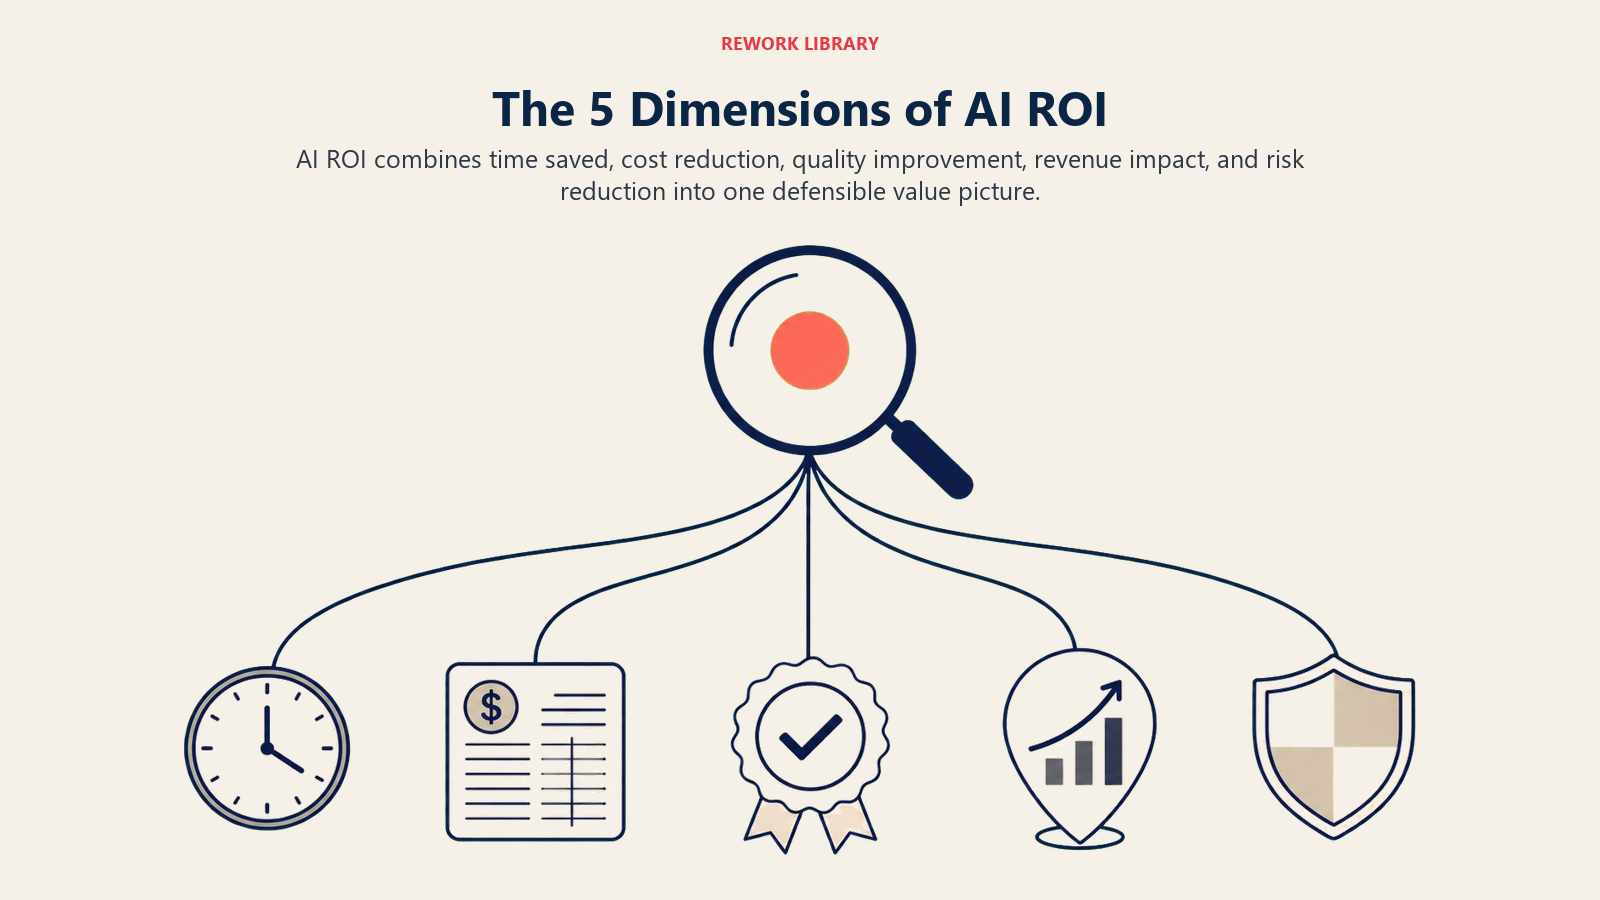
The 5-Dimension AI ROI Map is a measurement framework that replaces single-number ROI reporting with five parallel tracks: Time Saved, Cost Reduction, Quality Improvement, Revenue Impact, and Risk Reduction. Each dimension has a distinct baseline methodology, a distinct dollar-conversion approach, and a distinct set of common measurement mistakes. Presenting all five together gives boards and CFOs the complete value picture that single-dimension reporting always obscures.
Quotable: "Organizations that measure only time saved from AI will systematically underreport value, because McKinsey research shows 75% of generative AI's total annual value concentrates in quality and revenue dimensions, not productivity hours."
Quotable: "A controlled experiment comparing AI-using and non-AI-using reps over one full sales cycle is the minimum credible standard for attributing revenue gains to AI. Anything less is correlation dressed as causation."
Quotable: "Risk reduction is often the clearest ROI dimension of any, especially in regulated industries. A compliance violation costing $700,000 in remediation and fines, reduced from 3% to 1% probability by AI, is worth $14,000 per period in expected-value terms."
| ROI Dimension | Primary Metric | Dollar Conversion Method | Source |
|---|---|---|---|
| Time Saved | Hours/week per user | Blended hourly rate x hours saved | Company time-tracking |
| Cost Reduction | Tool spend, FTE growth rate | Actual spend delta + avoided hires | Finance/HR data |
| Quality Improvement | Error rate, conversion rate, CSAT | Close-rate delta x pipeline value | CRM + support data |
| Revenue Impact | Win rate, ARPU, retention | Controlled A/B comparison | Sales/CS reporting |
| Risk Reduction | Incident rate, fraud loss | Expected value: probability x cost per event | Compliance/risk log |
Rework Analysis: Based on enterprise AI benchmarks, organizations that baseline all five dimensions before deployment are significantly more likely to sustain AI budget approval beyond the first year. Single-dimension ROI reports rarely survive a second board review, because the CFO will ask which dimensions were not measured. Building the full five-dimension model upfront is not extra work. It is the minimum credible standard.
Building the 5-dimension ROI model
The model becomes useful when each dimension is weighted by the business case instead of treated as an equal reporting category.
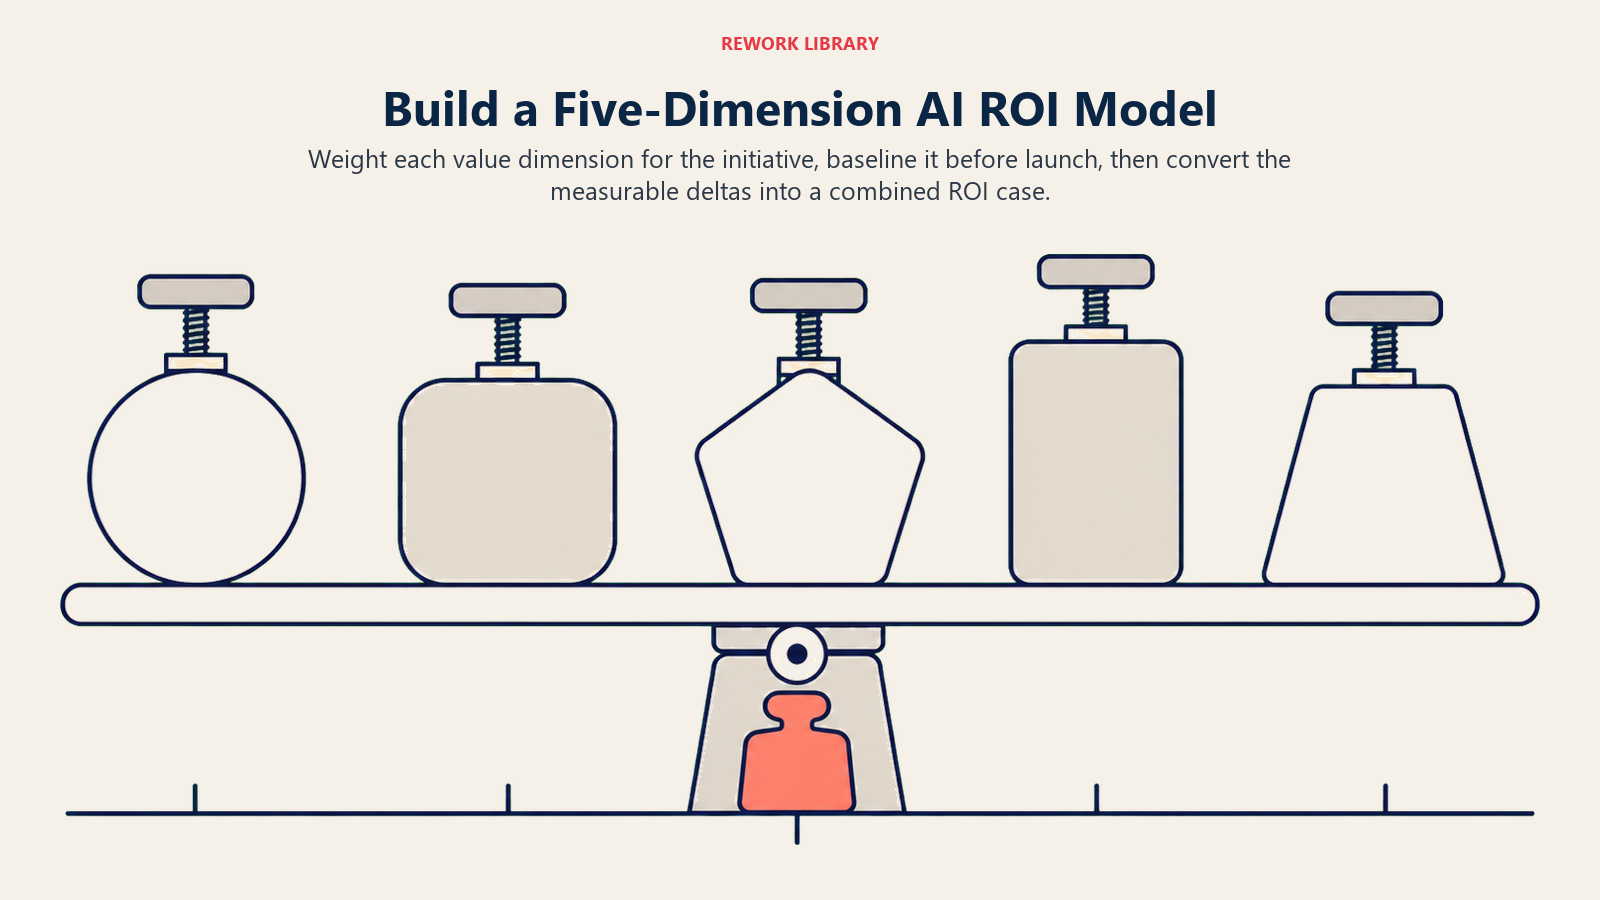
Weighting the dimensions depends on your business type and the AI initiative being evaluated.
For a sales-focused initiative, revenue impact and time saved deserve the most weight, with quality improvement as a validation metric. Cost reduction and risk reduction are secondary.
For a compliance or operations initiative, risk reduction and quality improvement deserve the most weight, with time saved as a secondary efficiency gain. Revenue impact may be indirect.
For a customer success initiative, quality improvement (customer satisfaction, Net Promoter Score, renewal rate) and revenue impact (retention, expansion) are primary. Time saved is secondary.
Not every initiative will show measurable improvement on all five dimensions. Most AI pilots, if you're honest about this, only show clear impact on one or two dimensions in the first six to twelve months. That's normal. It doesn't mean the investment is wrong. It means your measurement infrastructure needs time to capture the full picture.
Which brings us to the board presentation.
Presenting AI ROI to the board
Board communication requires a defensible structure that shows financial impact, risk control, and operational evidence in one view.
The board wants three things, in order.
First: Is the investment returning value that's proportionate to cost? Present total cost (licensing, implementation, oversight, maintenance) versus measurable benefit across all five dimensions. Be explicit about which dimensions are measured, which are estimated, and which aren't yet visible.
Second: Are we learning? Show measurement progress over time. If you started measuring only time saved and have now added quality metrics and a revenue attribution experiment, that's evidence of a maturing program. Boards are patient with investment programs that are building measurement rigor over time. They're not patient with programs that claim ROI without measurement.
Third: What's the plan for the next investment decision? The board doesn't want a look-back. They want to know whether to keep investing, scale, or redirect. Frame the ROI presentation as: here's what we've proven, here's what we're still testing, and here's the investment recommendation based on current evidence.
What the board doesn't want, even if you're tempted to give it to them: a single ROI number that obscures all five dimensions into a misleading summary. "Our AI program delivered 300% ROI" with no dimension breakdown is not credible to a sophisticated board. A five-dimension model with honest caveats is.
The prerequisite everything else depends on
Before any of this framework functions, you need baselines. Captured before deployment, using the same methodology you'll use post-deployment, for each dimension you plan to measure.
Skipping baselines is the single most common reason AI programs can't show ROI. Not because the AI isn't working. Because there's nothing to compare it to.
Read Why AI ROI Is Hard to Prove before presenting your first ROI report to the board. The structural challenges it documents are real, and understanding them will help you present a more credible picture than the team that claims easy ROI without acknowledging the measurement difficulty.
The CFO Conversation on AI Budget covers how to translate the five dimensions into a budget discussion. And ROI by ACE Capability connects each ACE capability (Ingest, Analyze, Predict, Generate, Execute) to the ROI dimensions where it's most likely to show impact.
Measure all five. Be honest about which ones you can and can't demonstrate yet. And start the baselines before you deploy.
Frequently Asked Questions
What are the 5 dimensions of AI ROI?
The five dimensions are Time Saved, Cost Reduction, Quality Improvement, Revenue Impact, and Risk Reduction. Each requires its own baseline methodology and dollar-conversion approach. Most organizations measure only one or two, which causes them to either overstate or understate the full value of their AI investment.
Why is single-dimension AI ROI misleading?
An AI tool that saves 20 hours per week may look excellent on a time-saved dashboard, but if it increases the error rate in outputs, it could be a net negative investment. Conversely, a tool that improves decision quality by 12% without saving measurable hours looks useless on a productivity metric but may be one of the best investments of the year. Only the five-dimension view reveals the true picture.
Which AI ROI dimension is hardest to measure?
Revenue impact is consistently the hardest to measure cleanly, because revenue is affected by many variables simultaneously. The minimum credible approach is a controlled experiment comparing AI-using and non-AI-using employees over at least one full sales or service cycle, with all other significant changes documented as confounders.
How many organizations can actually measure AI ROI?
Only 29% of executives say they can reliably measure return on AI investment, even though 86% of enterprises increased AI budgets in 2025, according to Deloitte research. More than half of finance executives cannot clearly demonstrate ROI from their AI or generative AI initiatives.
What is the most commonly skipped baseline?
Quality improvement baselines are skipped most often. Teams realize they want to show quality ROI after deployment, when the pre-AI period is gone and cannot be reconstructed. Capturing error rates, conversion rates, and customer satisfaction scores before deployment is the prerequisite that makes quality ROI visible later.
How should AI ROI be presented to a board?
Present three things in order: whether the investment returns value proportionate to cost (with explicit dimensions), whether measurement rigor is improving over time, and what the evidence supports for the next investment decision. A five-dimension model with honest caveats is more credible to a sophisticated board than a single rolled-up ROI number.
What is the average ROI from enterprise AI?
Companies that successfully move AI from pilots to production scale report average returns of 1.7x, with cost savings of 26-31% in supply chain, finance, and operations, according to Deloitte benchmarks. However, only 25% of AI initiatives deliver expected ROI, and achieving those returns typically takes two to four years rather than the 7-12 months expected for most technology investments.

Co-Founder, Rework.com
On this page
- Why single-dimension ROI misleads
- Dimension 1: Time Saved
- Dimension 2: Cost Reduction
- Dimension 3: Quality Improvement
- Dimension 4: Revenue Impact
- Dimension 5: Risk Reduction
- The 5-Dimension AI ROI Map
- Building the 5-dimension ROI model
- Presenting AI ROI to the board
- The prerequisite everything else depends on