Bahasa Indonesia
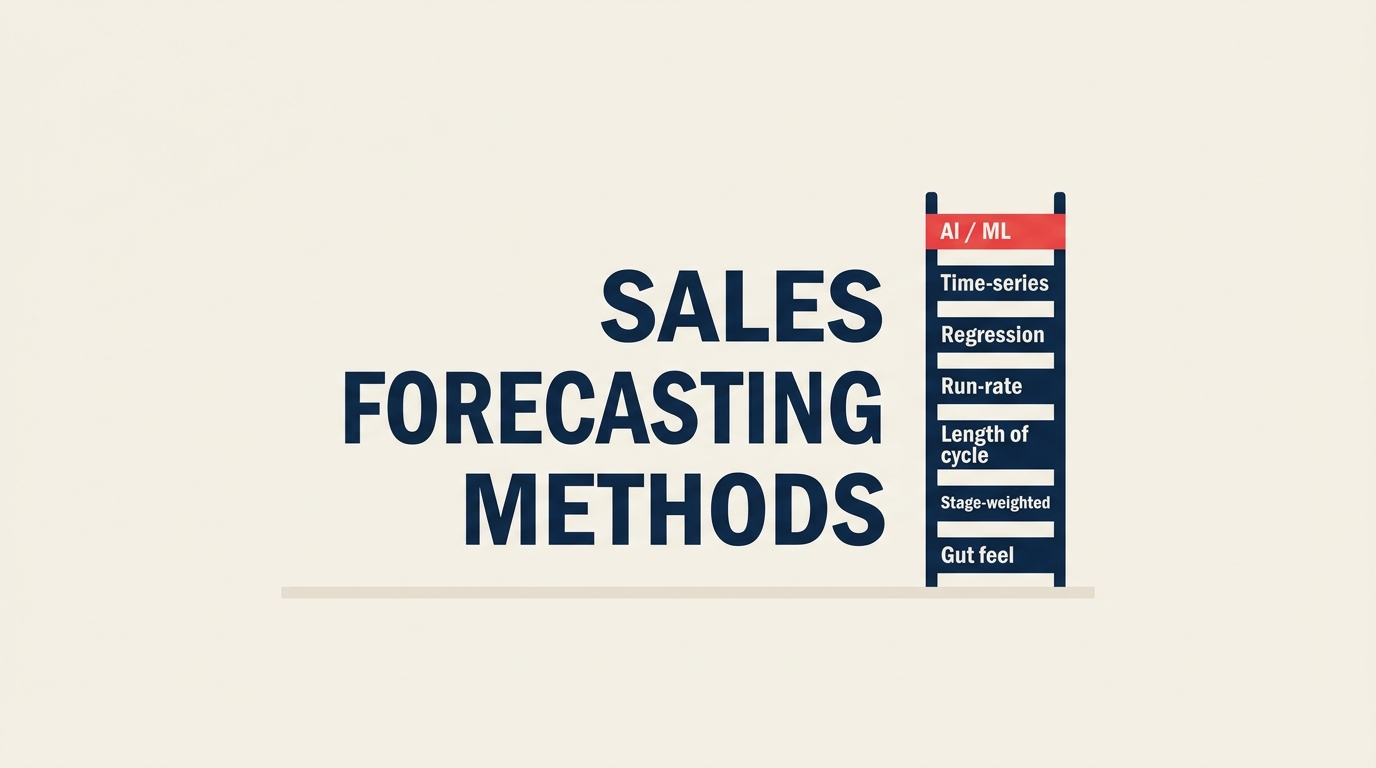
Metode Prakiraan Penjualan: 7 Pendekatan Dibandingkan
Turn this article into takeaways for your work.
Each assistant summarizes the article only for you and suggests best practices for your work.
Metode prakiraan penjualan adalah kerangka analitis yang digunakan tim Anda untuk memprediksi berapa banyak pendapatan yang akan ditutup dalam periode tertentu. Memilih yang salah tidak hanya memberi Anda angka yang buruk. Dampaknya meluas ke keputusan perekrutan, perencanaan arus kas, dan kredibilitas di hadapan dewan.
Artikel ini menguraikan semua tujuh metode: data apa yang dibutuhkan masing-masing, di mana metode itu berhasil, di mana ia gagal, dan cara memadukan seiring operasi Anda semakin matang.
Apa Itu Prakiraan Penjualan?
Prakiraan penjualan adalah estimasi terstruktur pendapatan yang diharapkan ditutup oleh tim Anda selama periode tertentu: seminggu, sebulan, satu kuartal, atau setahun.
Satu kalimat itu terdengar sederhana. Namun prakiraan melakukan banyak pekerjaan berat dalam praktiknya. Keuangan menggunakannya untuk merencanakan arus kas dan jumlah karyawan. Operasional menggunakannya untuk menetapkan kuota dan target wilayah. Eksekutif menggunakannya untuk pelaporan dewan dan panggilan investor. Marketing menggunakannya untuk menentukan anggaran demand-gen. Ketika prakiraan secara konsisten meleset, keputusan hilir itu memperparah kegagalan.
Memahami dasar-dasar prakiraan Anda sebelum memilih metode lebih penting dari yang disadari kebanyakan tim. Metode yang berhasil untuk tim SMB dengan 20 tenaga penjual bisa runtuh dengan 200 tenaga penjual yang memiliki siklus deal enterprise.
Fakta Utama
- Survei CSO 2024 Gartner menemukan bahwa kurang dari 25% organisasi penjualan mencapai akurasi prakiraan dalam 5% secara konsisten.
- B2B Revenue Waterfall dari Forrester adalah model yang paling banyak dikutip untuk prakiraan stage-weighted, membentuk cara sebagian besar CRM menetapkan nilai probabilitas default (Forrester, 2023).
- Laporan State of Sales Salesforce 2024 menemukan 67% pemimpin penjualan berencana meningkatkan investasi AI untuk prakiraan dalam 12 bulan ke depan.
7 Metode Prakiraan Penjualan
1. Gut feel tenaga penjual (berbasis opini)
Setiap tenaga penjual memberitahu manajer mereka apa yang mereka perkirakan akan ditutup periode ini. Manajer mengumpulkan estimasi tersebut. Tidak ada formula, tidak ada penarikan data. Hanya penilaian.
Kapan berhasil: Perusahaan tahap awal dengan kurang dari 10 tenaga penjual dan deal high-touch berbasis hubungan di mana tenaga penjual benar-benar mengetahui jadwal pembeli.
Kapan gagal: Organisasi mana pun dengan lebih dari 15-20 tenaga penjual, di mana bias optimisme individual berakumulasi menjadi prakiraan yang secara struktural menggelembung. Juga gagal ketika tenaga penjual memiliki insentif pribadi untuk sandbagging atau melebih-lebihkan.
Contoh mini: Startup SaaS dengan 6 karyawan di tahun pertamanya. Pemimpin penjualan berbicara dengan setiap tenaga penjual pada hari Jumat dan membangun angka bulan depan dari panggilan tersebut. Cepat dan berhasil. Sampai jumlah karyawan tiga kali lipat.
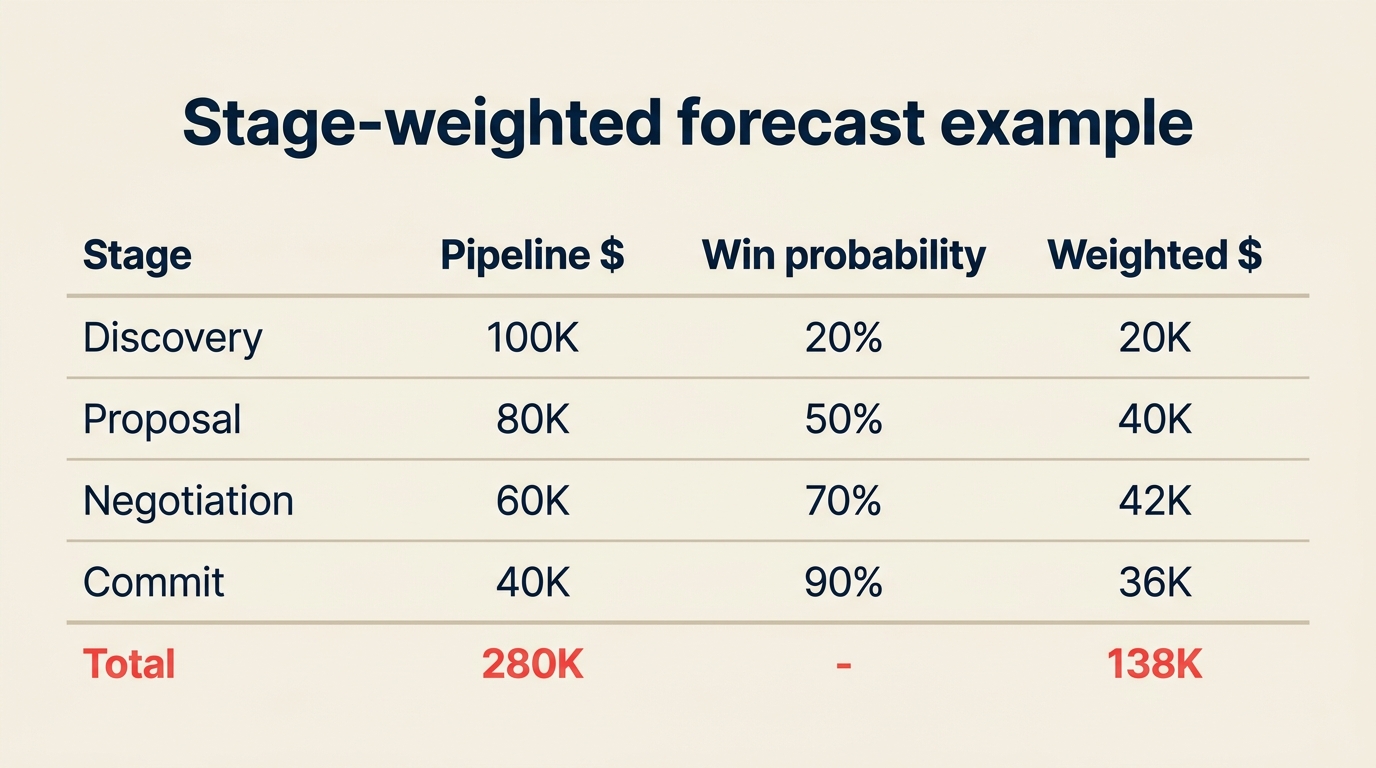
2. Pipeline berbobot tahap (pipeline x probabilitas)
Setiap deal terbuka dikalikan dengan probabilitas yang ditetapkan untuk tahap saat ini. Jumlahkan nilai-nilai berbobot itu dan Anda mendapatkan prakiraan.
Prakiraan = Jumlah (Nilai Deal x Probabilitas Tahap)
Ini adalah metode default yang dibangun ke dalam sebagian besar CRM. Probabilitas tahap ditetapkan oleh admin (khusus) atau ditarik dari win rate historis per tahap.
Kapan berhasil: Tim dengan proses penjualan yang terdefinisi dan deal yang cukup untuk membuat probabilitas tingkat tahap bermakna. Cepat, transparan, dan mudah dijelaskan kepada VP.
Kapan gagal: Ketika probabilitas tahap ditetapkan sekali dan tidak pernah diperbarui. Tahap "Proposal" dengan probabilitas 50% mungkin berjalan pada 30% berdasarkan kemenangan terbaru. Juga gagal ketika tenaga penjual memanipulasi pipeline dengan menjaga deal di tahap probabilitas rendah untuk mengelola ekspektasi.
Contoh mini: Anda memiliki $280 ribu dalam pipeline terbuka. $100 ribu ada di Discovery (probabilitas 20%), $80 ribu di Proposal (50%), $60 ribu di Negosiasi (70%), dan $40 ribu di Commit (90%). Prakiraan stage-weighted Anda adalah $138 ribu. Itulah angka yang Anda bawa ke tinjauan pendapatan mingguan.
Lihat pipeline vs prakiraan untuk pandangan lebih mendalam tentang mengapa total pipeline dan prakiraan adalah metrik berbeda yang menjawab pertanyaan berbeda.
3. Panjang siklus (rata-rata waktu historis untuk menutup)
Anda menghitung waktu rata-rata yang diperlukan deal untuk berpindah dari pembuatan (atau tonggak utama seperti "Qualified") ke penutupan. Kemudian Anda menyaring pipeline untuk deal yang terlambat vs. on-track dan memberikan bobot yang sesuai.
Kapan berhasil: Bisnis transaksional dengan siklus deal yang pendek dan dapat diprediksi di mana waktu adalah variabel utama. Juga berguna sebagai sanity check terhadap angka stage-weighted.
Kapan gagal: Deal enterprise kompleks di mana deal yang terlambat 30 hari mungkin masih sehat, dibandingkan dengan deal transaksional di mana terlambat 5 hari sudah berisiko.
Contoh mini: Rata-rata siklus deal Anda adalah 45 hari. Anda memiliki deal yang dibuat 60 hari lalu yang masih dalam Proposal. Logika panjang siklus menandainya sebagai berisiko dan mendiskonnya lebih agresif dari yang disarankan probabilitas tahapnya saja.
4. Tren historis / run-rate
Anda mengambil pendapatan closed-won terbaru dan memproyeksikannya ke depan. Jika Anda menutup $300 ribu kuartal lalu dan bisnis tumbuh 10% QoQ, Anda memperkirakan $330 ribu untuk kuartal berikutnya.
Kapan berhasil: Bisnis yang stabil dan matang dengan kinerja yang konsisten. Cepat diproduksi dan mudah dipertahankan ketika tingkat pertumbuhan dasarnya stabil.
Kapan gagal: Fase pertumbuhan tinggi, bisnis musiman, atau periode apa pun ketika pasar sedang bergeser. Run-rate adalah indikator lagging. Ini memberi tahu Anda di mana Anda telah berada, bukan ke mana pipeline membawa Anda.
Contoh mini: Perusahaan SaaS dengan ARR $10 juta dan pertumbuhan QoQ yang konsisten 8% membangun prakiraan dewan menggunakan run-rate sebagai lantai, kemudian menambahkan kecerdasan pipeline untuk menetapkan batasnya.
5. Analisis regresi
Anda membangun model statistik yang mengkorelasikan input pipeline historis (volume lead, tahap deal, ukuran deal, tenaga penjual, lini produk) dengan pendapatan yang sebenarnya ditutup. Model mempelajari koefisien dan menerapkannya pada data pipeline saat ini.
Kapan berhasil: Organisasi dengan data CRM yang bersih selama 12 bulan atau lebih dan analis yang dapat membangun serta memelihara model. Regresi menangkap pola yang tidak jelas, seperti fakta bahwa deal dengan dua pemangku kepentingan eksekutif ditutup pada tingkat 2x dari deal dengan satu pemangku kepentingan.
Kapan gagal: Dataset kecil (kurang dari 200-300 deal yang ditutup), data CRM yang kotor, atau tim yang tidak dapat menjelaskan model kepada CRO mereka. "Model yang menyatakannya" bukan jawaban yang cukup ketika dewan bertanya mengapa Anda meleset 20%.
Contoh mini: Tim revenue ops menjalankan regresi berganda pada 18 bulan deal yang ditutup dan menemukan bahwa deal dengan rencana penutupan bersama yang disepakati pada hari ke-10 tahap Proposal ditutup pada 78% vs. 31% tanpa rencana tersebut. Mereka menambahkannya sebagai input berbobot ke model prakiraan mereka.
6. Time-series (misalnya ARIMA, exponential smoothing)
Model time-series memperlakukan riwayat pendapatan Anda sebagai urutan dan mencari pola: tren, musiman, dan siklus. ARIMA (AutoRegressive Integrated Moving Average) dan exponential smoothing adalah varian yang paling umum.
Kapan berhasil: Bisnis transaksional bervolume tinggi dengan musiman yang jelas (ritel, e-commerce, inside sales dengan ribuan deal per kuartal). Model membutuhkan banyak titik data untuk mengidentifikasi pola secara andal.
Kapan gagal: Penjualan enterprise dengan jumlah deal kecil dan kuartal yang tidak merata. Satu deal enterprise $2 juta yang ditutup atau tergelincir membuat sinyal time-series menjadi tidak berarti. Juga gagal di pasar dengan pergeseran struktural (kompetitor baru, perubahan produk) karena model hanya bisa melihat ke belakang.
Contoh mini: Perusahaan SaaS dengan 500 deal SMB lebih per bulan menggunakan ARIMA untuk memperkirakan pendapatan langganan bulanan dengan akurasi 92%, menangkap lonjakan pembelian akhir tahun Q4 yang akan dilewatkan oleh model run-rate sederhana.
7. Prakiraan AI / ML
Model machine learning menyerap sinyal dari CRM, aktivitas email, rekaman panggilan, data kalender, dan sumber eksternal (putaran pendanaan perusahaan, posting pekerjaan, data niat) untuk menghasilkan prakiraan tingkat deal dan agregat. Alat seperti Clari, Gong Forecast, dan Salesforce Einstein Revenue Intelligence masuk dalam kategori ini.
Kapan berhasil: Organisasi dengan data CRM yang bersih, riwayat deal yang ditutup selama 12 bulan atau lebih, dan volume deal yang cukup untuk melatih model. Implementasi terbaik menghasilkan skor tingkat deal (bukan hanya angka teratas) sehingga tenaga penjual dan manajer dapat bertindak berdasarkan sinyal.
Kapan gagal: Kebersihan CRM yang buruk menghilangkan keunggulan sinyal. Tim kecil tidak memiliki volume data untuk melatih model yang bermakna. Dan model black-box yang tidak dapat menjelaskan prediksinya menciptakan ketidakpercayaan terhadap prakiraan.
Contoh mini: Organisasi penjualan enterprise dengan 150 tenaga penjual menggunakan lapisan prakiraan AI di atas CRM mereka. Model menandai 12 deal dalam kategori "Commit" sebagai berisiko berdasarkan penurunan tingkat respons email dan tidak ada kontak eksekutif-ke-eksekutif terbaru. Tiga dari 12 deal itu akhirnya tergelincir. Tim dapat mengintervensi dua di antaranya.
Tinjau kategori prakiraan untuk memahami bagaimana bucket commit, best case, dan pipeline berinteraksi dengan skor deal yang dihasilkan AI.
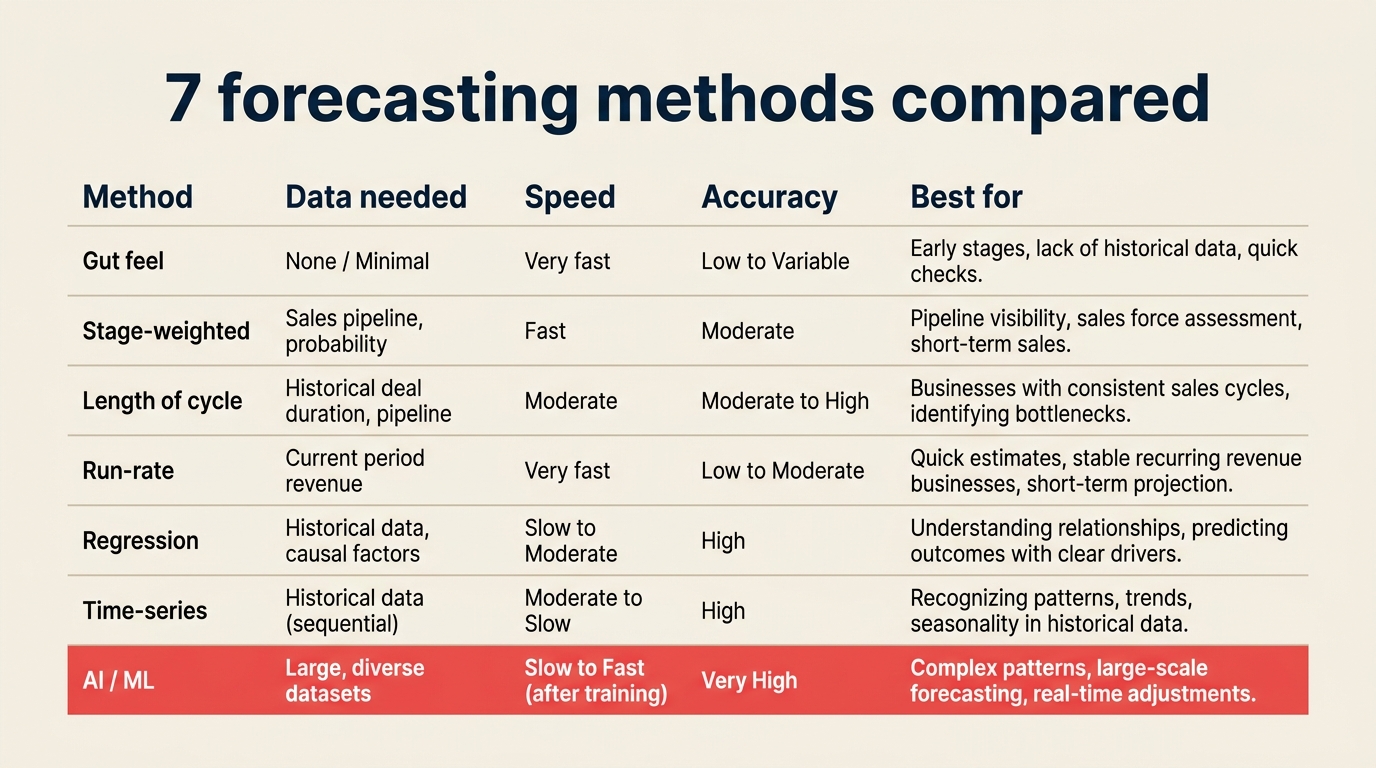
Perbandingan Metode Sekilas
| Metode | Data yang dibutuhkan | Kecepatan | Akurasi | Paling cocok untuk |
|---|---|---|---|---|
| Gut feel tenaga penjual | Tidak ada | Instan | Rendah | Tahap awal, <10 tenaga penjual |
| Stage-weighted | Tahap CRM + probabilitas | Cepat | Sedang | Tim dengan proses penjualan terdefinisi |
| Panjang siklus | Rata-rata waktu deal historis | Cepat | Sedang | Transaksional, siklus pendek |
| Historis / run-rate | Pendapatan yang ditutup sebelumnya | Sangat cepat | Sedang (pasar stabil) | Bisnis matang dan dapat diprediksi |
| Regresi | Data CRM bersih 12 bulan atau lebih | Lambat (bangun) / cepat (jalankan) | Tinggi | Tim ops mid-market dengan analis |
| Time-series | Riwayat transaksi bervolume tinggi | Sedang | Tinggi (pasar stabil) | SMB / aliran deal bervolume tinggi |
| AI / ML | CRM + aktivitas + sinyal eksternal | Cepat (inferensi) | Tertinggi | Tim besar, data kaya, anggaran alat |
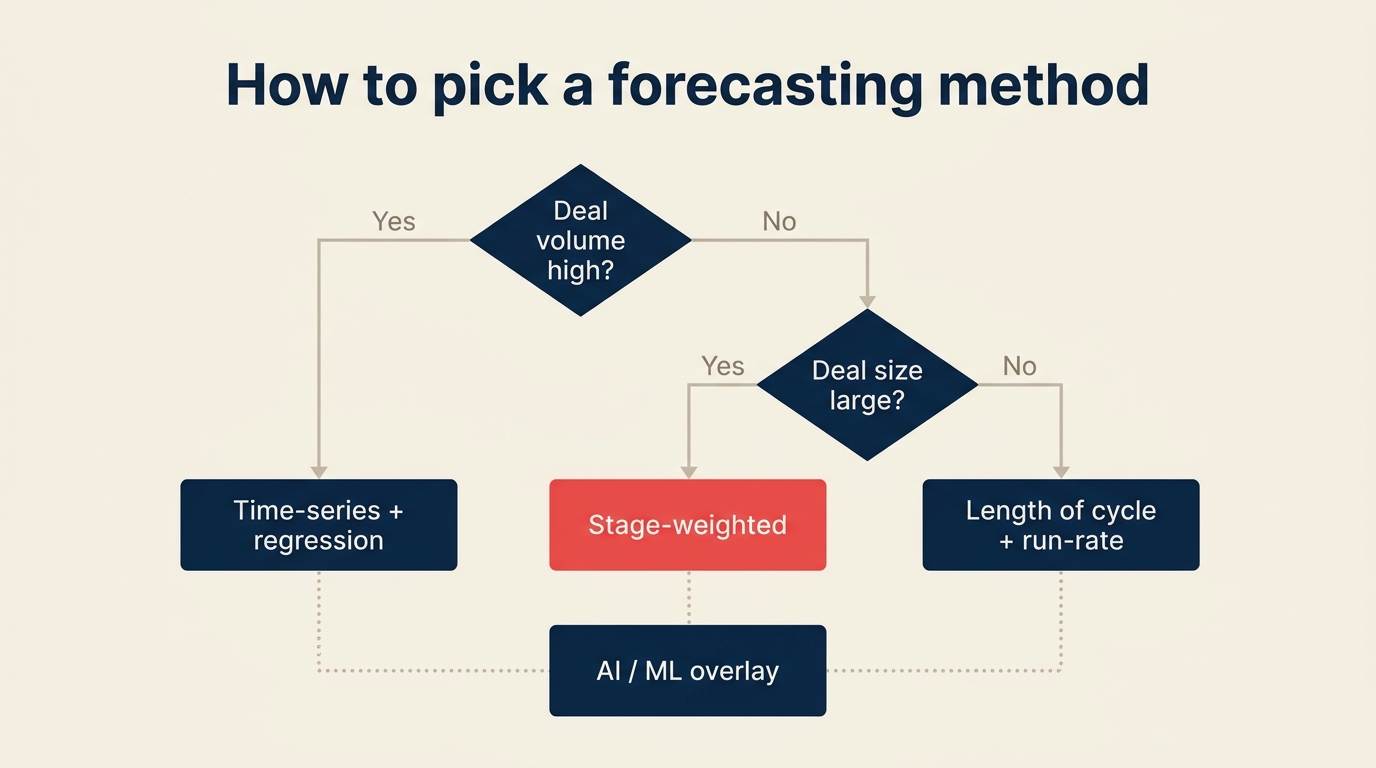
Cara Memilih Metode yang Tepat (Alur Keputusan)
Mulai dengan dua pertanyaan sebelum memilih metode:
Pertanyaan 1: Berapa banyak deal yang Anda tutup per kuartal? Jika Anda menutup lebih dari 100 deal per kuartal, metode time-series dan regresi dapat menemukan sinyal dalam volume. Di bawah ambang itu, Anda tidak memiliki cukup data untuk membuat metode statistik dapat diandalkan.
Pertanyaan 2: Berapa rata-rata ukuran deal Anda? Deal enterprise dengan ASP tinggi ($50 ribu lebih) bersifat tidak merata. Satu deal yang masuk atau keluar secara signifikan mengubah angka. Tim tersebut membutuhkan metode stage-weighted atau length-of-cycle (visibilitas tingkat deal). Tim transaksional dengan ASP rendah dapat lebih mengandalkan model agregat.
Logika routing:
- Volume tinggi + ASP rendah: time-series sebagai basis, regresi sebagai lapisan
- Volume rendah + ASP tinggi: stage-weighted sebagai basis, length-of-cycle sebagai sanity check
- Tim mana pun dengan anggaran alat dan data yang bersih: overlay AI / ML di atas metode basis
- Tahap awal / tidak ada data: mulai dengan stage-weighted dan lacak aktual vs. prakiraan secara ketat agar Anda membangun dataset yang akan Anda butuhkan nanti
Cara Menggabungkan Metode (Prakiraan Campuran)
Tim pendapatan yang matang tidak memilih satu metode dan berhenti di situ. Mereka menjalankan dua atau tiga secara paralel dan menimbang hasilnya.
Pendekatan campuran yang umum: pipeline stage-weighted memberi Anda pandangan bottom-up tingkat deal. Tren run-rate memberi Anda pandangan top-down berbasis momentum. Ketika kedua angka tersebut menyimpang secara signifikan (lebih dari 15%), penyimpangan itu sendiri adalah sinyal yang layak diselidiki. Entah pipeline secara tidak biasa kuat atau lemah relatif terhadap riwayat terkini, atau data CRM sudah usang.
Lapisan skor AI berada di atas salah satu metode, menandai deal spesifik yang diperlakukan angka agregat sebagai on-track tetapi sinyal perilaku mengatakan berisiko.
Tujuannya bukan untuk merata-rata metode secara mekanis. Ini menggunakan masing-masing untuk menguji yang lain.
Melacak kecepatan pipeline bersama prakiraan Anda memberi Anda indikator leading. Ketika kecepatan turun, prakiraan masa depan Anda akan turun sebelum angka stage-weighted menunjukkannya.
Cara Mengukur Akurasi Prakiraan
Dua formula yang penting di sini:
MAPE (Mean Absolute Percentage Error):
MAPE = mean(|Aktual - Prakiraan| / Aktual) x 100
MAPE memberi tahu Anda seberapa jauh meleset rata-rata, sebagai persentase. MAPE sebesar 8% berarti prakiraan Anda meleset sekitar 8% rata-rata, dalam kedua arah.
Bias Prakiraan:
Bias = mean(Prakiraan - Aktual)
Bias positif berarti Anda secara konsisten over-forecast. Negatif berarti Anda secara konsisten under-forecast. Keduanya adalah masalah, namun merupakan masalah yang berbeda. Over-forecast yang konsisten mengikis kepercayaan dan mengarah pada over-hiring. Under-forecast yang konsisten menyebabkan under-resourcing dan pertumbuhan yang terlewat.
Contoh tabel akurasi:
| Kuartal | Prakiraan | Aktual | Kesalahan % |
|---|---|---|---|
| Q1 | $2,1 juta | $1,95 juta | +7,7% |
| Q2 | $2,3 juta | $2,35 juta | -2,1% |
| Q3 | $2,5 juta | $2,2 juta | +13,6% |
| Q4 | $2,4 juta | $2,45 juta | -2,0% |
MAPE = (7,7 + 2,1 + 13,6 + 2,0) / 4 = 6,4%
Bias = (+0,15 juta - 0,05 juta + 0,30 juta - 0,05 juta) / 4 = +$87,5 ribu (kecenderungan over-forecast ringan)
Lihat akurasi prakiraan untuk panduan mendalam tentang melacak dan meningkatkan metrik ini dari waktu ke waktu.
Kadensa Prakiraan: Mingguan, Bulanan, Kuartalan
Kadensa yang berbeda melayani tujuan yang berbeda dan cocok untuk metode yang berbeda:
Mingguan: Pipeline stage-weighted atau skor deal AI. Tujuannya adalah menandai deal yang masuk atau keluar dari kategori commit, bukan memperkirakan ulang seluruh kuartal. Visibilitas tingkat tenaga penjual, tindakan manajer.
Bulanan: Pemeriksaan tren run-rate terhadap aktual kuartal sampai saat ini. Apakah kecepatan pemesanan konsisten dengan mencapai target kuartalan? Ini juga saat Anda memperbarui probabilitas tahap jika Anda melacak aktual per tahap.
Kuartalan: Prakiraan penuh. Gunakan metode campuran (model basis + overlay), sajikan interval kepercayaan, dan dokumentasikan asumsi di balik angka. Ini adalah prakiraan yang dilihat dewan.
Skor kualifikasi kerangka BANT adalah salah satu input berguna untuk roll-up bulanan dan kuartalan. Deal yang mendapat skor baik saat masuk tetapi sejak itu diam adalah kandidat untuk penurunan.
Kesalahan Prakiraan yang Umum
- Menetapkan probabilitas tahap sekali dan melupakannya. Win rate berubah. Probabilitas Proposal 50% yang ditetapkan dua tahun lalu mungkin 30% hari ini jika Anda telah naik segmen pasar.
- Memperlakukan prakiraan sebagai komitmen daripada estimasi. Ketika tenaga penjual tahu angka prakiraan akan dijadikan tanggung jawab pribadi mereka, mereka melakukan sandbagging. Prakiraan kehilangan sinyal.
- Mengabaikan usia deal. Deal pada Proposal yang sudah berada di sana selama 90 hari dalam siklus rata-rata 45 hari tidak sama dengan yang baru masuk Proposal minggu lalu. Logika length-of-cycle ada untuk alasan ini.
- Prakiraan dari pipeline yang belum dibersihkan. Deal zombie (tidak ada aktivitas dalam 60 hari lebih, tidak ada pembaruan tanggal penutupan) menggelembungkan angka stage-weighted. Inspeksi deal yang teratur adalah prasyarat untuk prakiraan yang bersih.
- Terlalu mengandalkan label kategori commit. "Commit" berarti hal yang berbeda bagi tenaga penjual yang berbeda. Tanpa definisi bersama dan proses inspeksi deal, bucket commit hanyalah bentuk lain dari gut feel.
- Tidak ada post-mortem setelah kegagalan. Jika Anda tidak melacak apa yang menyebabkan kegagalan (deal tergelincir, deal hilang, deal baru ditambahkan terlambat), Anda tidak dapat memperbaiki kesalahan sistematis.
Pertanyaan yang Sering Diajukan
Apa metode prakiraan penjualan yang paling akurat? Untuk sebagian besar tim mid-market dan enterprise, model campuran yang menggunakan pipeline stage-weighted sebagai basis dan overlay AI/ML menghasilkan akurasi tertinggi. Survei CSO Gartner 2024 menemukan bahwa prakiraan berbantuan AI meningkatkan akurasi sebesar 10-20 poin persentase dalam organisasi dengan data CRM yang bersih dan riwayat 12 bulan atau lebih. Namun akurasi bergantung pada kualitas data terlebih dahulu. Metode canggih yang diterapkan pada data kotor akan kalah dari metode sederhana yang diterapkan pada data bersih.
Apa itu prakiraan stage-weighted? Prakiraan stage-weighted mengalikan nilai setiap deal terbuka dengan probabilitas yang ditetapkan untuk tahap pipeline saat ini. Misalnya, deal $100 ribu di tahap Proposal dengan probabilitas 50% berkontribusi $50 ribu pada prakiraan. Jumlahkan semua nilai deal berbobot dan Anda mendapatkan total angka prakiraan. Ini adalah metode default di sebagian besar CRM dan pendekatan yang paling banyak digunakan dalam penjualan B2B.
Bagaimana AI mengubah prakiraan penjualan? Alat prakiraan AI melampaui probabilitas tahap. Mereka menyerap sinyal perilaku (tingkat balasan email, frekuensi pertemuan, keterlibatan pemangku kepentingan, unduhan kontrak) dan menetapkan skor risiko tingkat deal. Mereka juga dapat mendeteksi pola di ribuan deal historis yang akan dilewatkan analis manusia, seperti fakta bahwa deal dengan urutan aktivitas tertentu (panggilan discovery + demo + tinjauan keamanan) ditutup pada tingkat 2x dari jalur lain. Keterbatasannya adalah kualitas data: model AI membutuhkan setidaknya 12 bulan data CRM yang bersih dan terstruktur untuk menghasilkan sinyal yang andal.
Bagaimana cara menghitung akurasi prakiraan?
Dua metrik standarnya adalah MAPE dan bias. MAPE mengukur rata-rata persentase kesalahan terlepas dari arah. Bias mengukur apakah Anda secara konsisten over- atau under-forecast. Hitung keduanya di akhir setiap kuartal menggunakan formula: MAPE = mean(|Aktual - Prakiraan| / Aktual) x 100. Sebagian besar organisasi penjualan berkinerja tinggi menargetkan MAPE di bawah 10% pada basis empat kuartal bergulir.
Seberapa sering sebaiknya Anda membuat prakiraan? Sebagian besar tim menjalankan tiga kadensa secara paralel: tinjauan tingkat deal mingguan (menggunakan stage-weighted atau skor AI), pemeriksaan run-rate bulanan terhadap target kuartal, dan prakiraan kuartalan penuh untuk keuangan dan pelaporan dewan. Kadensa mingguan adalah tempat manajer mengambil tindakan; kadensa kuartalan adalah tempat asumsi didokumentasikan dan dipertahankan.
Prakiraan penjualan adalah salah satu disiplin di mana mencapai 80% dari tujuan itu mudah dan 20% terakhir adalah tempat sebagian besar organisasi terhenti. Pilih metode basis yang sesuai dengan kematangan data dan volume deal Anda. Lacak aktual terhadap prakiraan secara ketat. Jalankan post-mortem singkat setelah setiap kuartal. Seiring waktu, data yang Anda kumpulkan memungkinkan Anda beralih ke metode yang lebih canggih. Dan prakiraan mulai melakukan apa yang seharusnya dilakukan: memberikan cukup peringatan dini untuk bertindak, bukan hanya angka yang dilaporkan.

Senior Operations & Growth Strategist
On this page
- Apa Itu Prakiraan Penjualan?
- Fakta Utama
- 7 Metode Prakiraan Penjualan
- 1. Gut feel tenaga penjual (berbasis opini)
- 2. Pipeline berbobot tahap (pipeline x probabilitas)
- 3. Panjang siklus (rata-rata waktu historis untuk menutup)
- 4. Tren historis / run-rate
- 5. Analisis regresi
- 6. Time-series (misalnya ARIMA, exponential smoothing)
- 7. Prakiraan AI / ML
- Perbandingan Metode Sekilas
- Cara Memilih Metode yang Tepat (Alur Keputusan)
- Cara Menggabungkan Metode (Prakiraan Campuran)
- Cara Mengukur Akurasi Prakiraan
- Kadensa Prakiraan: Mingguan, Bulanan, Kuartalan
- Kesalahan Prakiraan yang Umum
- Pertanyaan yang Sering Diajukan