Predicción de Churn con IA en Modelos de Suscripción: Indicadores Adelantados, No Rezagados
Turn this article into takeaways for your work.


Each assistant summarizes the article only for you and suggests best practices for your work.
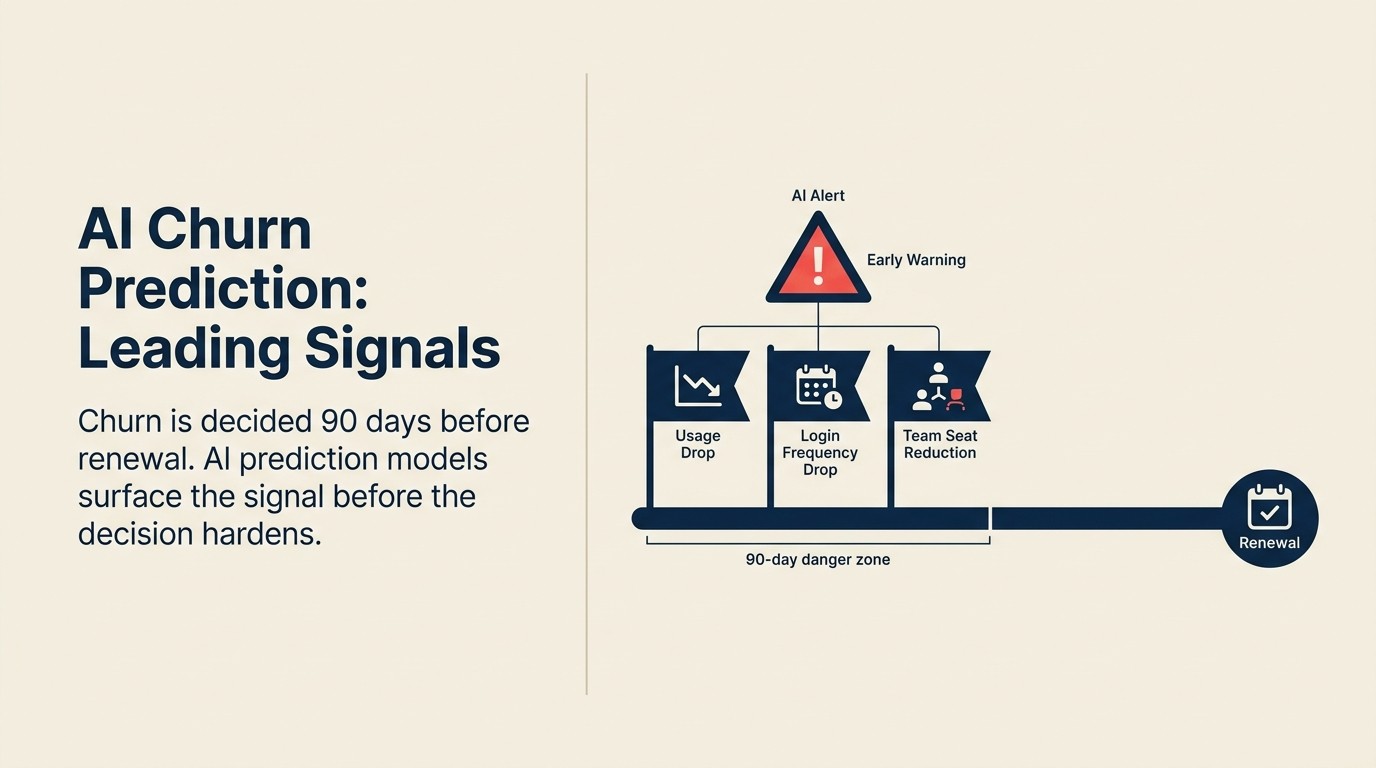
En un negocio de suscripción, el churn no ocurre en la renovación. La decisión de no renovar se toma en algún momento entre los sesenta y noventa días antes de que termine el contrato. Para cuando un cliente envía el email de cancelación o simplemente no responde a su alcance de renovación, la decisión ya está tomada. La conversación en la renovación es una formalidad.
Esto es tanto el problema como la oportunidad. El problema: si solo está prestando atención en la renovación, ya es demasiado tarde. La oportunidad: los negocios de suscripción producen datos de comportamiento continuos que, si sabe cómo leerlos, señalan el churn semanas o meses antes de que se cristalice en una decisión.
La predicción de churn con IA consiste en leer esas señales y actuar sobre ellas antes de que la decisión se consolide.
Por qué el churn en SaaS es estructuralmente más predecible que en otras industrias
La predicción de churn existe en otros sectores. Los bancos modelan la deserción de tarjetas de crédito. Las empresas de telecomunicaciones modelan las cancelaciones de planes. Los minoristas modelan la pérdida de clientes recurrentes. Pero el SaaS tiene una ventaja de datos que esas industrias no tienen.
En una suscripción SaaS, el producto es la relación. Los clientes interactúan con él todos los días. Cada login, cada clic en una función, cada llamada API, cada conexión o desconexión de integración es una señal de comportamiento que le dice algo sobre si este cliente está obteniendo valor de lo que está pagando.
Key Facts: Predicción de Churn con IA en SaaS
- Las empresas SaaS que implementan predicción de churn con IA redujeron el churn bruto en un promedio del 31% en los primeros 12 meses, con un retorno promedio de $4-7 en ingresos protegidos por cada $1 invertido en IA de predicción de churn (análisis de más de 500 empresas SaaS mid-market, Arete, 2025)
- Los modelos de churn avanzados con IA entrenados en más de 80 señales de comportamiento logran una precisión de predicción del 75-82%; las implementaciones que integran análisis de sentimiento basado en LLM alcanzan el 94% de precisión 12-18 meses antes de la renovación (Arete SaaS Research, 2025)
- La tasa de churn mensual mediana para B2B SaaS llegó al 3.5% en 2025 (dividida entre 2.6% voluntario y 0.8% involuntario), lo que significa que la empresa promedio reemplaza el 42% de su ARR (annual recurring revenue) anualmente solo para mantenerse estable (ChartMogul 2025 benchmarks)
Compárelo con un cliente de telecomunicaciones. Los puntos de datos son limitados: ¿pagó su factura, llamó a soporte, actualizó su plan, visitó el sitio web? Los productos SaaS producen cientos a miles de eventos de comportamiento por usuario activo por mes. La investigación sobre modelado de comportamiento para predicción de churn demuestra que las señales de patrón de uso son indicadores tempranos de deserción del cliente, superando a las variables demográficas y transaccionales en precisión predictiva en los modelos de suscripción. Ese volumen de datos de comportamiento continuo es lo que hace que los modelos de predicción de churn en SaaS sean significativamente más precisos que en la mayoría de las otras categorías de suscripción.
La ventaja de telemetría de producto es real. Y las empresas que construyen su predicción de churn sobre ella superan a las empresas que solo dependen de la actividad del CRM.
Pero la ventaja solo importa si sabe qué señales observar.
Categorías de señales para la predicción de churn
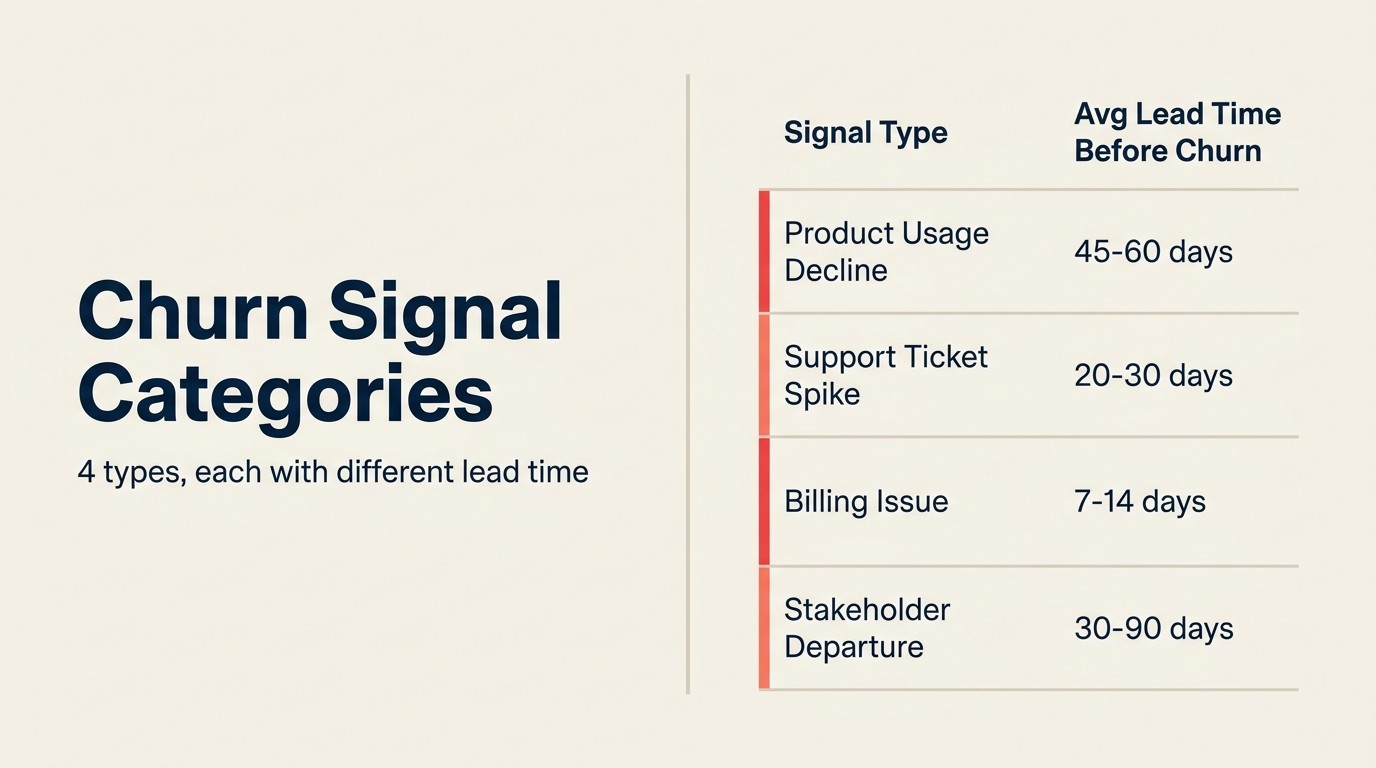
Hay cuatro categorías de señales que aparecen consistentemente en los modelos de predicción de churn de SaaS de alta precisión:
Señales de uso. La frecuencia de login es la más rastreada pero la menos específica. Más informativo: profundidad de adopción de funciones (qué funciones se están usando, no solo si el producto está abierto), tendencias de duración de sesión, ratio de usuarios por plaza (¿cuántas de las plazas licenciadas están realmente activas?) y profundidad del flujo de trabajo (¿están los clientes usando integraciones que integran el producto en su trabajo diario, o lo tratan como una herramienta independiente?). Las señales de uso son indicadores adelantados con un retraso de aproximadamente dos a cuatro semanas: el uso comienza a declinar antes de que el cliente decida conscientemente hacer churn.
Señales de soporte. Un aumento en el volumen de tickets de soporte es un indicador clásico de churn, pero la categoría importa. Los tickets de errores técnicos indican que el producto no les funciona. Los tickets de "cómo hago" indican brechas de onboarding. Las caídas de CSAT (customer satisfaction score) después de las interacciones de soporte son señales directas de satisfacción. Un cliente que envía cinco tickets en un mes y recibe respuestas lentas o poco útiles es un riesgo de churn independientemente de sus tendencias de uso.
Señales comerciales. El retraso en el pago de facturas es un indicador temprano sorprendentemente confiable: las empresas bajo estrés financiero o preparándose para reducir el gasto frecuentemente dejan que las facturas envejezcan antes de abordarlas. Una solicitud de reducción de licencia es una señal explícita. Una solicitud de revisión del contrato a mitad del período generalmente indica insatisfacción. Estas señales comerciales son rezagadas respecto a las señales de uso, pero son inequívocas cuando aparecen.
Señales de relación. La categoría de señales más subestimada. La salida de un champion (la persona que impulsó la compra inicial deja la empresa) es uno de los eventos individuales de mayor riesgo en un libro de negocio de CS (customer success). Cuando un champion se va, el defensor interno de su producto desaparece. El reemplazo comienza desde una línea base más baja de compromiso. La cadencia reducida de reuniones con el CSM (customer success manager) (el cliente deja de aceptar sus llamadas) es frecuentemente una señal más confiable que los datos de uso porque es intencional.
Cada categoría de señales tiene diferentes plazos de anticipación, lo que determina cuándo debe activarse el modelo y qué intervención es apropiada.
Cómo funciona el patrón Anomaly Agent para la predicción de churn
El patrón Anomaly Agent del ACE Framework es la lógica central de implementación para la predicción de churn. Funciona de manera diferente a las reglas simples basadas en umbrales, y la diferencia importa.
Una regla basada en umbrales dice: "si los logins caen por debajo de cinco por semana, marcar la cuenta como en riesgo". El problema es que las cuentas tienen diferentes patrones de uso de línea base. Una cuenta de 100 plazas con dos usuarios avanzados dedicados y noventa usuarios ocasionales se ve diferente a una cuenta de 100 plazas donde cada plaza está activa. El mismo número absoluto de logins es una señal de advertencia para una y normal para la otra.
El Anomaly Agent hace Ingest de un flujo continuo de datos de comportamiento, Analiza cada cuenta contra su propia línea base histórica (¿cómo ha sido el patrón de uso de esta cuenta específica en los últimos noventa días?) y contra benchmarks de cohorte (¿cómo se compara esta cuenta con cuentas similares en la misma etapa, nivel y tamaño?), Predice cuándo la desviación del comportamiento esperado supera un umbral significativo, y Ejecuta una alerta al CSM asignado o activa un flujo de trabajo de intervención automatizado.
La clave: las anomalías relativas son más predictivas que los umbrales absolutos. "El uso de esta cuenta cayó un 40% respecto a su propio promedio de noventa días" es más accionable que "esta cuenta inicia sesión cuatro veces por semana". La primera afirmación le dice que algo cambió. La segunda le dice algo que siempre pudo haber sido cierto.
Gainsight entrena sus modelos de predicción de churn en los datos históricos propios de cada cliente. Si lleva tres años en Gainsight y tiene tres años de resultados de churn y renovación asociados con patrones de comportamiento, el modelo está calibrado para su producto y base de clientes específicos. ChurnZero usa benchmarks de la industria como probabilidades previas y se ajusta a sus datos a lo largo del tiempo. Ambos enfoques convergen en la detección de anomalías relativas como mecanismo central de predicción.
La ventana de predicción que elija determina qué tipo de intervención es siquiera posible.
La 90-Day Churn Risk Signal
La 90-Day Churn Risk Signal es el framework para operacionalizar la predicción de churn con el plazo de anticipación correcto. Trata la predicción de churn como un sistema de dos ventanas: un modelo prospectivo de 90 días para el trabajo proactivo de CS (identificar cuentas que probablemente hagan churn en la próxima renovación antes de que comience la conversación de renovación, usando señales de movimiento lento como tendencias de uso de varios meses y estabilidad del champion) y un modelo de respuesta rápida de 30 días para jugadas de recuperación (usando señales agudas como aumentos en tickets de soporte, facturas vencidas y caídas repentinas de logins). El modelo de 90 días acepta más falsos positivos a cambio de suficiente plazo de anticipación para ejecutar intervenciones sustanciales. El modelo de 30 días prioriza la especificidad (solo alertar cuando hay confianza) para evitar que los equipos de CS persigan ruido. Ejecutar ambos simultáneamente es lo que separa los programas maduros de predicción de churn de los sistemas de alerta de umbral único.
Ventanas de predicción: modelos de 90 días versus 30 días
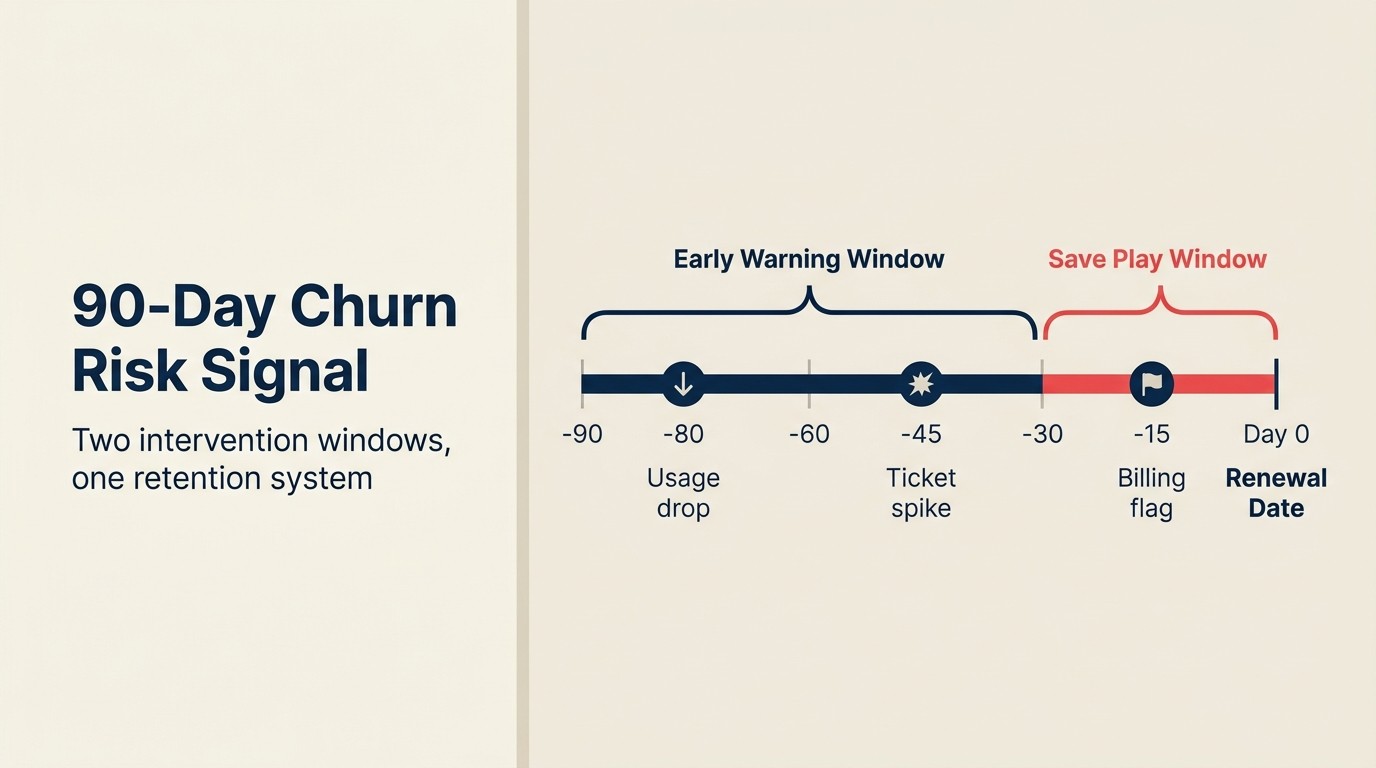
Los modelos de predicción de churn sirven diferentes propósitos según la ventana de predicción.
Los modelos de predicción a noventa días son para el trabajo proactivo de CS. El objetivo es identificar cuentas que probablemente hagan churn en su próxima renovación antes de que comience la conversación de renovación. Estos modelos usan señales de movimiento lento: tendencias de uso de varios meses, estabilidad del champion, historial de expansión de contrato y profundidad de adopción del producto a lo largo del tiempo. La investigación de McKinsey sobre NRR en tech B2B encuentra que la intervención en cuentas en riesgo más de 60 días antes de la renovación produce resultados de recuperación significativamente mejores que las intervenciones dentro de la ventana final de 30 días. Las predicciones a noventa días son típicamente menos precisas (más falsos positivos) pero dan a los equipos de CS suficiente plazo para intervenir de forma significativa. Una conversación de relación ejecutiva, un taller de casos de uso o una sesión de formación en adopción del producto lleva semanas planificar y ejecutar.
Los modelos de predicción a treinta días son para jugadas de recuperación. Estos usan señales de movimiento más rápido: aumento reciente en tickets de soporte, facturas vencidas, cadencia de reuniones reducida, caída repentina en la frecuencia de login. Las predicciones a treinta días son más precisas porque las señales son más agudas, pero dejan menos tiempo para la intervención. A treinta días, la intervención es menos "ayudémosle a obtener más valor" y más "entendamos qué ha cambiado y si podemos abordarlo".
La mayoría de las operaciones CS que usan predicción de churn con IA ejecutan ambas: health scores de noventa días que impulsan la planificación proactiva del calendario de CS, y alertas de riesgo de treinta días que desencadenan alcance humano inmediato.
Pero ninguno de los modelos entrega valor si el equipo de CS deja de confiar en las alertas.
El problema de los falsos positivos: por qué la especificidad importa tanto como la sensibilidad
Lo que la mayoría del contenido de los proveedores sobre predicción de churn no dice con suficiente claridad: los modelos de churn de alta sensibilidad crean demasiadas alertas, y demasiadas alertas destruyen la confianza del equipo de CS en el sistema.
La sensibilidad (recall) mide qué porcentaje de las cuentas que harán churn son marcadas. La especificidad mide qué porcentaje de las cuentas marcadas realmente hacen churn. Un modelo ajustado para alta sensibilidad detecta la mayoría de los que harán churn pero también marca muchas cuentas sanas. Un modelo ajustado para alta especificidad produce alertas confiables pero puede perder algunas cuentas que harán churn.
El modo de falla que hunde los programas de predicción de churn: los líderes de CS ajustan para alta sensibilidad porque temen perder cuentas en riesgo. Lanzan un sistema que marca 150 cuentas al mes como en riesgo. Los CSMs miran las alertas, notan que muchas de las cuentas marcadas parecen estar bien, y dejan de confiar en el sistema en tres meses. La adopción cae, el programa se declara fallido y la plataforma se cancela.
La guía práctica: comience con alta especificidad. Un sistema que marca treinta cuentas al mes y tiene razón el 70% de las veces es más valioso que un sistema que marca 200 cuentas al mes y tiene razón el 25% de las veces. El primer sistema genera credibilidad. El segundo genera ruido.
La forma de mejorar la especificidad sin sacrificar demasiada sensibilidad es agregar más categorías de señales. Las señales de uso solas tienen especificidad limitada. Las señales de uso combinadas con señales de soporte y señales comerciales son significativamente más específicas. Cuantas más categorías de señales incorpore, más confiado puede estar el modelo antes de generar una alerta.
Una vez que se activa la alerta y el equipo confía en ella, la pregunta se convierte en: ¿qué hace realmente?
El flujo de trabajo de jugadas de recuperación
Cuando el modelo marca una cuenta como en riesgo, el valor solo se materializa si un ser humano actúa rápidamente.
El patrón Workflow Copilot maneja el puente entre la alerta y la acción. Cuando el Anomaly Agent Predice un alto riesgo de churn para una cuenta, el Workflow Copilot Genera un borrador de outreach e intervención sugerida, y Ejecuta una asignación de tarea al CSM con la acción recomendada.
El tipo de intervención varía según la combinación de señales:
Alto declive de uso, sin problemas de soporte, champion estable. Es posible que el cliente haya cambiado su flujo de trabajo interno de manera que redujo el uso del producto pero no indica insatisfacción. La intervención correcta es una llamada de seguimiento que explora qué cambió y si hay una brecha de adopción que el equipo de CS puede abordar.
Aumento en tickets de soporte, declive de CSAT. El cliente está frustrado con el producto. La intervención correcta es una llamada de escalación con un líder de CS senior o representante de producto, enfocada en comprender los problemas específicos y proporcionar un cronograma de resolución.
Champion se fue. La intervención correcta es una llamada de relación ejecutiva del CSM o líder de CS al nuevo stakeholder, enfocada en restablecer el caso de negocio y comprender las prioridades del nuevo champion. Esta conversación necesita ocurrir dentro de las dos semanas después de la salida del champion, no sesenta días después.
Factura vencida más declive de uso. Esta combinación generalmente señala una decisión presupuestaria ya en progreso. La intervención necesita involucrar tanto flexibilidad comercial (posible reestructuración del contrato) como reconfirmación de valor.
Los playbooks generados por IA de Gainsight y las jugadas de recuperación automatizadas de ChurnZero operacionalizan esta lógica a escala. El CSM revisa la intervención sugerida y la lanza en lugar de diseñar el enfoque desde cero cada vez.
El flujo de trabajo de jugadas de recuperación determina si su modelo produce resultados o solo reportes. El caso de negocio para la inversión vive en el impacto en el NRR (net revenue retention) que sigue.
El impacto en el NRR de la predicción de churn asistida por IA
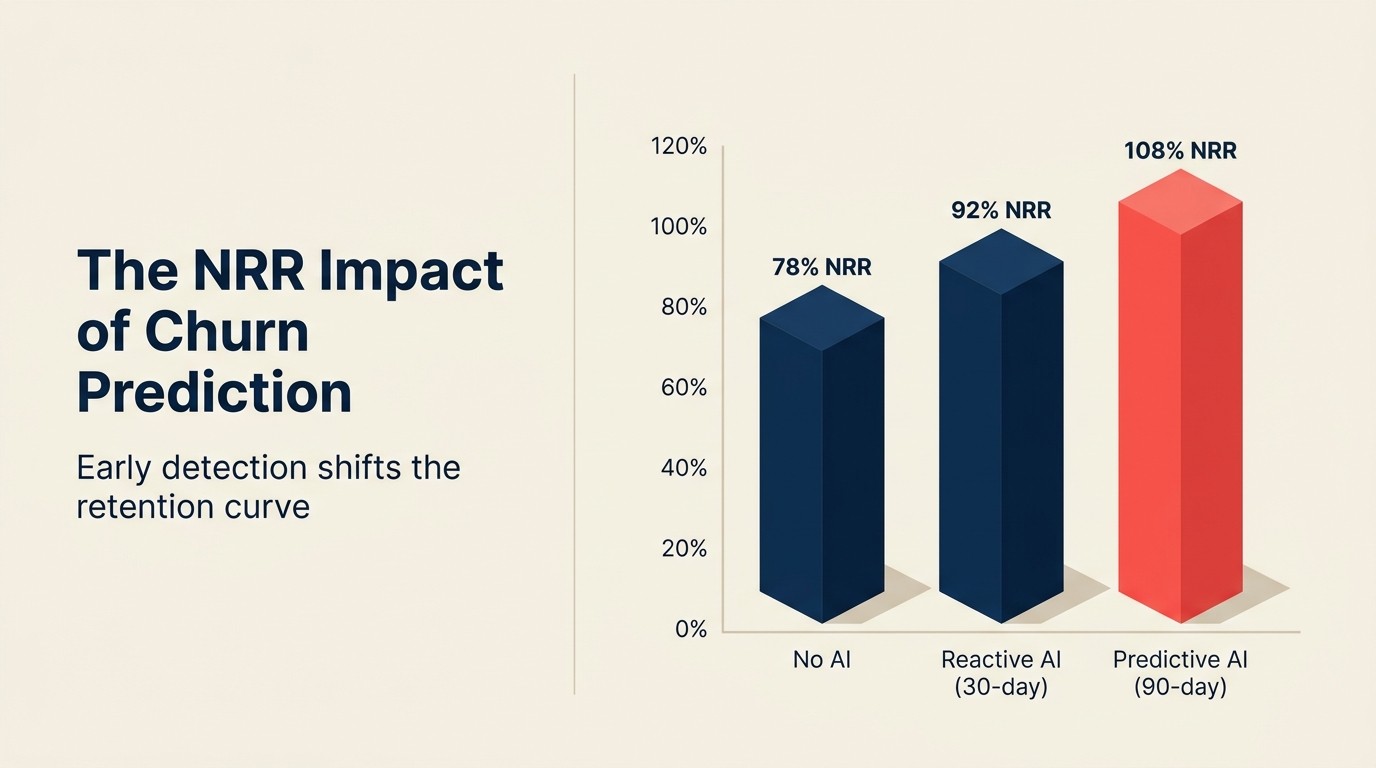
El caso de negocio para la IA de predicción de churn se mide en puntos de NRR, no en horas ahorradas. Vea las 5 dimensiones del ROI de IA para saber cómo enmarcar esto a nivel de directorio.
Las empresas SaaS que reportan programas de predicción de churn con IA bien implementados con flujos de trabajo de jugadas de recuperación claros describen mejoras de NRR de dos a cinco puntos porcentuales anualmente. En una base de $20M ARR, dos puntos de NRR son $400K en ingresos retenidos por año. Cinco puntos son $1M. Los benchmarks de retención de ChartMogul muestran que las empresas con NRR por encima del 100% crecen 1.5-3x más rápido que sus pares, lo que significa que cada punto de churn recuperado se compone en una ventaja material de ARR en 24-36 meses.
El mecanismo subyacente: un mayor porcentaje de cuentas en riesgo se identifica noventa días antes de la renovación en lugar de treinta días, lo que permite intervenciones sustanciales en lugar de intentos de recuperación de último minuto. Los intentos de recuperación de último minuto tienen éxito a tasas mucho más bajas porque el cliente ya ha decidido, ya ha planeado su alternativa y posiblemente ya ha comenzado la implementación.
Las tasas de éxito de las jugadas de recuperación de equipos CS con implementaciones maduras de predicción de churn son del 25-40% para intervenciones a noventa días y del 10-20% para intervenciones a treinta días. La brecha de timing entre esas dos tasas de éxito explica por qué la ventana de predicción importa tanto como la precisión de la predicción.
Una empresa SaaS de $20M ARR con un churn mensual del 3.5% está reemplazando $8.4M de ingresos anualmente solo para mantenerse estable. Una reducción del 31% en churn de los programas de predicción con IA recupera aproximadamente $2.6M anualmente. Con un retorno de $4-7 por cada $1 invertido, incluso una inversión anual de $500K en infraestructura de predicción de churn entrega $2M-3.5M en ingresos protegidos. Esa aritmética se cierra rápidamente, que es por eso que la predicción de churn tiene el período de retorno más rápido de cualquier inversión en IA de CS. (Arete benchmarks, 2025)
Rework Analysis: El modo de falla de predicción de churn que vemos más consistentemente no son los falsos negativos (perder cuentas en riesgo). Es la parálisis del CSM por demasiadas alertas. Cuando los equipos ajustan sus modelos primero para sensibilidad, generan 150 alertas por mes en un equipo que puede intervenir de forma significativa con 30. Los CSMs trían visualmente, confían en su intuición sobre qué alertas son "reales", y dejan de mirar la cola en 90 días. El sistema tenía razón sobre muchas de esas cuentas; los humanos abandonaron la señal. Comenzar con un modelo de alta especificidad (menos alertas, mayor precisión) y expandir la sensibilidad solo después de que el equipo confíe en el sistema es la secuencia de implementación que produce adopción duradera.
Lo que la predicción de churn con IA no resuelve
Siendo honestos: la predicción de churn con IA le dice qué cuentas están en riesgo. No le dice por qué, con certeza. El modelo presenta señales; el CSM las interpreta. Una cuenta que muestra declive de uso puede estar en riesgo de hacer churn, o simplemente puede haber completado un sprint trimestral donde el equipo estaba enfocado en otra cosa. La alerta es una hipótesis, no una conclusión.
El juicio del CSM para interpretar la alerta y elegir la intervención correcta no es reemplazable por el modelo. Una jugada de recuperación que trata a una cuenta sana como si estuviera por hacer churn, porque el modelo lo dijo, daña la relación. El humano en este sistema no es un cuello de botella. Es la puerta de calidad.
Para el stack completo de CS con IA incluyendo diseño de modelos de health score, preparación de QBR y planificación de capacidad del CSM, AI Customer Success Manager para B2B SaaS cubre la arquitectura completa del agente. Para los datos de producto aguas arriba que alimentan estos modelos, La Ventaja de Telemetría de Producto en SaaS con IA explica por qué las empresas SaaS tienen una ventaja estructural de predicción que los negocios no SaaS no pueden replicar. Y para la lógica de health scoring que alimenta el Anomaly Agent, Scoring de Salud con IA para Clientes SaaS proporciona los frameworks de ponderación de señales que distinguen los scores significativos de los decorativos.
| Categoría de Señal | Ejemplos | Tipo de Predicción | Plazo de Anticipación |
|---|---|---|---|
| Señales de uso (adelantadas) | Caída en frecuencia de login, abandono de funciones, declive de API | Modelo de 90 días | 3-8 semanas antes de la decisión de churn |
| Señales de soporte (mixtas) | Aumento en volumen de tickets, declive de CSAT, tasa de escalación | Modelo de 30-90 días | 2-6 semanas antes de la decisión de churn |
| Señales de relación (adelantadas) | Salida del champion, cadencia de CSM reducida | Modelo de 90 días | 4-8 semanas antes de la decisión de churn |
| Señales comerciales (rezagadas) | Factura vencida, solicitud de reducción de licencia, revisión de contrato | Modelo de 30 días | 1-3 semanas antes de la decisión de churn |
| Señales de sentimiento (adelantadas) | Lenguaje de "estamos evaluando opciones" en llamadas | Modelo de 90 días | 4-12 semanas antes de la decisión de churn |
Fuente: Gainsight, ChurnZero, Arete SaaS Research (2024-2025)
Preguntas Frecuentes
¿Qué es la 90-Day Churn Risk Signal?
La 90-Day Churn Risk Signal es el framework para la predicción de churn como sistema de dos ventanas: un modelo prospectivo de 90 días para el trabajo proactivo de CS (identificar cuentas que probablemente hagan churn usando señales de movimiento lento antes de la conversación de renovación) y un modelo de respuesta rápida de 30 días para jugadas de recuperación (usando señales agudas como aumentos en soporte y facturas vencidas). El modelo de 90 días acepta más falsos positivos a cambio de plazo de anticipación. El modelo de 30 días prioriza la especificidad para prevenir la fatiga de alertas. Ejecutar ambos simultáneamente separa los programas maduros de churn de los sistemas de alerta de umbral único.
¿Qué tan precisa es la predicción de churn con IA para SaaS?
Los modelos entrenados en 80 o más señales de comportamiento logran una precisión de predicción del 75-82%. Las implementaciones avanzadas que integran análisis de sentimiento conversacional basado en LLM alcanzan el 94% de precisión hasta 18 meses antes de la renovación. El benchmark es que los clientes que usan frases como "estamos evaluando opciones" en las llamadas tienen 4-6 veces más probabilidades de hacer churn en los próximos 90 días. Las empresas que implementaron predicción de churn con IA en 2024-2025 redujeron el churn bruto en un promedio del 31% dentro de los 12 meses en más de 500 empresas SaaS mid-market.
¿Qué ROI puede esperar una empresa SaaS de la predicción de churn con IA?
El retorno promedio es de $4-7 en ingresos protegidos por cada $1 invertido en IA de predicción de churn. Una empresa de $20M ARR con un churn mensual del 3.5% que reemplaza $8.4M anualmente recuperaría aproximadamente $2.6M por año de una reducción del 31% en churn. Con un ROI de $4-7 por cada $1 invertido, una inversión de $500K en predicción de churn entrega $2M-3.5M en ingresos protegidos. El retorno es típicamente de 60-90 días, lo que la convierte en la inversión en IA de CS con retorno más rápido.
¿Por qué fallan algunos programas de predicción de churn con IA?
El modo de falla más común es la parálisis del CSM por demasiadas alertas. Los equipos que ajustan primero para sensibilidad generan 150 alertas por mes para un equipo que puede actuar de forma significativa en 30. Los CSMs trían visualmente, confían en su intuición y dejan de usar el sistema en 90 días. La secuencia correcta de implementación: comenzar con un modelo de alta especificidad (menos alertas, mayor precisión por alerta) y expandir la sensibilidad solo después de que los CSMs confíen en el sistema. Un modelo que marca 30 cuentas y tiene razón el 70% de las veces es más valioso que uno que marca 200 cuentas y tiene razón el 25% de las veces.
¿Cuál es la diferencia entre los modelos de predicción de churn de 90 días y de 30 días?
Los modelos de noventa días usan señales de movimiento lento: tendencias de uso de varios meses, estabilidad del champion, profundidad de adopción a lo largo del tiempo. Son menos precisos (más falsos positivos) pero dan suficiente plazo para intervenciones sustanciales como llamadas de relación ejecutiva y talleres de adopción del producto. Los modelos de treinta días usan señales agudas: aumentos en soporte, facturas vencidas, cadencia de reuniones reducida. Son más precisos pero dejan menos tiempo. Las tasas de éxito de las jugadas de recuperación son del 25-40% a 90 días pero solo del 10-20% a 30 días. La mayoría de las operaciones CS maduras ejecutan ambos.
¿Cómo se diferencia la predicción de churn con IA del health scoring basado en reglas?
El scoring basado en reglas aplica umbrales absolutos uniformes en todas las cuentas ("si los logins caen por debajo de 5 por semana, marcar en rojo"). La predicción de churn con IA detecta anomalías relativas: desviación de la propia línea base histórica de esa cuenta específica. Una cuenta con 3 logins por semana que siempre ha tenido 3 logins por semana no está en riesgo. Una cuenta que cayó de 20 logins a 3 logins por semana sí lo está. El patrón Anomaly Agent que subyace a la predicción de churn con IA se entrena en resultados de churn reales de su propio historial de cuentas, no en una estimación sobre qué señales importan.
Relacionado:

Co-Founder, Rework.com
On this page
- Por qué el churn en SaaS es estructuralmente más predecible que en otras industrias
- Categorías de señales para la predicción de churn
- Cómo funciona el patrón Anomaly Agent para la predicción de churn
- La 90-Day Churn Risk Signal
- Ventanas de predicción: modelos de 90 días versus 30 días
- El problema de los falsos positivos: por qué la especificidad importa tanto como la sensibilidad
- El flujo de trabajo de jugadas de recuperación
- El impacto en el NRR de la predicción de churn asistida por IA
- Lo que la predicción de churn con IA no resuelve