ACE能力別ROI:どのAI投資が最も早く回収できるか

Turn this article into takeaways for your work.


Each assistant summarizes the article only for you and suggests best practices for your work.
多くのAI予算の議論が同じ理由で間違いを犯します:すべてのAI投資を交換可能なものとして扱うことです。取締役会のプレゼンテーションは「AI支出」を1行にまとめ、単一の投資収益率(ROI)数値を求めます。しかし、Workflowの先頭で文書をIngestするAIは、最後に発注書をExecuteするAIとは根本的に異なるリターンをもたらします。
それらを等価として扱うことが、最初に間違ったプロジェクトを承認し、その後「AI」が約束したものを提供しなかったと取締役会に説明する事態につながります。
ACE FrameworkはビジネスAIの5つの能力を定義しています:Ingest、Analyze、Predict、Generate、Execute。各能力は価値連鎖の異なる点で機能します。各能力には異なるROIプロファイルがあります:何を測定するか、リターンが通常どのように見えるか、因果関係を証明するのがどれほど難しいか。これらのプロファイルを理解することで、投資を合理的に順序付け、ステークホルダーに正直な期待を設定できます。
この記事では、5つの能力それぞれをROIプロファイルにマッピングし、内部プレゼンテーションに適応できる簡単なROI計算テンプレートを含めます。
ACE能力によってROIが異なる理由
主要データ:AI能力ROIの現実
- Agentive AI(Execute中心)の展開はエンタープライズ設定で平均171% ROIを返し、従来の自動化リターンの約3倍ですが、AIをパイロット段階を超えてスケールした組織はわずか15〜25%です。(Menlo Ventures / Bain)
- ROIまでの時間は、カスタマーサービス自動化(Generate + Execute)の2週間から、サプライチェーンオーケストレーション(Predict + Execute)の12ヶ月以上まで及びます。(AI Monk)
- 平均的な組織は2025年にAI概念実証の46%を本番前に中止しており、帰属の困難さと不明確な指標が主な理由として挙げられています。(Master of Code)
ROIはAIの種類によって均一ではありません。なぜなら価値創造はビジネスプロセスの異なる点で起こるからです。
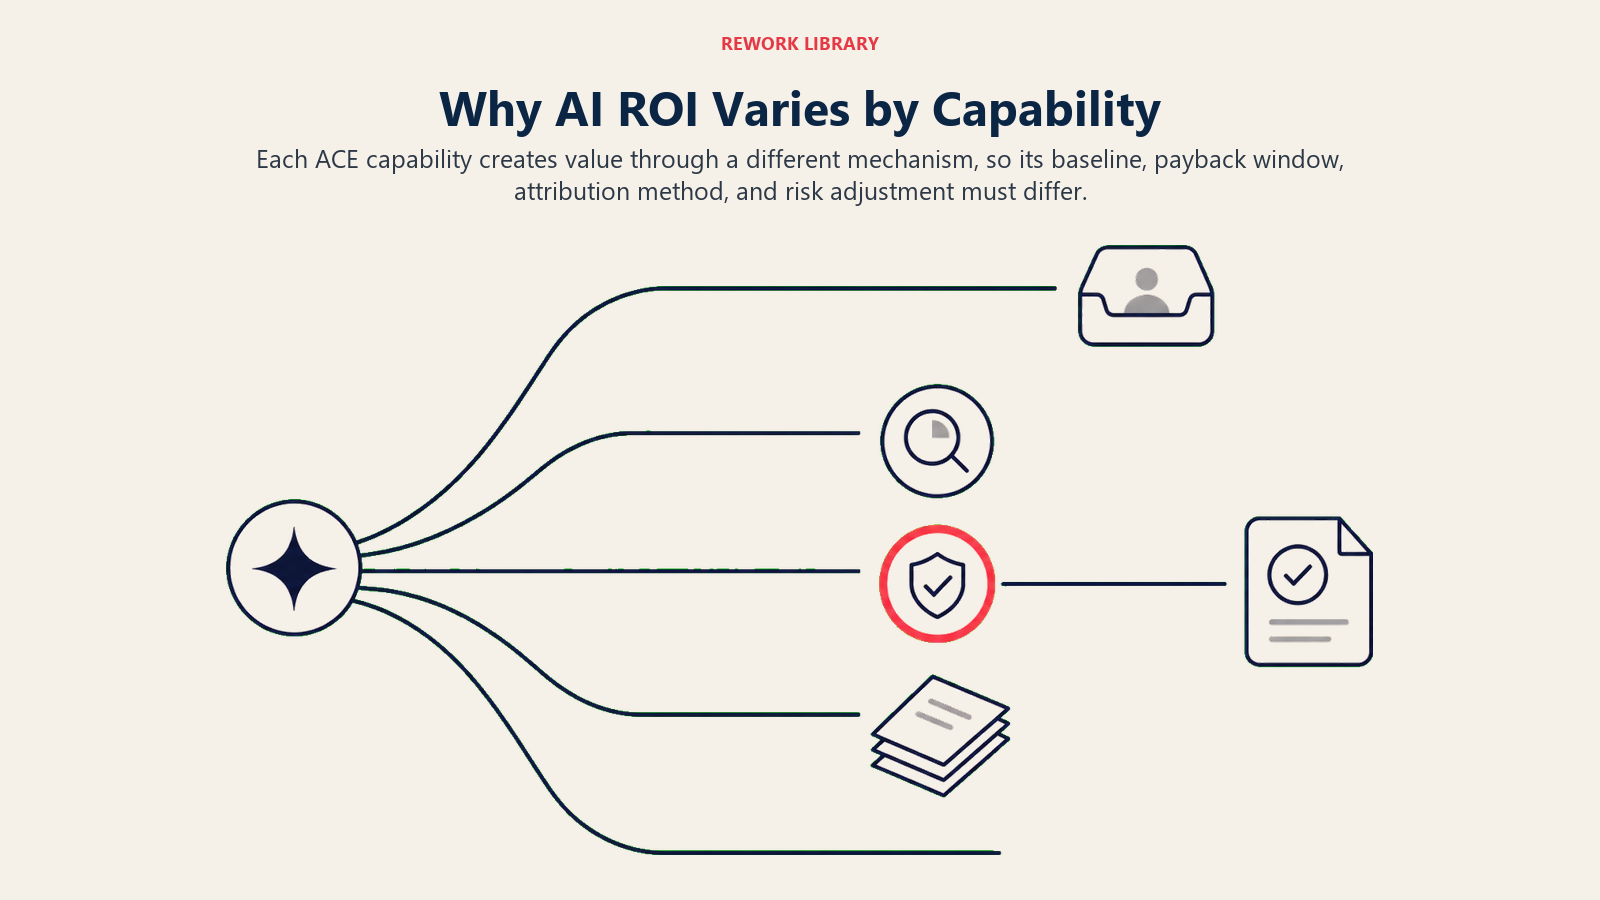
IngestはWorkflowの上流に位置し、情報がシステムに入る瞬間にあります。その利益は収益指標に見えません。Analyzeは中間にあり、人間がどれだけ速く、どれだけ上手く意思決定するかに影響します。Predictは「データがある」と「それに基づいて行動する」の変曲点にあり、最も高い理論的収益帰属を持ちます。Generateは人間が使用する成果物を作成し、AI出力とビジネス成果の間にレイヤーを作ります。Executeは直接状態を変え、測定可能なコストまたは収益イベントに最も近い能力です。
上流から下流へのその進行は、測定が難しいものから測定しやすいものへの進行でもあります。しかし、リスク階層の逆です:Executeは証明するのが最も簡単であり、うまくいかないときも最もコストがかかります。
いくつかの他の変数がばらつきを説明します。
意思決定の複雑さとともに帰属の困難さが増します。 AIが担当者が勝利したメールに編集した最初の草稿を生成する場合、その案件のどのくらいがAIに行くのでしょうか?わかりません。AIが欠品を防いだ発注書をExecuteする場合、回避された欠品のコストは帰属可能です。一方はクリーンな因果関係を持ち、もう一方はそうではありません。
価値実現までの時間が異なります。 Ingest能力(光学文字認識、文字起こし、文書解析)は多くの場合、展開が最も速く、測定が最も安価です。Execute能力は安全に展開するまで最も長くかかりますが、稼働後は最も持続的なコスト削減を生み出します。
測定インフラが重要です。 Predict ROIを証明するにはA/Bテストインフラが必要です:モデルを使用しないコントロールグループ対使用するトリートメントグループ。ほとんどの組織は最初のAIプロジェクトを開始するときにそのインフラを設定していません。これは技術的な問題ではなく、プロセスの問題です。
Ingest ROIプロファイル
Ingestの機能: 生のシグナル(画像、音声、スキャンされたPDF、文書ストリーム)をAIが処理できる情報に変換します。光学文字認識(OCR)、音声テキスト変換、文書解析、構造化データ抽出が典型的なIngest操作です。
主要指標:
- 手動データ入力時間の削減(オペレーター1人あたりの週間時間数)
- データ精度率(1,000レコードあたりのエラー、前後比較)
- 処理スループット(1時間あたりの処理文書数)
典型的なリターン: ERP(エンタープライズ・リソース・プランニング)システムに請求書を手動で入力する財務チームは、文書あたり30秒〜2分を費やすかもしれません。同じ文書を処理するIngest AIは通常3秒未満で95〜99%の精度で実行します。1日500枚の請求書を処理するチームにとって、これは1日4〜8時間の手動作業の排除に加え、以前に下流の照合問題を引き起こしていたキー入力エラーの測定可能な削減です。
Ingestに対する最もクリーンなROIテンプレートは、人間のベースラインに対するコスト比較です。人間のデータ入力時間が25ドル/時間で、月に10,000文書を2分ずつ処理している場合、手動コストは約8,300ドル/月です。月500ドル(中規模市場の文書自動化ツールの一般的な価格)のIngest AIは明確な回収を示します。
測定の課題: Ingestのメリットは上流にあります。ソースデータのエラーが少ないと、その後3ステップで問題が少なくなります。しかし「持っていなかった照合問題」はDashboardに現れません。展開前に適切なプロキシ指標(エラー率、手直し時間)を測定して前後比較を行う必要があります。多くのチームはこのステップを省略し、節約したものを証明できなくなります。Vision Extract Patternの記事はIngestのユースケースを最も詳しく扱っており、展開前のベースラインとして使うべき精度ベンチマークも紹介しています。
ROI計算テンプレート:
月間節約 = (文書/月 × 平均手動時間分 / 60) × 時間労働コスト
ROI = (月間節約 - ツールコスト) / ツールコスト × 100%
Analyze ROIプロファイル
Analyzeの機能: Ingestしたものを理解します。分類、抽出、要約、センチメント検出、エンティティ認識はすべてAnalyze操作です。Analyzeは生のテキストやデータを人間にとって実行可能なものに変換するものです。
主要指標:
- 意思決定速度:情報利用可能から決定完了までの時間(時間から分へ)
- アナリスト能力の再配置:より高い判断力の作業に解放された週間時間数
- 人間のベースラインに対する分類精度
典型的なリターン: 1日2,000チケットを分類するカスタマーサポートチームは、作業に触れる前に、多大なアナリスト時間をルーティングに費やします。90%以上の精度でインカミングチケットを分類してタグ付けするAnalyze AIは、ルーティングの決定を完全に解放し、人間から最初の応答までの時間を時間から秒に短縮します。
調査集約型の役割(競合インテリジェンス、財務分析、法的レビュー)では、Analyze能力は数時間の合成を数分に圧縮できます。AIの要約と抽出ツールを使用するナレッジワーカーの一般的に報告される生産性向上は、ソース素材の複雑さによっては、タスク時間で20〜40%です。
測定の課題: 意思決定の品質はAI分析の品質から切り離しが難しいです。アナリストがAI生成の要約を読んだ後により良い決定をする場合、その成果のどれくらいがAI対アナリストの判断に属するのでしょうか?意思決定速度を正確に測定できます。時間追跡でアナリストの能力再配置を測定できます。しかし、より速いまたはより良い決定からの収益帰属には、ほとんどの組織が設計していない管理実験が必要です。RAG Assistant Patternは、意思決定品質の改善を時間をかけて追跡するために、Analyze能力をどう計測するかを解説しています。
実用的な推奨事項:最初にプロキシ(時間節約、スループット)を測定し、収益インパクトではなく。最初の6ヶ月でベースラインデータを構築します。収益帰属は後で来ます。
Predict ROIプロファイル
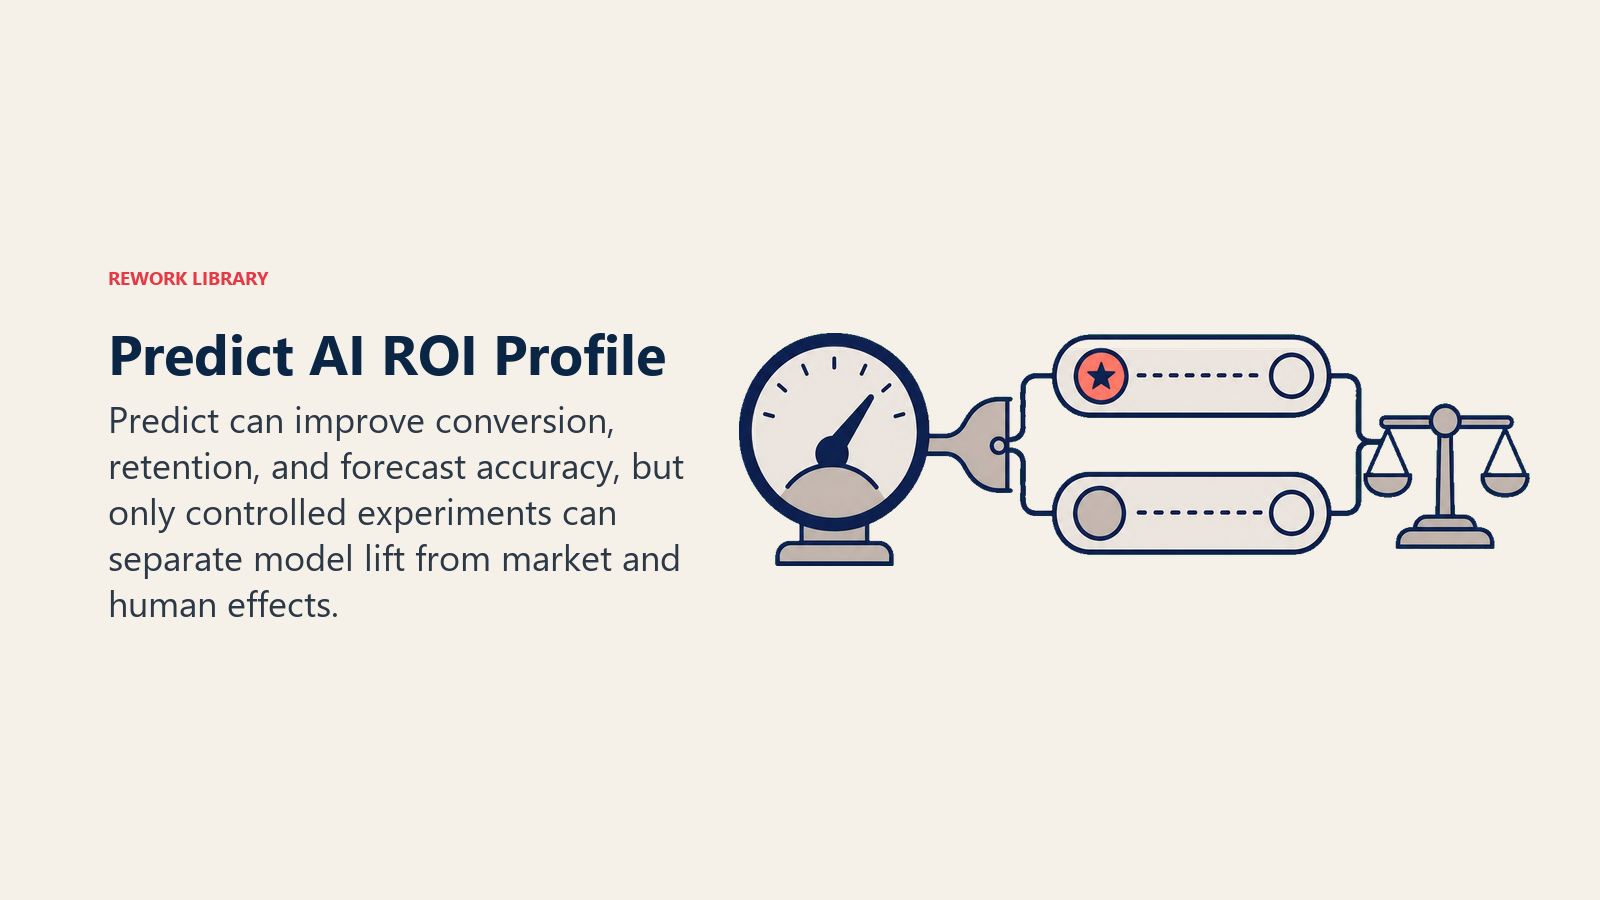
Predictの機能: 確率をスコアリングし、成果を予測し、オプションをランク付けし、異常を検出します。リードスコアリング、解約予測、需要予測、詐欺検出がPredictの典型的なアプリケーションです。
主要指標:
- コンバージョン率(モデルに「高」とスコアされたリード対スコアされていないリード)
- 解約低減率(フラグ立てされたアカウント対フラグなし、90日間の成果比較)
- 予測精度(AI予測前後の平均絶対パーセント誤差、MAPE)
- 異常検出の偽陽性/偽陰性率
典型的なリターン: Predictは任意のACE能力の中で最も高い収益帰属の可能性を持ちます。なぜなら、最も価値の高いビジネス成果について人間がとる行動に直接影響するからです。担当者がコンバージョンの上位20%(通常コンバージョンの60〜80%を占める)を優先するのを助ける適切にキャリブレーションされたリードスコアリングモデルは、人員を増やすことなくクォータ達成を大きく向上させます。
報告された成果の範囲はここでは他のどの能力よりも広いです。不適切な実装のPredict(不十分なデータでトレーニングされたモデル、担当者の採用プロセスなしで展開)はほぼゼロのリフトを示します。適切なA/Bテストインフラと担当者Workflow統合を伴う優れた実装は、比較可能なベンチマークで10〜30%のコンバージョン率向上を示します。McKinseyの生成AIの経済的ポテンシャルに関する分析は、Predictやスコアリング能力が最も測定可能な価値を集中させる領域としてマーケティングと営業を特に挙げており、現在の世界の営業支出に対して営業生産性が3〜5%向上すると推定しています。
測定の課題: Predict ROIはクリーンに帰属させるのが最も難しいです。同時に起きている他のことからモデルの貢献を切り分けるにはA/Bテストが必要です。ホールドアウトグループなしでは、コンバージョン改善がモデルから来たのか、それと偶発的に相関した担当者の行動から来たのかわかりません。
A/BテストなしにPredict ROIを主張するほとんどの組織は相関関係を報告しており、因果関係ではありません。これはPredict能力を避ける理由ではなく、展開後ではなく展開前に測定インフラを設計する理由です。Scoring and Routing Patternは、営業チームが受け入れやすいホールドアウトグループの構築を含め、Predict展開のためのA/Bテスト設計を扱っています。
Generate ROIプロファイル
Generateの機能: プロンプトとコンテキストから新しい成果物を生成します。メールの草稿、レポート、コード、要約、画像、構造化された計画はすべてGenerateの出力です。成果物は人間がレビューして展開するまで草稿の形で存在します。
主要指標:
- 最初の草稿の時間節約(成果物あたりの分)
- 一定の人員でのコンテンツ量
- 編集から公開までのサイクル時間(ブリーフィングから最終草稿まで)
- ブランド一貫性スコア(スタイルガイド適用のAI使用時)
典型的なリターン: Generate能力は任意のACE能力の中で最も明確な時間節約をもたらし、最初の草稿時間は観察が容易なため節約を速く測定できます。ゼロからブログ記事を書くのに4時間かかったマーケティングチームは、AIドラフティングを使用すると同じ記事で45〜90分を費やすと一般的に報告します。カスタムプロポーザルを作成する営業担当者は60〜90分から15〜20分に短縮されました。
コンテンツ量の計算は簡単です:チームがAI前に月8本のブログ記事を作成し、同じ人員で18本を作成するようになった場合、1記事あたりの実効コストを計算し、外部ライターへのコストと比較できます。一定の人員でのコンテンツ量はクリーンで弁護可能なGenerate ROI指標です。
測定の課題: 品質測定が難しい部分です。量は測定が容易ですが、品質はそうではありません。公開可能になるまでに大幅な人間の編集が必要な最初の草稿は、軽い編集だけで済むものよりもROIを少なく獲得します。「編集距離」の測定(最終出力がAIの草稿とどれだけ異なるか)は品質プロキシを提供しますが、ほとんどのチームが持っていないツールと一貫した追跡が必要です。
Generate ROIは早期パイロットでは過大評価されることが多いです。なぜならチームはレビュー時間、品質低下(技術的には存在するがパフォーマンスが悪いコンテンツ)、AIで生成された量の管理の調整コストを考慮せずにAIドラフティングの時間節約を測定するからです。
正直な枠組みは次のとおりです:Generateは最初の草稿で大幅な時間を節約します。しかし、その草稿を良いものにするために必要な判断を置き換えるものではありません。MIT Sloanの職場での生成AIのスケールに関する研究では、AIドラフティングツールに対する従業員の満足度は、節約された時間そのものよりも、品質が向上したという実感との相関が強いことがわかっており、両方の側面を測定することが重要な理由です。
Execute ROIプロファイル
Executeの機能: AIシステムの外の状態を変えます。メールを送信し、レコードを更新し、Workflowをトリガーし、トランザクションを発行し、作業をルーティングします。ExecuteはAIが提案を生成するのを止め、実際の結果を伴う行動をとり始める場所です。
主要指標:
- プロセス自動化率(人間の介入なしで処理されるWorkflowのパーセンテージ)
- サイクル時間の短縮(トリガーから完了までの時間)
- エラー低減率(自動化前後のプロセスエラー)
- 人間のベースラインに対するトランザクションコスト
典型的なリターン: Execute能力は、うまく機能した場合、任意のACE能力の中で最も直接的なコスト削減をもたらします。請求書を受け取り、発注書と照合し、例外を人間にルーティングし、承認された請求書を自動支払いするAP自動化システムは、5〜7日のプロセスをクリーンなケースでは当日または翌日に圧縮します。大量トランザクション環境(eコマース、金融サービス、物流)では、スケールでのExecute自動化は、量がスケールする際の人員増加を防ぐか、役割カテゴリ全体を排除します。
しかし、リターンはプロセス自体が明確に定義されている場合にのみクリーンです。例外が多く、乱雑なプロセスに適用されたExecuteは期待された節約をもたらさず、新しい問題を生み出すことが多いです:スケールでの誤って実行されたアクション、間違って処理されたエッジケース、監査証跡のギャップ。
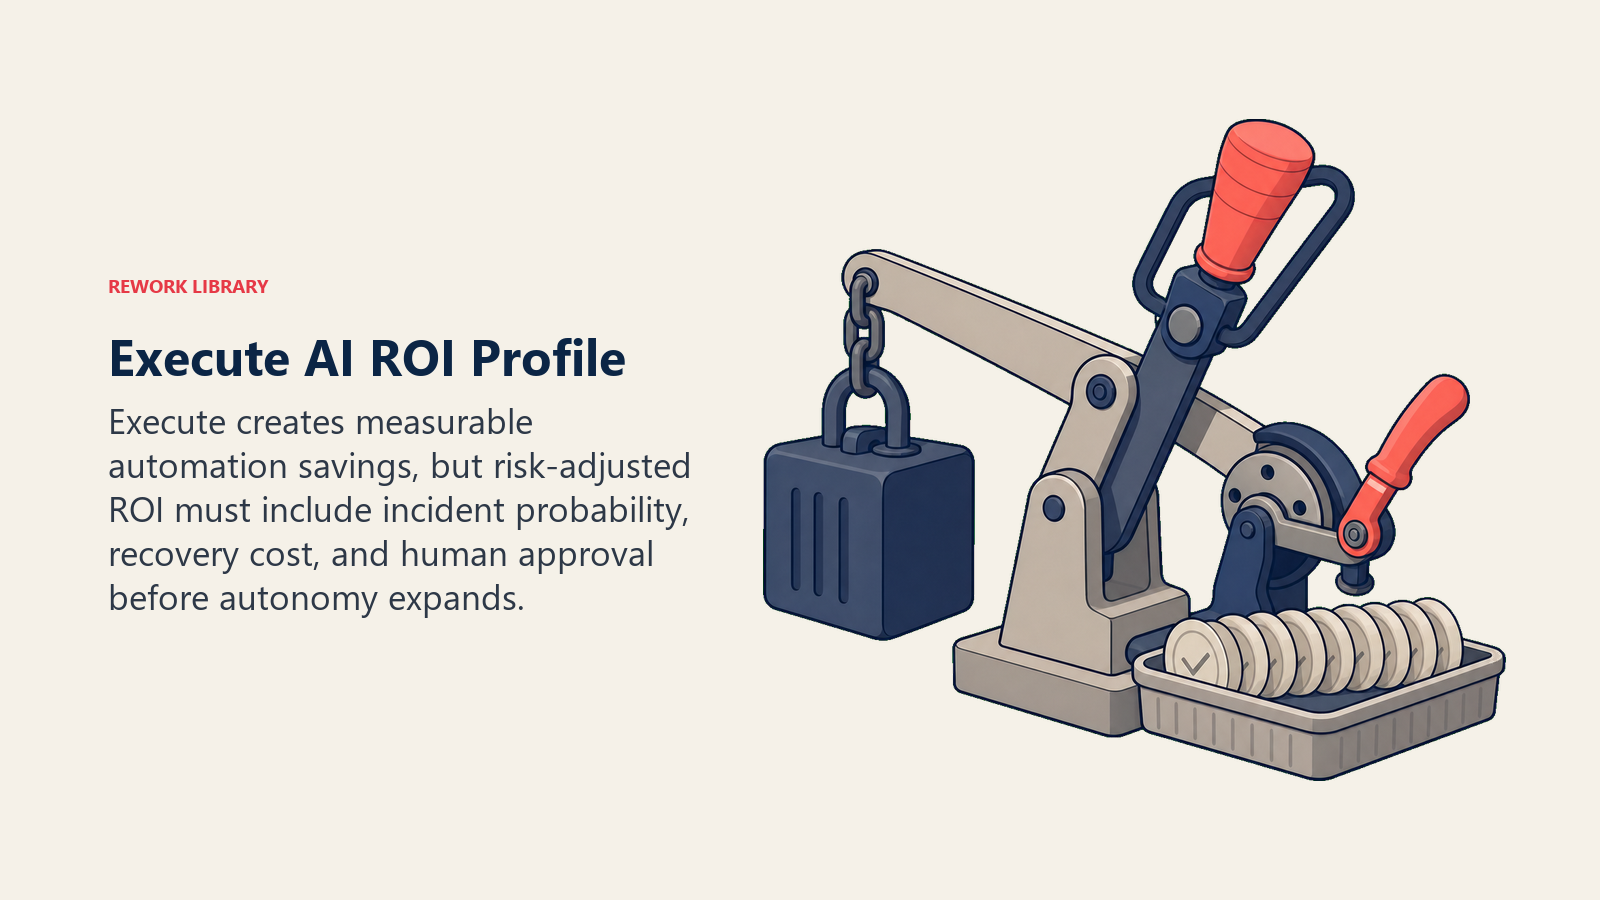
測定の課題: Execute ROIは任意の能力の中で最も明確に測定できますが、インシデントの回復が最もコストがかかります。10,000人の顧客に不正な請求メールを送信したり、承認限度を超えた購入を自動承認したりした誤設定のExecute Workflowは、節約を上回るコストを生み出します。ROI計算には定常状態の節約だけでなく、リスク調整されたインシデント確率を含める必要があります。
Executeの正しいガバナンスモデル:期待される節約を測定し、インシデントの確率とコストを推定し、リスク調整されたROIがまだ成立するか確認し、確信が確立されたときにのみ削除する人間による承認ステージで展開します。監督モデルについてはGovernance by Patternを、リスク調整されたExecute ROIモデルに含めるべきインシデントコストの区分についてはAI Pattern Cost Overrunsをご覧ください。
能力別ROIプロファイル
能力別ROIプロファイルは、5つのACE能力(Ingest、Analyze、Predict、Generate、Execute)それぞれを、独自の測定方法論、典型的なリターンウィンドウ、帰属の困難さにマッピングします。「AI ROI」を単一の数値として扱うのではなく、このプロファイルにより、プログラムスポンサーは各能力に適した測定インフラを伴う能力別の投資ケースを提示できます。
引用可能: 「Predict能力は任意のACE能力の中で最も高い収益帰属の可能性を持ちます。なぜなら、最も価値の高いビジネス成果について人間がとる行動を直接決定するからです。しかし、最初のPredict展開でROIが弁護可能に示されるまでに失敗した後でのみ構築するA/Bテストインフラも必要です。」
引用可能: 「Execute能力ROIは測定が最も明確であり、うまくいかないときが最もコストがかかります。10,000人の顧客に不正な請求を送信した誤設定のExecute Workflowは、1年分の自動化節約を上回るコストを生み出します。」
引用可能: 「Generateから始めてください。統合も、過去データも、展開の承認プロセスも不要です。ROIは不精確ですが現実のものであり、コストが高いときに失敗する能力に取り掛かる前にチームのAIへの親しみを構築します。」
| ACE能力 | 価値実現時間 | 帰属の困難さ | 主要ROI指標 | 典型的なリターン |
|---|---|---|---|---|
| Ingest | 2〜6週間 | 低(直接労働コスト) | 文書抽出あたりのコスト | 月500ドルのAI対10,000文書で手動月8,300ドル |
| Analyze | 4〜8週間 | 中(意思決定品質) | 意思決定速度、アナリスト能力 | ナレッジワーカー1人あたり20〜40%の時間節約 |
| Predict | 3〜6ヶ月 | 高(A/Bテストが必要) | コンバージョン率、解約低減 | 適切なコントロールで10〜30%のコンバージョンリフト |
| Generate | 2〜4週間 | 低〜中(量は明確、品質はそれほどでなく) | 最初の草稿時間、コンテンツ量 | 最初の草稿時間の60〜75%削減 |
| Execute | 2〜4ヶ月 | 低(トランザクションあたりの直接コスト) | プロセス自動化率、サイクル時間 | スケールでの比例的な人員増加を排除 |
Rework分析: 展開順序のパターンに基づくと、GenerateまたはIngest能力から始める組織は、ステークスと測定の複雑さが両方高いPredictとExecuteに取り掛かる前に、測定の筋肉と組織的な信頼を構築します。最も高いROI上限を持つからといってExecuteから始めることは、早期段階のAIプログラムで最も一般的な順序付けの間違いです。
成熟度段階別の投資順序付け
同じACE能力でも、ある成熟度段階では高いリターンをもたらし、別の段階では注意を散らす、あるいはリスクを生むことがあるため、順序付けが重要です。
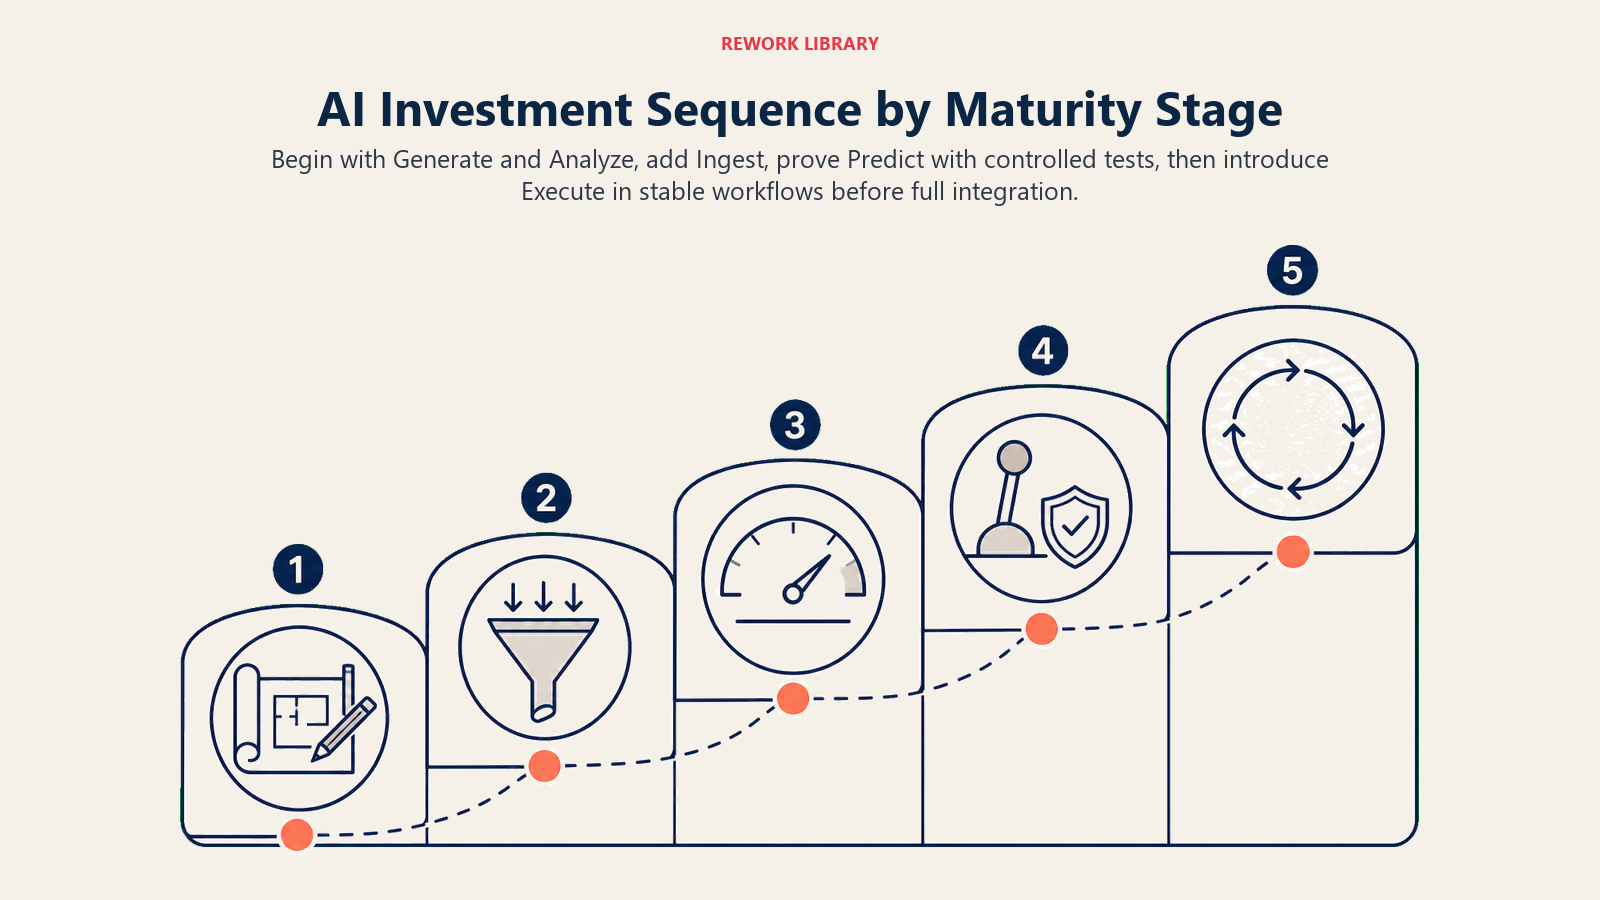
すべてのACE能力が同時に意味をなすわけではありません。異なる成熟度段階の組織は異なる優先順位をつけるべきです。
Stage 1(Ad-hoc): Generateから始めます。統合も、過去データも、展開の承認プロセスも不要です。ROIは不精確ですが現実のものであり、難しい能力に取り掛かる前にチームのAIへの親しみを構築します。内部文書の要約とチケット分類のためのAnalyzeを追加します。
Stage 2(Pilot): 最も大量の文書またはデータ入力Workflowのために Ingestを追加します。ROIは測定可能で、統合は限定的で、リスクは低いです。Predictの測定インフラを設計し始めます(ベースラインのコンバージョン率、過去データの監査)、まだPredictを展開していなくても。
Stage 3(Scaled): 12ヶ月以上のクリーンな過去データと既知の成果がある最初のユースケースでPredictを展開します。A/Bテストインフラに投資します。これをスキップしないでください;ホールドアウトグループなしに主張されたPredict ROIは懐疑的なCFOには弁護可能ではありません。
Stage 4(Integrated): 最初に最も大量で最も予測可能なWorkflowにExecuteを導入します。例外が多いプロセスには適用しません。確信区間が確立されるまで顧客対応のトランザクションには適用しません。展開前にインシデント対応Playbookを構築します。
Stage 5(Transformational): すべての5つの能力が稼働し、相互に統合され、人間がルーティンの作業を実行するのではなく監視します。この段階でのROIは能力レベルではなくビジネス成果レベルで測定されます。
順序付けの原則は単純です:測定が最も安価で間違えたときのリスクが最も低い能力から始めます。最も高いリターンと最も高いリスクを持つ能力に向かって進みます。途中で測定インフラを省略しないでください。
CFOへのまとめ
承認される取締役会のプレゼンテーションは、最も高いROI数値を約束するものではありません。何が測定されているかについて具体的で、証明が難しいことに正直で、組織の信頼を構築する方法で順序付けられているものです。
各投資を単一のブレンドROI主張ではなく、独自の測定モデルで枠組みするために上記の能力プロファイルを使用します。「測定可能なベースラインに対して予測3.2倍ROIを示すAP自動化をターゲットとしたIngestプロジェクト」は資金調達可能な声明です。「AIはビジネスを30%向上させる」はそうではありません。
帰属が本当に難しい能力(Analyze、Generate、特にPredict)については、早期投資を測定インフラとして枠組みします:スケールされた投資が弁護可能なROIを持つようにベースラインとA/Bテスト装置を構築しています。それは正直であり、これをうまくやっている組織が実際に機能する方法です。
5次元AI ROIとAI ROIが証明しにくい理由はこのフレームワークをさらに拡張します。SaaS AI成熟度ステージは、順序付けのロジックを業界の文脈にマッピングします。CFOとのAI予算対話は、能力別ROIプロファイルを承認される予算言語に変換する方法を示しています。
ここでの能力別ビューは出発点です。IngestとGenerateのROIは測定が容易で規模は中程度であり、Predict ROIは測定が難しく規模は潜在的に高いことを理解することで、投資をどのように段階化し、予算を承認する人々とどのように話すかがわかります。
よくある質問
どのACE能力が最も速いROI回収を持ちますか?
GenerateとIngest能力は通常、展開後2〜6週間で最も速いROIを示します。Generateは最初の草稿時間を60〜75%削減し、すぐに測定可能です。Ingestは計算可能な文書あたりのコストで手動データ入力を排除します。どちらもA/Bテストインフラや複数月の帰属ウィンドウを必要としません。
どのACE能力が最も高いROIの可能性を持ちますか?
Predict能力は最も高い収益帰属の可能性を持ちます。なぜなら、最も価値の高いビジネス成果について人間がとる行動に直接影響するからです。リードスコアリング、解約予測、需要予測は、適切な管理実験設計で10〜30%のコンバージョンまたは維持の向上を示すことがあります。トレードオフは、Predictが信頼性をもってROIを証明するために最も多くの測定インフラを必要とすることです。
Execute ROIが最も測定しやすい理由は何ですか?
ExecuteはプロセスAutomation率、サイクル時間の圧縮、トランザクションあたりのコストなど、直接かつ測定可能な方法で状態を変えます。PredictやAnalyzeとは異なり、Execute ROIは人間の意思決定を通じた帰属を必要としません。しかし、Executeのインシデントは回復が最もコストがかかるため、リスク調整されたROIにはインシデントの確率と修正コストを含める必要があります。
組織はどの順序でACE能力を展開すべきですか?
推奨される順序は:Stage 1(低リスク内部WorkflowのためのGenerate + Analyze)、Stage 2(最も大量の文書WorkflowのためのIngest)、Stage 3(適切なA/Bテストインフラを伴うPredict)、Stage 4(明確に定義された例外が少ないプロセスのためのExecute)。この順序は測定が最も安価で間違えたときのリスクが最も低いものから、最も高いリターンと最も高いステークスへと進みます。
多くのAIパイロットがROIを示せないのはなぜですか?
平均的な組織は2025年にAI概念実証の46%を本番前に中止しており、主に帰属の困難さと不明確な指標が原因です。根本原因は能力レベルのミスに直接マッピングされます:A/Bテストインフラなしに展開されたPredict、品質管理なしに量で測定されたGenerate、リスク調整されたROIモデルなしに展開されたExecute(インシデント確率を含まない)。
Analyze ROIはPredict ROIとどのように異なりますか?
Analyzeは人間が行動する洞察を生み出し、帰属を間接的にします。その主要ROI指標は収益成果ではなく、意思決定速度と解放されたアナリスト能力です。Predictは高価値の決定(購入、解約、デフォルト)に対する人間の行動を導く確率をスコアリングし、管理された実験を通じた収益への帰属を可能にします。Analyzeは展開が容易ですが収益への接続が難しく;Predictは展開が難しいですが収益成果への帰属がより直接的です。