More in
SaaS Buying Insights
The New B2B Buying Committee: Who's Really in the Room
Mar 30, 2026
POCs That Predict Success — and POCs That Waste Everyone's Time
Mar 23, 2026
Seat-Based Pricing Is Dying. Here's What's Replacing It
Mar 12, 2026
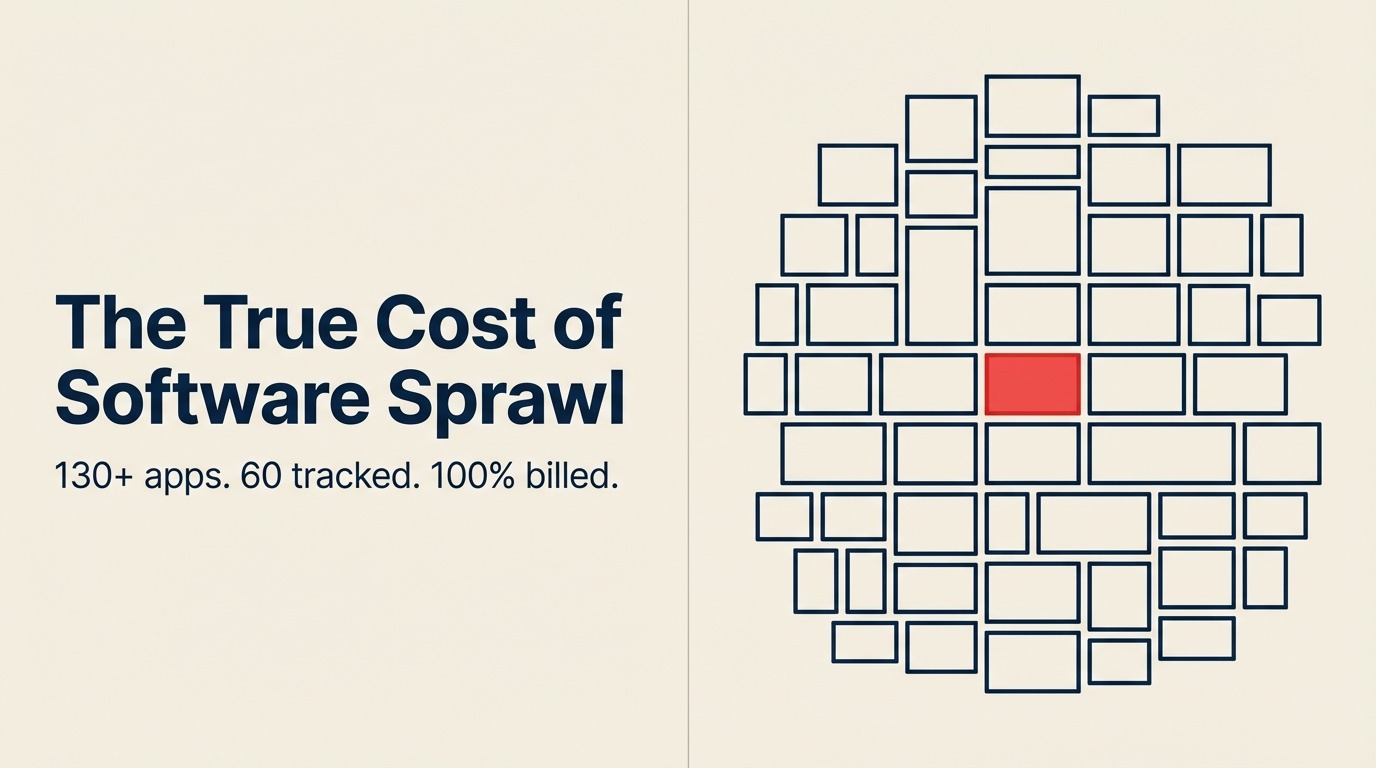
The True Cost of Software Sprawl at Mid-Market Companies
Jan 30, 2026 · Currently reading
The True Cost of Software Sprawl at Mid-Market Companies
Turn this article into takeaways for your work.
Each assistant summarizes the article only for you and suggests best practices for your work.
The average mid-market company runs 130+ SaaS applications. IT knows about maybe 60 of them. Finance is paying for all of them. Productiv's SaaS Intelligence report found that large enterprises average over 300 apps company-wide, with utilization rates leaving a third of that spend effectively wasted.
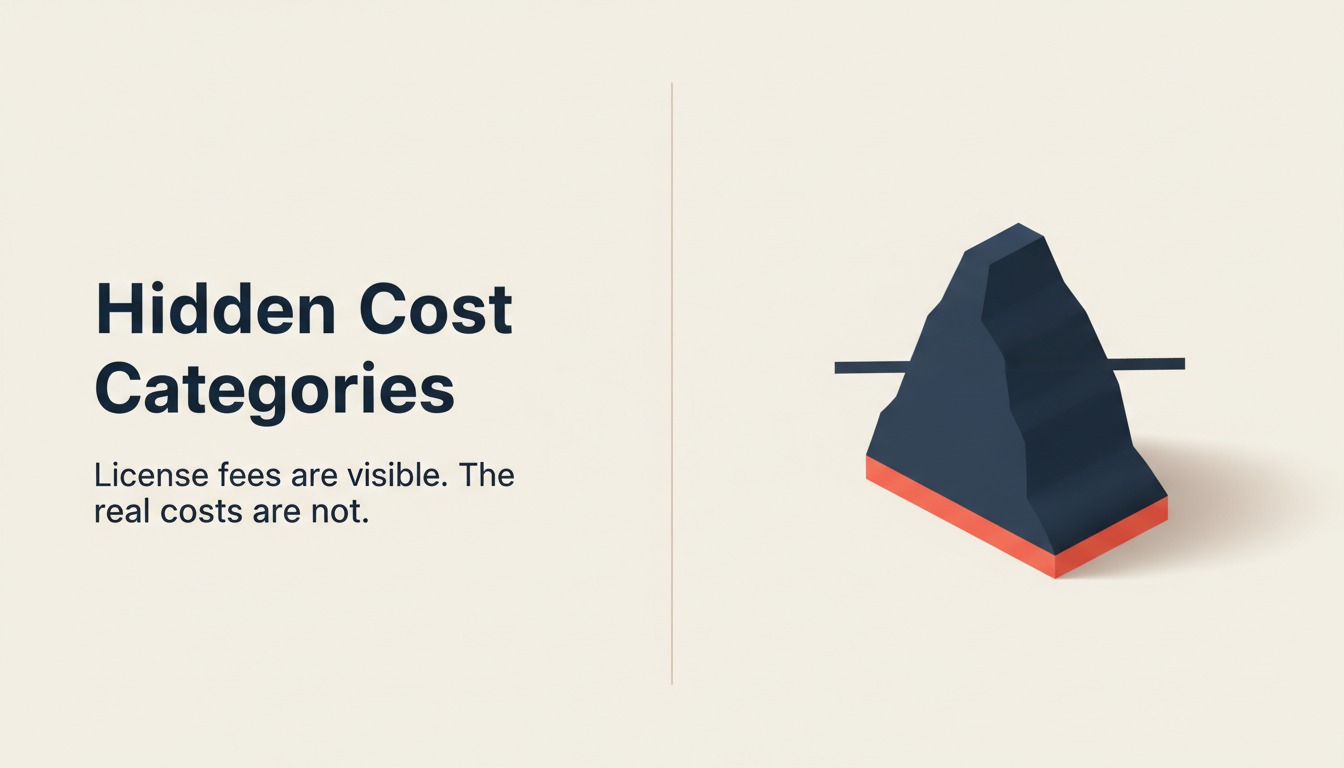
The visible cost is easy to find: open the corporate credit card statement and start adding. But CFOs who approach sprawl as a license consolidation exercise are solving the wrong problem. The license costs are often the smallest part. The real cost is what those 130 tools are doing to your organization's attention, security posture, and operational efficiency. Those numbers don't show up in a budget line.
The Three Costs Most Sprawl Analyses Miss
Standard software audits look at license fees, usage rates, and redundancy. Those matter. But three categories of cost almost always get left off the ledger.
Integration maintenance cost. Every tool that connects to another tool requires a maintained integration. APIs change, authentication breaks, data formats drift. In a company running 130 applications, the number of active integrations is often 40–80 depending on how tools are wired together. Each of those integrations has a maintenance burden: someone monitors it, someone fixes it when it breaks, someone manages the vendor relationship when the API changes with 30 days' notice.
A Rework analysis of mid-market IT teams suggests that integration maintenance consumes 20–30% of IT bandwidth in companies that haven't actively managed their tool stack. That's not a line item. It's capacity that isn't being spent on product infrastructure, security improvements, or anything else that moves the business forward. Teams considering a consolidation move often start with preparing data before a migration to understand the actual scope of what they're working with.
Duplicate data entry and reconciliation. When a company runs separate tools for CRM, invoicing, project management, and customer success without clean integrations, someone (usually several someones) is manually transferring data between systems. A deal closes in the CRM. Someone manually creates a project in the PM tool. Someone manually creates the invoice in the billing system. Someone manually updates the customer success platform.
The labor cost here is real. At a 500-person company, if 50 people spend an average of 2 hours per week on manual data reconciliation, that's 5,200 labor-hours per year. At an average fully-loaded cost of $75/hour for mid-market knowledge workers, that's $390,000 annually in manual reconciliation labor. Most companies have no idea this cost exists because it's distributed invisibly across every team.
The tool-switching focus cost. Cognitive switching is expensive. Every time an employee moves from one tool to another (checking a message in Slack, updating a task in Asana, logging a call in Salesforce, updating a timeline in Notion), there's a context-switching penalty that cognitive science research from the American Psychological Association estimates imposes meaningful costs in complex knowledge work, including recovery time after each switch. In companies where employees routinely work across six to eight applications in a single morning, the aggregate productivity loss is significant and unmeasured.
This isn't an argument to run everything in one tool. It's an argument to be deliberate about how many context switches you're asking your people to absorb. Every tool you add to the stack has a cognitive tax attached to it that's paid daily by everyone who uses it.
How Sprawl Accelerates
Understanding the cost of sprawl requires understanding the mechanism that creates it. Software sprawl doesn't happen because IT stopped governing. It happens because the organization's buying behavior is structurally distributed, and individual purchase decisions that look rational in isolation become irrational in aggregate.
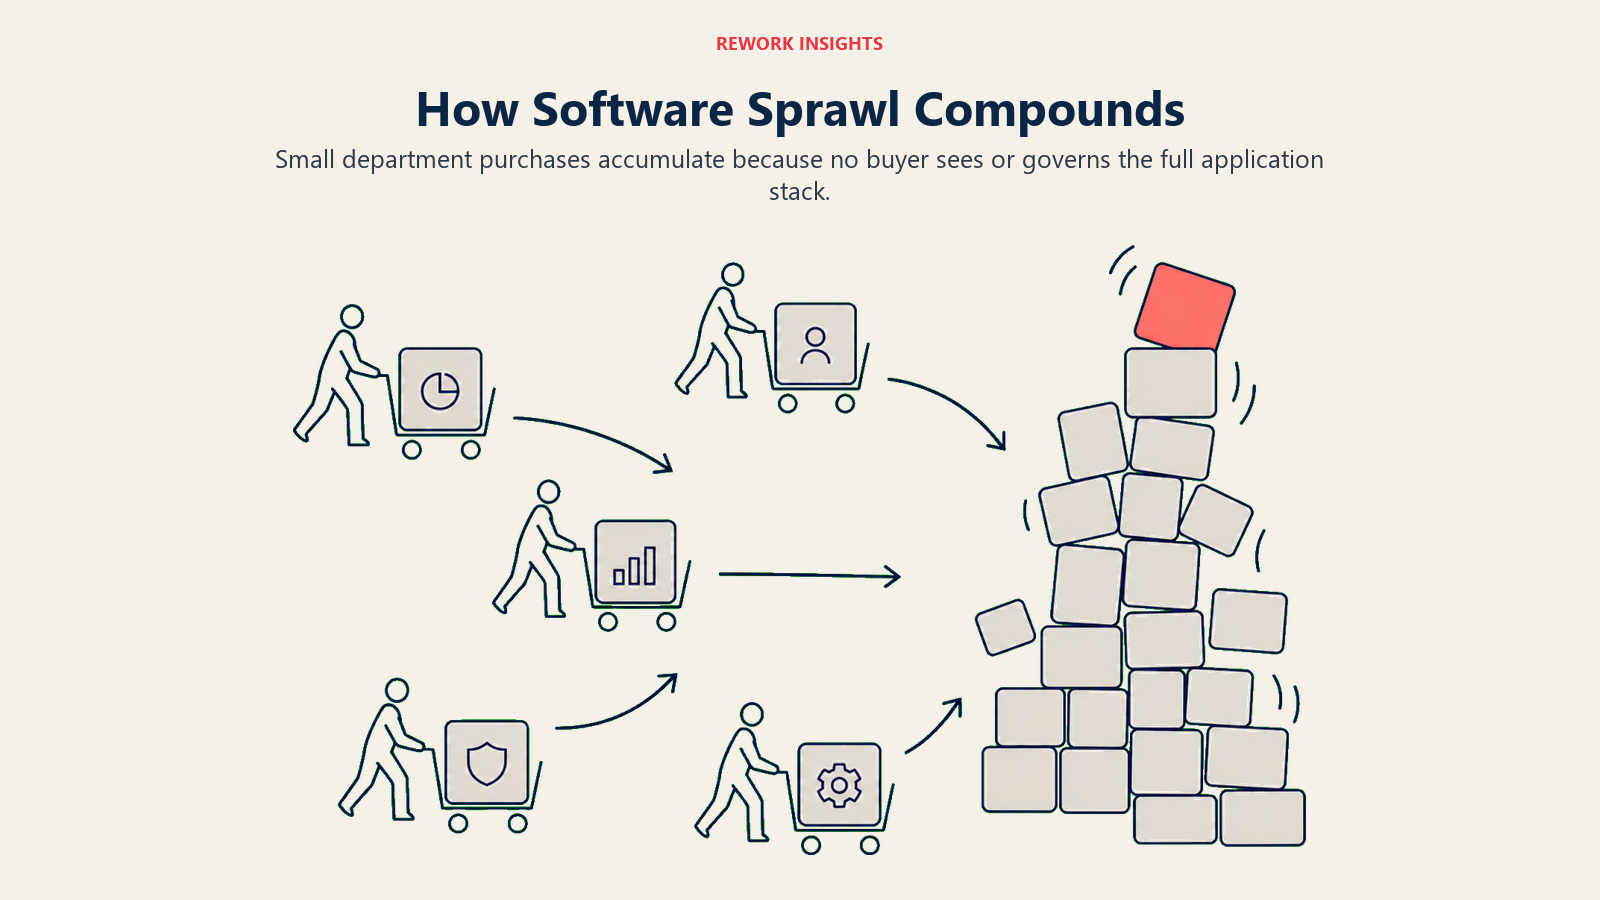
Here's the pattern: a sales team needs a better prospecting tool. The sales leader finds one that costs $3,000/year and gets approval from their manager, who has authority up to $5,000. The tool gets deployed. A year later, the customer success team needs a health scoring tool. Same process, $4,000/year, approved at the manager level. Marketing needs a new SEO tool. Approved. RevOps needs an enrichment tool. Approved.
None of these decisions is wrong on its own. But no single decision-maker has visibility into the aggregate. The CFO approved a budget. Each team is spending within that budget. Nobody has a complete view of the full stack, and nobody has authority to consolidate across team lines without an executive-sponsored initiative.
IT can't stop this pattern because the purchases happen before IT sees them, often on business unit credit cards. Finance can't see it clearly because the costs are distributed across dozens of cost centers. The result is organic sprawl that compounds every quarter.
The Shadow IT Dynamic
Shadow IT, meaning tools employees buy without IT's knowledge, accelerates this pattern. But the typical response to shadow IT misdiagnoses the problem.
When employees go around IT to buy tools, they're usually telling you something about unmet needs. The design team is using a paid Figma plugin IT doesn't know about because the approved design tools don't support the workflow they need. The sales team is using a personal AI writing tool because the approved sales stack doesn't have that capability. The shadow IT isn't rogue behavior. It's a signal.
The correct response isn't to crack down on unauthorized purchases. It's to audit shadow IT for patterns that reveal gaps in the approved stack. If 15 people have individually paid for the same category of tool, that's a legitimate need your official stack isn't meeting.
Shadow IT also has an important role in experimentation. Small teams trying new tools before company-wide rollout is healthy. The problem is when those experiments never get rationalized. When the experiment becomes permanent, with no formal evaluation, governance, or integration plan behind it, you've traded short-term flexibility for long-term technical debt. That's the same failure mode that makes switching CRM platforms later more expensive than it needs to be: accumulated technical debt from un-governed experiments.
The Software Sprawl Audit Matrix
To prioritize which tools to keep, consolidate, or eliminate, evaluate each application across four dimensions:
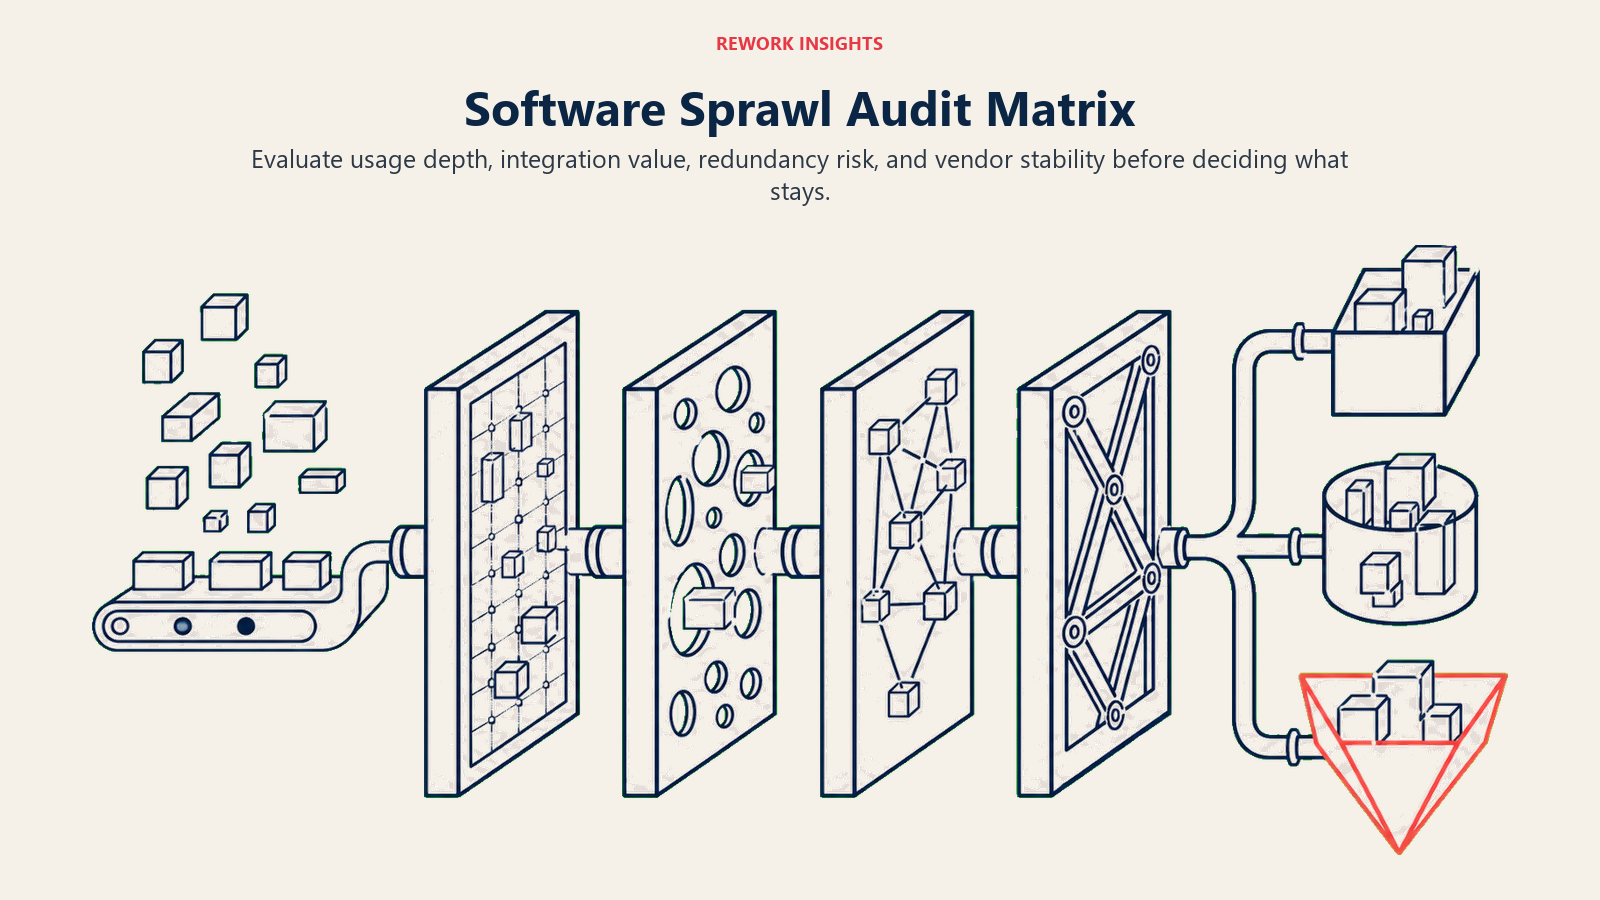
Usage Depth: How deeply embedded is this tool in daily workflows? A tool that 80% of users open every day is different from one that 20% of users open monthly. Score 1–5 based on active users, frequency, and whether workflows break if it disappears.
Integration Value: How much does this tool contribute to your data flows? A tool with clean bidirectional integrations to your core systems (CRM, ERP, data warehouse) has structural value beyond its direct features. A standalone tool that's essentially an island adds integration debt when it eventually needs to connect. Score 1–5 based on integration quality and criticality.
Redundancy Risk: Does another tool you already own cover 80%+ of the same use case? If yes, you have a consolidation candidate. Score 1–5 inverted: a 5 means high redundancy with existing tools, a 1 means it serves a genuinely unique function.
Vendor Stability: Is this vendor going to exist in three years? Seed-stage startups in your stack are a risk. Tools that have had three rounds of layoffs in 18 months are a risk. Score 1–5 based on funding status, revenue size, and strategic importance to the vendor's own roadmap.
The output is a grid. Any tool scoring low on Usage Depth and Integration Value, and high on Redundancy Risk, is an elimination candidate. Any tool scoring high on Usage Depth but also high on Redundancy Risk is a consolidation decision. Someone will lose access to a tool they like, and that's where change management matters.
Consolidation Without Revolt
Most software rationalization efforts fail not during the audit but during rollout. The tools that get cut are tools that people actually use. The teams losing access are rarely the ones who drove the consolidation initiative. And the political dynamics inside mid-market organizations mean that functional leaders can often protect their preferred tools even when the CFO's office is sponsoring a reduction. The CRM rollout and adoption guide covers the same stakeholder dynamics for the most common consolidation category: sales and revenue tooling.
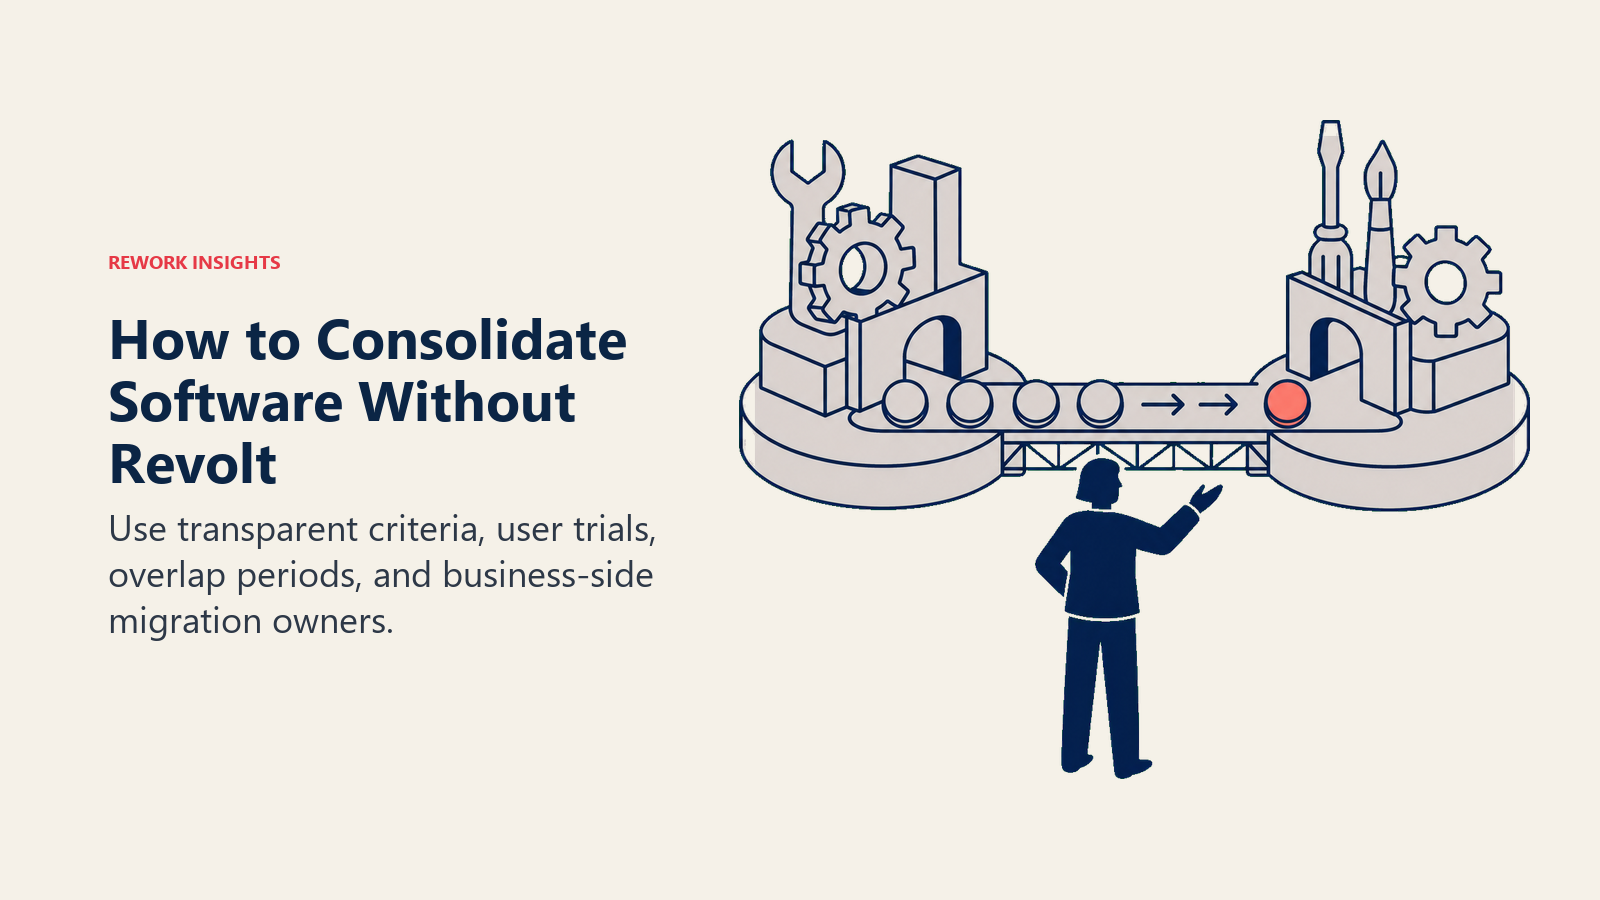
The consolidation failures that repeat most often follow a pattern: IT or finance identifies the redundant tools, presents a list of what's being cut, and asks teams to migrate to the consolidation target. Teams push back. The timeline slips. Three months in, half the "eliminated" tools are still running because someone's workflow depends on them and the migration was never fully completed.
What works instead:
Start with data, not decisions. Run the audit matrix before any tool is named for elimination. Show the analysis before the recommendation. Teams that understand the criteria are less likely to interpret the outcome as arbitrary.
Let the consolidation target compete. If you're consolidating four project management tools down to one, run a 30-day evaluation with actual users from each displaced team. Let them submit the use cases their current tool handles that the consolidation target doesn't. Give the consolidation vendor a chance to respond. This isn't a sales process. It's a legitimacy process. Teams who participated in the evaluation accept the outcome better than teams who had a decision imposed.
Migrate, don't cut. The failure mode is eliminating the old tool before the new workflow is stable. Set a 60-day overlap period where both tools run in parallel, with active migration support. Then cut the old tool only when usage data shows the team has actually moved.
Assign migration owners, not just IT tickets. Migrations fail when they're treated as IT projects. They succeed when a business-side owner in each affected team is accountable for their team's migration completion. That person has the organizational trust to coach their colleagues through the change in a way that an IT ticket cannot.
The 30-Day Sprawl Audit
Here's a practical starting point any COO or IT leader can execute without external consultants.
Week 1: Discovery. Pull all SaaS charges from corporate credit cards and expense reports for the past 12 months. Cross-reference with IT's known application inventory. The gap between those two lists is your shadow IT map.
Week 2: Classification. Assign each tool to one of four categories: Core (essential to daily operations), Departmental (critical to one team, not cross-functional), Experimental (in trial or limited use), Orphaned (nobody owns it or uses it actively).
Week 3: Matrix Scoring. Apply the Software Sprawl Audit Matrix to every Core and Departmental tool. Flag any tool with high Redundancy Risk for consolidation review. Any Orphaned tool gets scheduled for cancellation.
Week 4: Prioritized Recommendations. Produce a ranked list of the top 10 consolidation or elimination candidates, with estimated cost savings, estimated migration complexity, and recommended ownership for the decision. Present to the executive team with the criteria visible, not just the conclusions.
That process consistently identifies 15–25% of SaaS spend as either redundant or orphaned. At a 500-person mid-market company spending $2M annually on software, that's $300K–$500K in recoverable spend. Gartner's software asset management guidance puts the average enterprise SaaS optimization opportunity at 20–30% of current spend when organizations conduct structured audits rather than reactive license reviews. But the real value is the integration debt retired and the IT bandwidth recaptured.
What Changes When You Get This Right
Companies that run structured sprawl audits every 12–18 months develop organizational discipline that goes beyond the license savings. They build cleaner data architectures because fewer disconnected tools means fewer integration seams. They reduce security exposure because every tool in the stack is a potential attack surface. And they reduce the organizational attention tax that distributed tooling creates.
The procurement model also matures. Rather than department-level buying without visibility, the CFO and CIO develop a joint approval process for any new SaaS above a threshold, typically $5K–$10K annually. That threshold is low enough to catch most meaningful purchases while giving teams flexibility for small experiments. Understanding CAC payback and SaaS unit economics is part of that maturation: procurement decisions start to look more like investment decisions.
The goal isn't to run the entire company on five tools. It's to be deliberate about every tool you add, understand the aggregate cost of the stack, and retire tools that aren't earning their complexity overhead.
Learn More
- The New B2B Buying Committee: Who's Really in the Room — the governance structure that prevents sprawl at the point of purchase
- Seat-Based Pricing Is Dying. Here's What's Replacing It — how changing pricing models affect what software consolidation actually costs