Tableau vs Looker: Analyst Craft or Governed Definitions in 2026?
Turn this article into takeaways for your work.


Each assistant summarizes the article only for you and suggests best practices for your work.
Updated August 2026
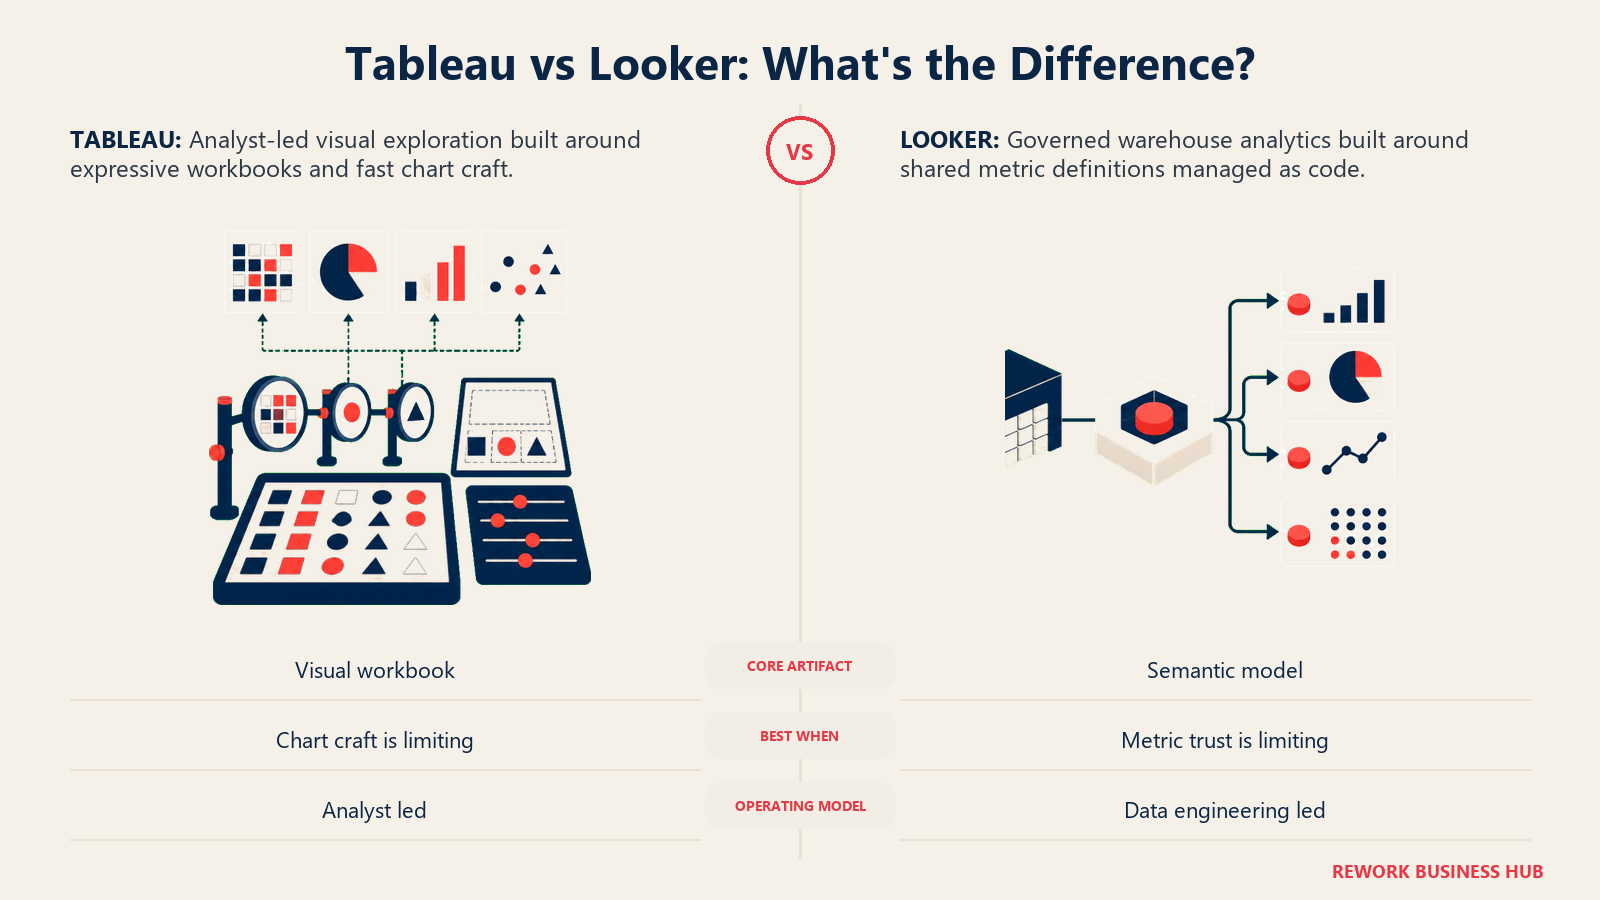
Most teams arrive here from one of two very different frustrations. Either your charts are slow to build and every request lands on one overworked analyst, or your executive dashboards quietly disagree about what revenue was last quarter. Those are not the same problem, and Tableau and Looker are not really competing to solve the same one. Tableau optimises for the analyst's hands: visual exploration, chart craft, and a hiring pool full of people who already know the tool. Looker optimises for the organisation's definitions: one governed semantic layer written in LookML and version controlled in git, so "revenue" resolves the same way in every dashboard, export and AI answer.
This is written for the analytics lead, CIO, data platform owner or finance leader picking a company standard, and it treats pricing transparency as a decision factor in its own right. Tableau publishes per-user rates you can model in an afternoon. Google publishes nothing for Looker, so evaluating it costs you a sales cycle before you see a single number. We'll cover what each charges for, cost modelling at 25, 50 and 100 users, the modeling layers, connectivity, governance, embedding, hiring, and where the 2026 AI features actually stand. One housekeeping note first, because a large share of the people searching this phrase are looking for a different product entirely.
First, This Is Looker, Not Looker Studio
Google owns two products with almost the same name and close to nothing in common beyond the branding. Looker, also called Looker (Google Cloud core), is the enterprise BI platform built on LookML: quote-only, sold on multi-year commitments, and built around the governed semantic model. Looker Studio is the free reporting tool formerly called Google Data Studio, with no modeling language and no LookML, aimed at fast ad hoc reports on Google and marketing data.
Google's own documentation draws the line at governance: Looker is the choice when you need "governance for key metric definitions" and strict data access permissions, while the free tool suits "one-off visualizations or reports" on a single or pre-aggregated data source (Google Cloud documentation). Looker can also be self-hosted or run in another cloud; Looker Studio is Google-hosted only.
| Looker (Google Cloud core) | Looker Studio | |
|---|---|---|
| What it is | Enterprise BI platform with a code-based semantic layer | Free self-serve reporting and dashboarding tool |
| Modeling layer | LookML, version controlled in git | None; you connect a source and build a report |
| Governance | Central metric definitions, row-level access controls | Report-level sharing, no metric governance |
| Pricing | No published price, quote only, 1 to 3 year term | Free; Looker Studio Pro adds a paid per-user, per-project licence at $9 per user per project per month |
| Deployment | Google Cloud managed, another cloud, or your own servers | Google-hosted only |
| Typical buyer | Data platform team standardising company metrics | An analyst or marketer who needs a report this week |
If you actually came here looking for the free tool, our Power BI vs Looker Studio comparison is the right page, and our best Looker alternatives roundup covers the semantic-layer field more broadly. Everything below this section is about the paid enterprise platform.
TL;DR
| Tableau | Looker (Google Cloud core) | |
|---|---|---|
| Owned by | Salesforce | Google Cloud |
| Optimised for | Visual exploration and chart craft in the analyst's hands | One governed definition of every metric, shared org-wide |
| Core artefact | The workbook and the dashboard | The LookML model |
| Entry role rate | Viewer $15/user/month billed annually (Standard edition) | Not published |
| Full-authoring role rate | Creator $75/user/month billed annually (Standard edition) | Not published; Developer Users are quoted |
| Contract | Annual contract required on every product | 1, 2 or 3 year term |
| Where data lives | Hyper extracts or live connections, your choice | In-database by design, BigQuery-first |
| Version control for logic | Not native to workbooks | Native git, with continuous integration testing |
| 2026 AI | Tableau Agent plus Pulse, gated behind Cloud+ or Tableau+ | Conversational Analytics and Gemini, grounded in LookML |
| 2026 Gartner Magic Quadrant | Leader, 14th consecutive time | Leader, third consecutive year |
Key Facts
- Tableau's pricing page now leads with editions: Tableau Standard from $15 USD/User/Month (Billed annually) and Tableau Enterprise from $35 USD/User/Month (Billed annually), with Cloud+ and the Tableau+ bundle at contact sales, and "all Tableau products require an annual contract, billed annually" (tableau.com/pricing).
- Within Tableau's Standard edition the three role rates are Creator $75, Explorer $42 and Viewer $15, each per user per month billed annually, which is why the edition's headline "from $15" is the Viewer rate, not the builder rate (tableau.com/pricing/teams-orgs).
- Looker publishes no platform price. Standard, Enterprise and Embed editions are all "call sales" on 1, 2 or 3 year commitments, and each edition includes 1 production instance, 10 Standard Users and 2 Developer Users (cloud.google.com/looker/pricing).
- The one Looker rate Google does print is AI overage: from 1 October 2026, Conversational Analytics costs $3.00 per 1 million input data tokens and $20.00 per 1 million output data tokens beyond each tier's included quota, after a period of unlimited fair use through 30 September 2026 (cloud.google.com/looker/pricing).
- Both platforms are Leaders in the 2026 Gartner Magic Quadrant for Analytics and Business Intelligence Platforms, published 29 June 2026: Salesforce Tableau for the 14th consecutive time, and Google for the third consecutive year (Salesforce, Google Cloud Blog).
Who Each Platform Is Really For
The pitch decks converge, so ignore them and look at who gets value on day 90. Tableau's natural buyer has analysts who think in charts and a backlog of visual questions nobody has time to answer. Looker's has a warehouse already in decent shape, a data engineering function that writes SQL and uses git, and one specific pain: numbers that disagree across teams.
| Tableau | Looker | |
|---|---|---|
| Primary buyer | Analytics leads and BI teams serving business users visually | Data platform and data engineering teams setting company standards |
| The pain that triggers the purchase | "Building charts takes too long and they look bad" | "Our dashboards disagree about the same number" |
| Assumes you already have | Analysts who want to explore data hands-on | A warehouse and people comfortable with SQL and git |
| Data engineering prerequisite | Low; an analyst can be productive on day one | Real; someone has to own and maintain the LookML model |
| Where it wins | Ad hoc exploration, chart craft, visual storytelling | Metric consistency, embedded analytics, AI grounded in real definitions |
| Where it struggles | Metric drift across many independently built workbooks | Fast, throwaway visual exploration outside the model |
The adoption pattern follows from that. Tableau spreads from analysts outward, which is why finance and RevOps teams often end up with it before IT has an opinion. Looker gets installed by a platform team and then consumed, which is slower but leaves data engineering holding a code artefact they own in git. Neither profile is more mature. But if you cannot name the person who will own a semantic model, buying Looker means hiring them or watching the model rot.
Pricing Transparency Is a Decision Factor, Not a Footnote
This deserves its own section because it changes how you run the evaluation, not just what you pay. Tableau publishes enough to let you build a real budget yourself: edition pricing on the front of the page, per-role rates behind it, and an explicit statement that every product needs an annual contract. You can model 100 users before you talk to anyone.
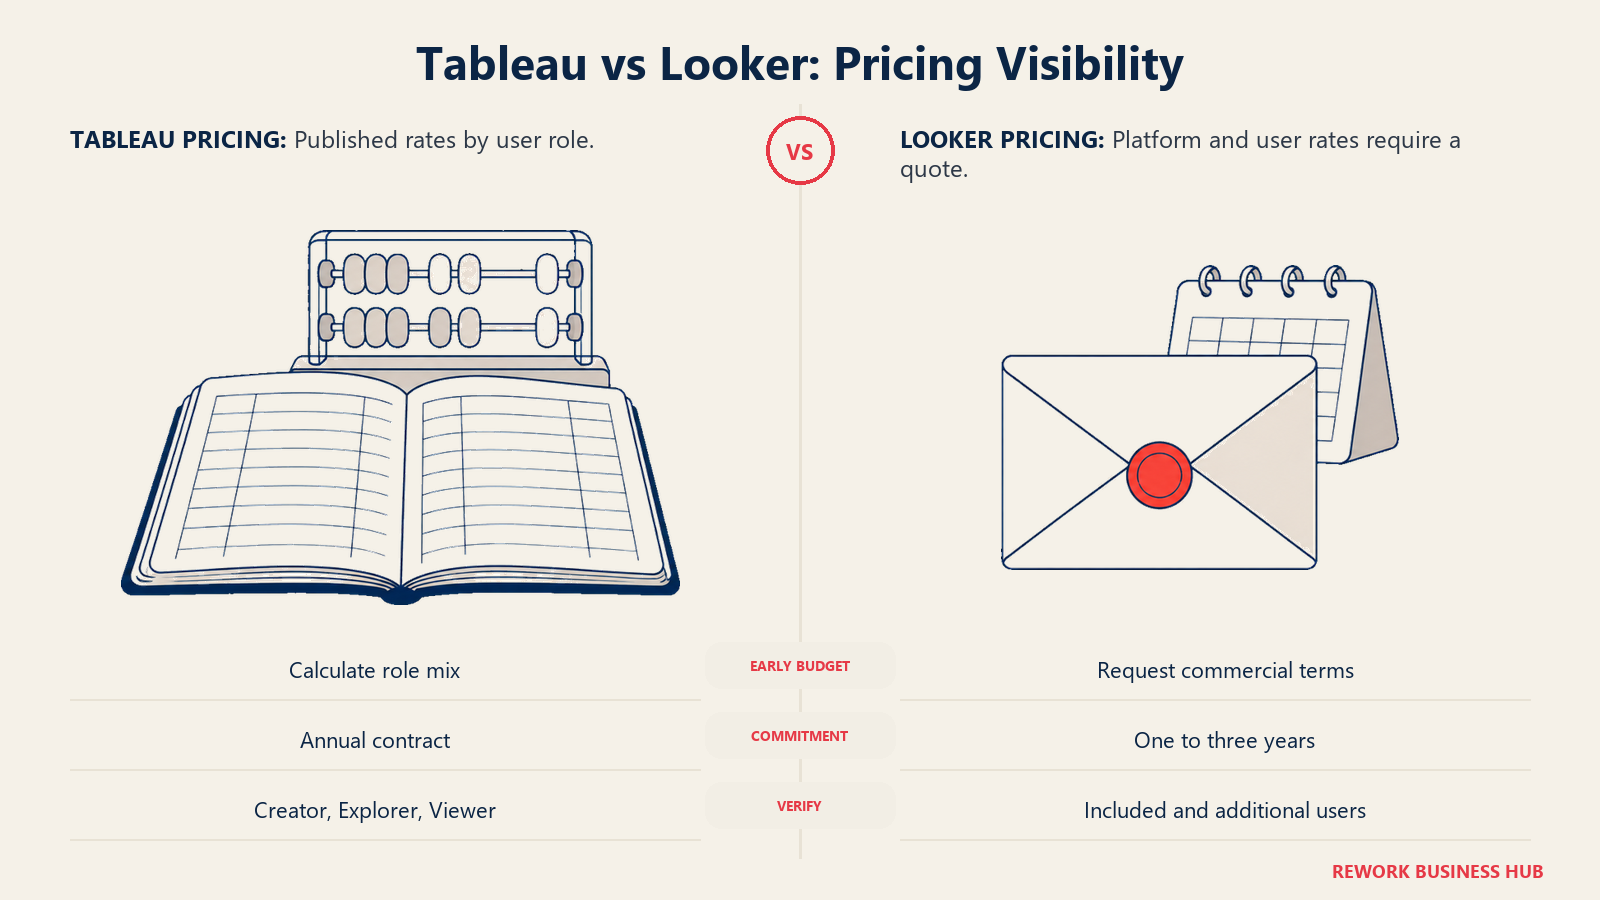
Looker publishes nothing. Standard, Enterprise and Embed all say call sales. What Google does publish is the shape of the deal, which is genuinely useful: each edition includes one production instance, 10 Standard Users and 2 Developer Users, and the commitment runs 1, 2 or 3 years. So you know you are buying a platform with a small included allocation, on a multi-year term, and that every user beyond twelve is a line item somebody quotes you.
| Tableau | Looker | |
|---|---|---|
| Headline price on the vendor site | Standard from $15 and Enterprise from $35 USD/User/Month (Billed annually) | None at any tier |
| Per-role rates published | Yes: Creator $75, Explorer $42, Viewer $15 per user/month billed annually (Standard) | No |
| What is included out of the box | Licensed per user; no bundled allocation | 1 production instance, 10 Standard Users, 2 Developer Users per edition |
| Minimum commitment | Annual contract on every product | 1, 2 or 3 year term |
| Can you budget without a sales call | Yes, from published rates | No |
| One rate Google does publish | Not applicable | Conversational Analytics overage from 1 Oct 2026: $3.00 per 1M input tokens, $20.00 per 1M output tokens |
| Practical evaluation cost | Trial and self-serve maths | A sales cycle before you see a number |
The consequence is procedural. If you need a shortlist number for a board paper next week, Tableau can be on it and Looker cannot. If procurement requires three comparable quotes, add weeks to any Looker evaluation. And a 1 to 3 year term means committing before you have operated the platform at scale, a different risk profile from an annual per-seat renewal. None of that makes Looker the wrong choice. It does mean the evaluation itself is more expensive, and you should plan for that rather than discover it. Be careful, too, with any third-party figure claiming "Looker costs $X". Those numbers circulate widely and none come from Google. Treat them as anecdotes from other buyers' contracts, not a rate card.
What Each Platform Actually Charges For
Tableau charges for what a person is allowed to build. Looker charges for a platform, then for the people who use it, with development rights as the scarce thing.
| Tableau (Cloud, Standard edition) | Looker | |
|---|---|---|
| Read-only tier | Viewer: filter and drill into dashboards, $15/user/month billed annually | Viewer User: read-only dashboards and Looks; rate not published |
| Interact and customise tier | Explorer: edit workbooks, build from published sources, no new connections, $42/user/month billed annually | Standard User: dashboards, Looks, Explore, SQL Runner, scheduling; rate not published |
| Full authoring tier | Creator: new connections, calculated fields, LOD expressions, publishing, $75/user/month billed annually | Developer User: LookML, Development Mode, Administration, API; rate not published |
| Edition ladder | Standard from $15, Enterprise from $35 USD/User/Month (Billed annually); Cloud+ and Tableau+ contact sales | Standard, Enterprise, Embed, all quote only |
| Where the licensing pinch lands | Every workbook builder needs a $75 Creator seat | Only 2 Developer Users included, so the third model editor triggers a conversation |
That last row is the one to sit with. On Tableau, cost scales with how many people build. On Looker, the scarce resource is the Developer User: real model changes funnel through those seats, and the included allocation is two, so a fourth LookML editor is a licensing conversation rather than a settings change. That friction is exactly what our best Looker alternatives guide covers for teams who want a modeling layer without the platform-plus-seats structure.
Note also that the "$15" on Tableau's front page is the Viewer rate, not a general per-user price. Someone else's table reading "Tableau: $15" and another reading "Tableau: $75" are both correct and describe different people. Always name the role.
Real Cost at 25, 50 and 100 Users
Vendor pages give you a per-seat number, not a bill. So here are three seat-mix scenarios using role definitions that translate across both platforms. Creators build from scratch and need top-tier rights. Explorers are self-service analysts who interact with and customise existing content but rarely start from a blank connection. Viewers only consume finished dashboards.
The Tableau column is modelled from published Standard-edition role rates, multiplied out to an annual total. The Looker column cannot be modelled, and pretending otherwise would be the exact error this article is trying to avoid. What we can show is the mapping and the included allocation, so you know how much of each scenario a base platform actually covers before anything is quoted.
25 users
| Role | Count | Tableau tier (Standard) | Modelled annual cost | Looker equivalent |
|---|---|---|---|---|
| Creators | 5 | Creator, $75/user/month | $4,500 | Developer User, 2 included, 3 quoted |
| Explorers | 8 | Explorer, $42/user/month | $4,032 | Standard User, 10 included, 0 quoted |
| Viewers | 12 | Viewer, $15/user/month | $2,160 | Viewer User, all quoted |
| Total | 25 | $10,692/year modelled | No published price |
50 users
| Role | Count | Tableau tier (Standard) | Modelled annual cost | Looker equivalent |
|---|---|---|---|---|
| Creators | 8 | Creator, $75/user/month | $7,200 | Developer User, 2 included, 6 quoted |
| Explorers | 15 | Explorer, $42/user/month | $7,560 | Standard User, 10 included, 5 quoted |
| Viewers | 27 | Viewer, $15/user/month | $4,860 | Viewer User, all quoted |
| Total | 50 | $19,620/year modelled | No published price |
100 users
| Role | Count | Tableau tier (Standard) | Modelled annual cost | Looker equivalent |
|---|---|---|---|---|
| Creators | 15 | Creator, $75/user/month | $13,500 | Developer User, 2 included, 13 quoted |
| Explorers | 25 | Explorer, $42/user/month | $12,600 | Standard User, 10 included, 15 quoted |
| Viewers | 60 | Viewer, $15/user/month | $10,800 | Viewer User, all quoted |
| Total | 100 | $36,900/year modelled | No published price |
Two honest observations. On the Tableau side, the Creator seat drives the bill: 15 builders account for $13,500 of the $36,900 model, and there is no published volume break. On the Looker side, the shape of the deal tells you something even without a figure. A base edition's 10 Standard and 2 Developer Users cover roughly a pilot team, so in every scenario above, 12 of your users are included and the rest are negotiated. For a wider set of priced options at these team sizes, our best BI tools for 2026 roundup lays out who publishes what.
Modeling: VizQL and LOD Expressions Against LookML and PDTs
This is the philosophical split, and everything else follows from it.
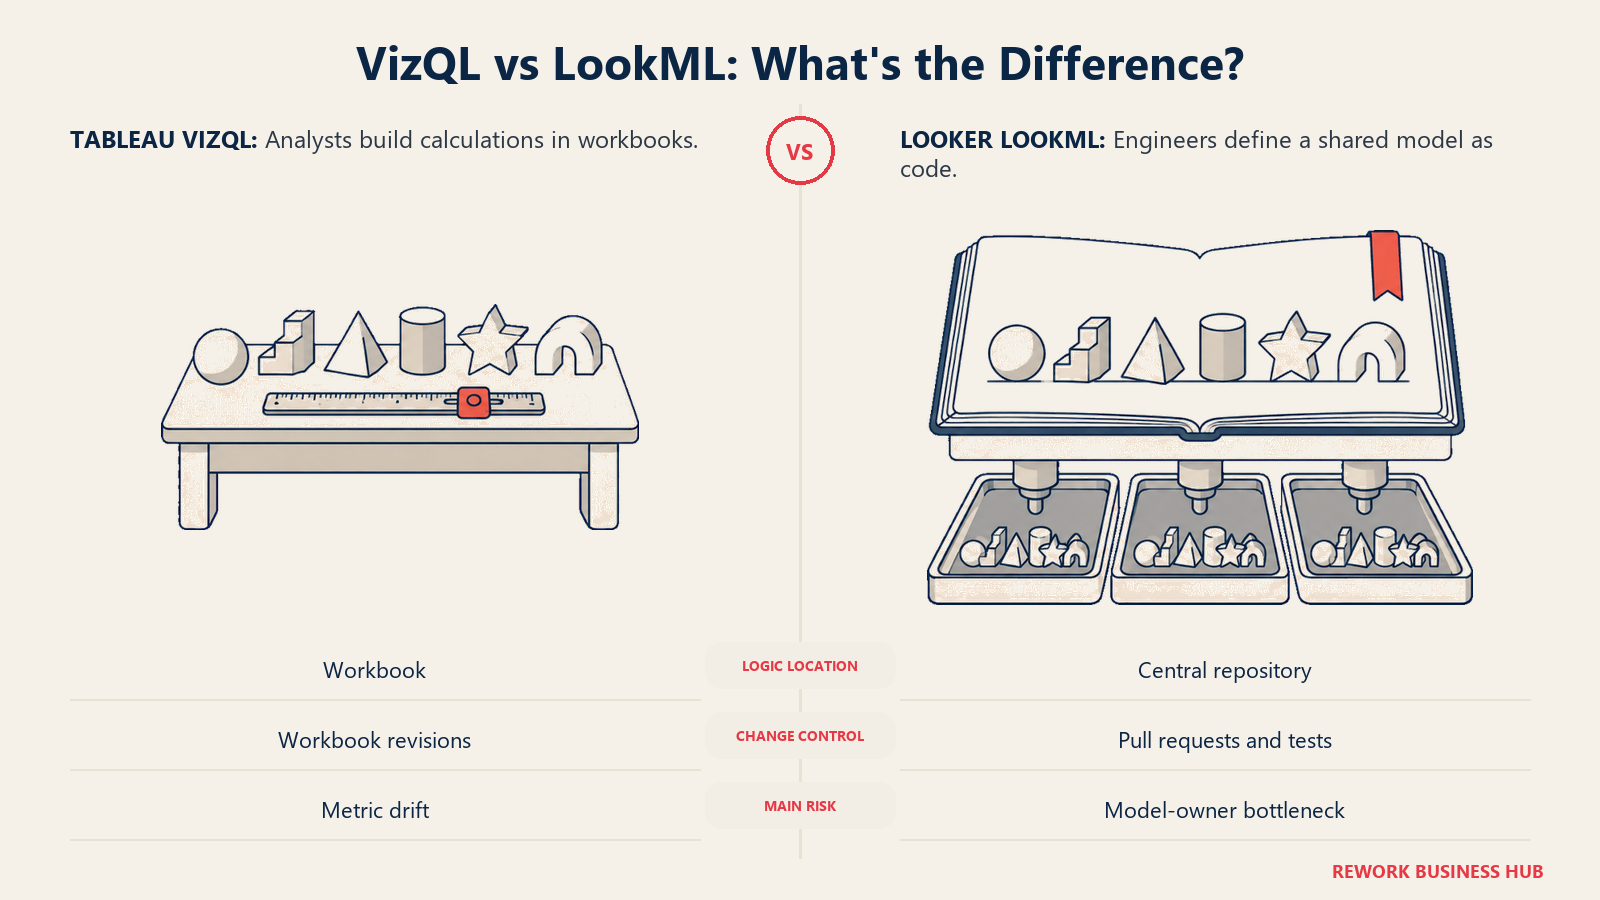
Tableau's engine, VizQL, translates drag-and-drop actions into optimised queries, which is why most everyday chart building never requires a formula. For custom logic you write calculated fields in Excel-like syntax, plus LOD (Level of Detail) expressions using FIXED, INCLUDE and EXCLUDE to control what granularity a calculation runs at, independent of what is on the visual. The model, such as it is, lives inside the workbook. That is what makes Tableau fast, and it is also how two analysts end up with two definitions of the same metric.
Looker inverts it. You define dimensions, measures and joins once in LookML, a declarative modeling language kept in a git repository with pull requests and continuous integration testing, exactly like application code. Persistent derived tables (PDTs) materialise expensive joins into the warehouse on a refresh schedule you control, turning multi-minute queries into fast ones at the cost of managing cadence and warehouse spend. Google names LookML as the reason customers including YouTube, Telenor and Allo Fiber can deploy agents against verified data at scale (Google Cloud Blog).
| Tableau | Looker | |
|---|---|---|
| Query engine | VizQL, translating visual actions into queries | Generates SQL from the LookML model at query time |
| Custom logic | Calculated fields, plus LOD expressions (FIXED, INCLUDE, EXCLUDE) | LookML dimensions, measures, joins and Explores |
| Where the logic lives | Mostly inside the workbook | In a central, shared model repository |
| Version control | Not native to workbook logic | Native git, with pull requests and CI testing |
| Performance tuning | Hyper extracts, aggregation, context filters | Persistent derived tables, aggregate awareness, caching policies |
| Failure mode | Metric drift as workbooks multiply | Model bottleneck when few people hold Developer seats |
| Who has to be competent | The analyst | The data engineer, before the analyst gets value |
Say it plainly. Tableau makes the first dashboard faster; Looker makes the hundredth dashboard trustworthy. If you have twelve dashboards and one analyst, the first property matters more. If you have two hundred dashboards and a quarterly argument about churn, the second one does. The SQL and data modeling guide is worth reading before you commit to either, because a semantic layer on top of a messy warehouse just relocates the mess.
Data Connectivity and Where the Data Lives
Both connect to hundreds of sources. The real difference is architectural: Tableau lets you choose between pulling data into its own engine or querying in place, while Looker is in-database by design and never holds a copy of your data.
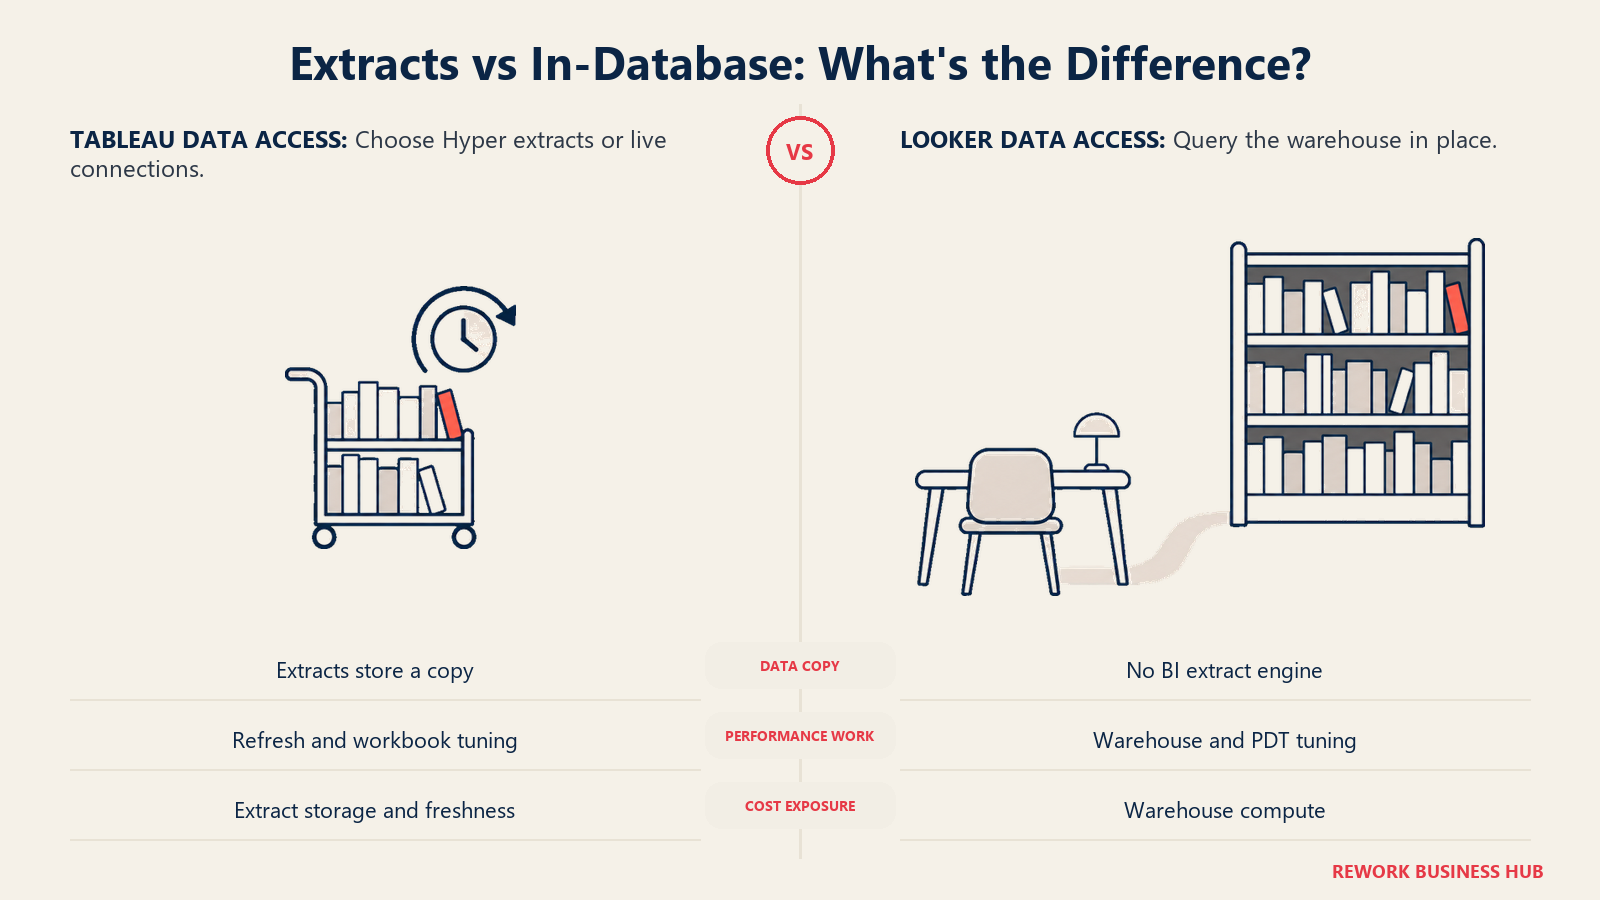
| Tableau | Looker | |
|---|---|---|
| Default architecture | Your choice: Hyper extracts, or a live connection | In-database, queries run against the warehouse |
| In-memory engine | Hyper | None; there is no extract engine to manage |
| Data copy | Extracts create a governed copy you refresh | No copy, the warehouse stays the single source |
| Home ecosystem | Salesforce and Data Cloud, plus a broad legacy database catalogue | BigQuery first, with wide dialect support including Snowflake and Redshift |
| Performance lever | Extract, aggregate, tune the workbook | Persistent derived tables, aggregate awareness, warehouse tuning |
| What this costs you | Extract refresh windows and storage | Warehouse compute on every query, which shows up on a different bill |
| Best when | The warehouse is slow, expensive or not fully modelled | The warehouse is fast and already the source of truth |
That last pair matters more than most buyers expect. Looker moves the performance problem onto your warehouse bill, because every interaction is a query. If BigQuery or Snowflake spend is already a sore point, model that before you sign. Tableau's extracts insulate you, at the cost of managing freshness. Neither is free, they just bill you in different currencies.
Visualization Depth and Design Control
Tableau wins this one and it is not close. Its freeform canvas, container model, device-specific layouts and pixel-level formatting control are the reason it built the reputation it has. Looker's charting is competent and clean and covers standard business visualisation well, but its design ceiling is lower and its product philosophy points elsewhere: the value is that the number is right, not that the chart is beautiful.
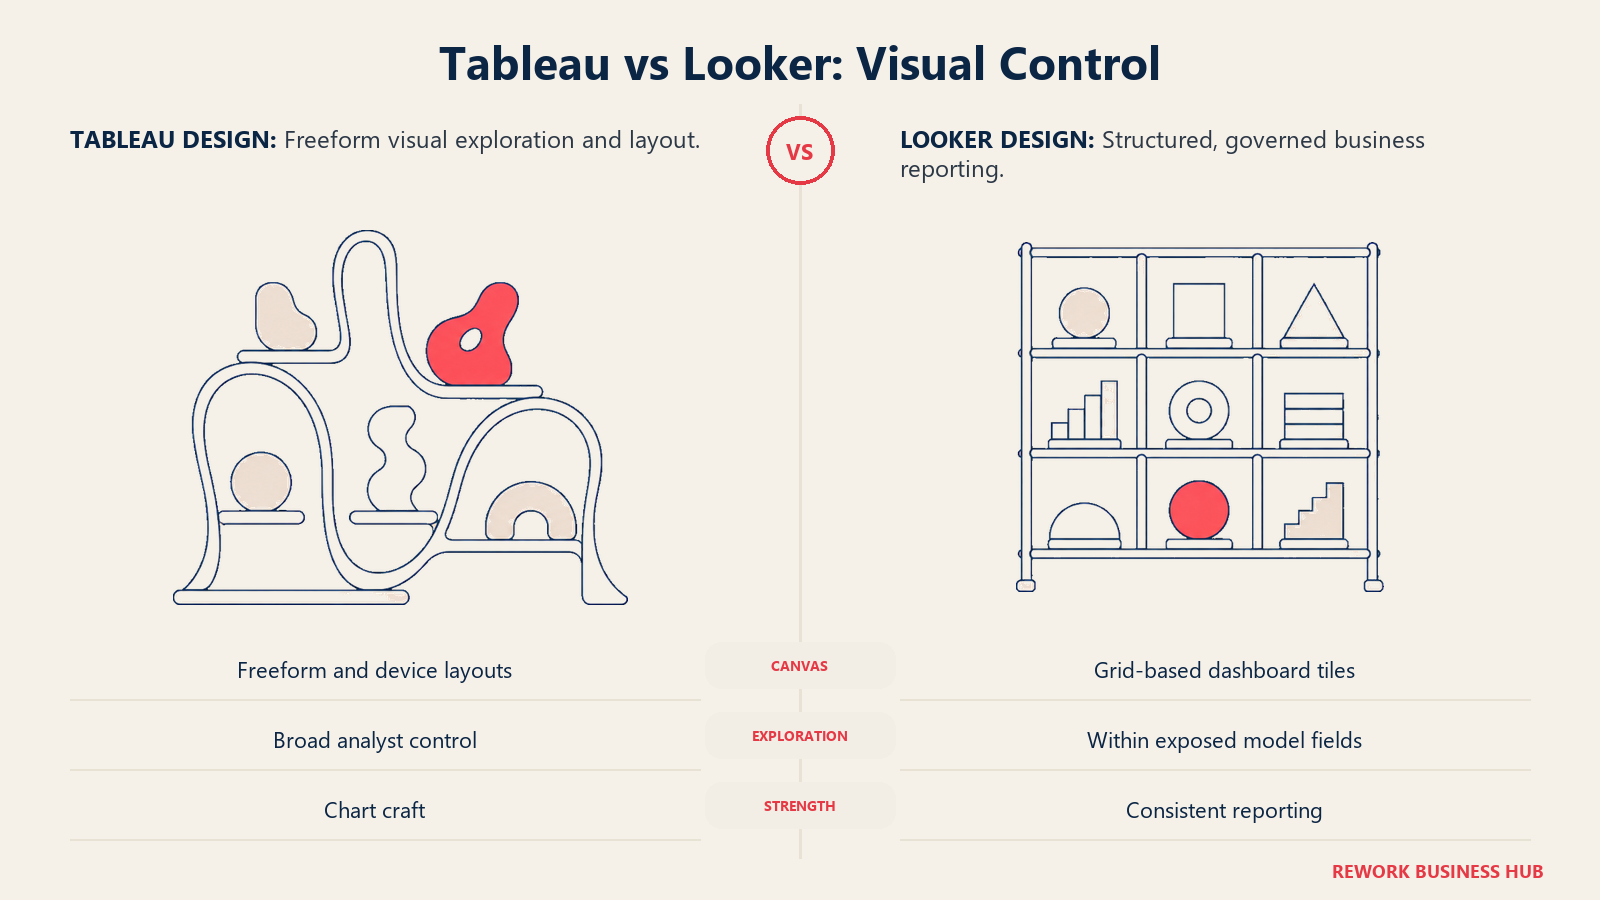
| Tableau | Looker | |
|---|---|---|
| Canvas model | Freeform floating layout, containers, device-specific dashboards | Grid-based dashboard layout, tiles |
| Chart library | Extensive native set plus an extension gallery | Solid standard set, plus custom visualisations via the API |
| Pixel-level control | A long-standing strength | Limited by comparison |
| Ad hoc exploration | Drag and drop against any field, no model required | Explore, but only within what the model exposes |
| Realistic ceiling | Publication-quality visual storytelling | Clear, consistent, governed business reporting |
If design quality is a genuine requirement rather than a preference, that is a real point for Tableau. Whichever way you go, our dashboard design guide applies equally: neither tool saves a dashboard built on the wrong information architecture.
Governance, Permissions and Row-Level Security
Both platforms do governance seriously, but they govern different objects. Tableau governs access to content: who can open which workbook, in which project, on which site. Looker governs the definition itself, which is a stronger guarantee and a heavier commitment.
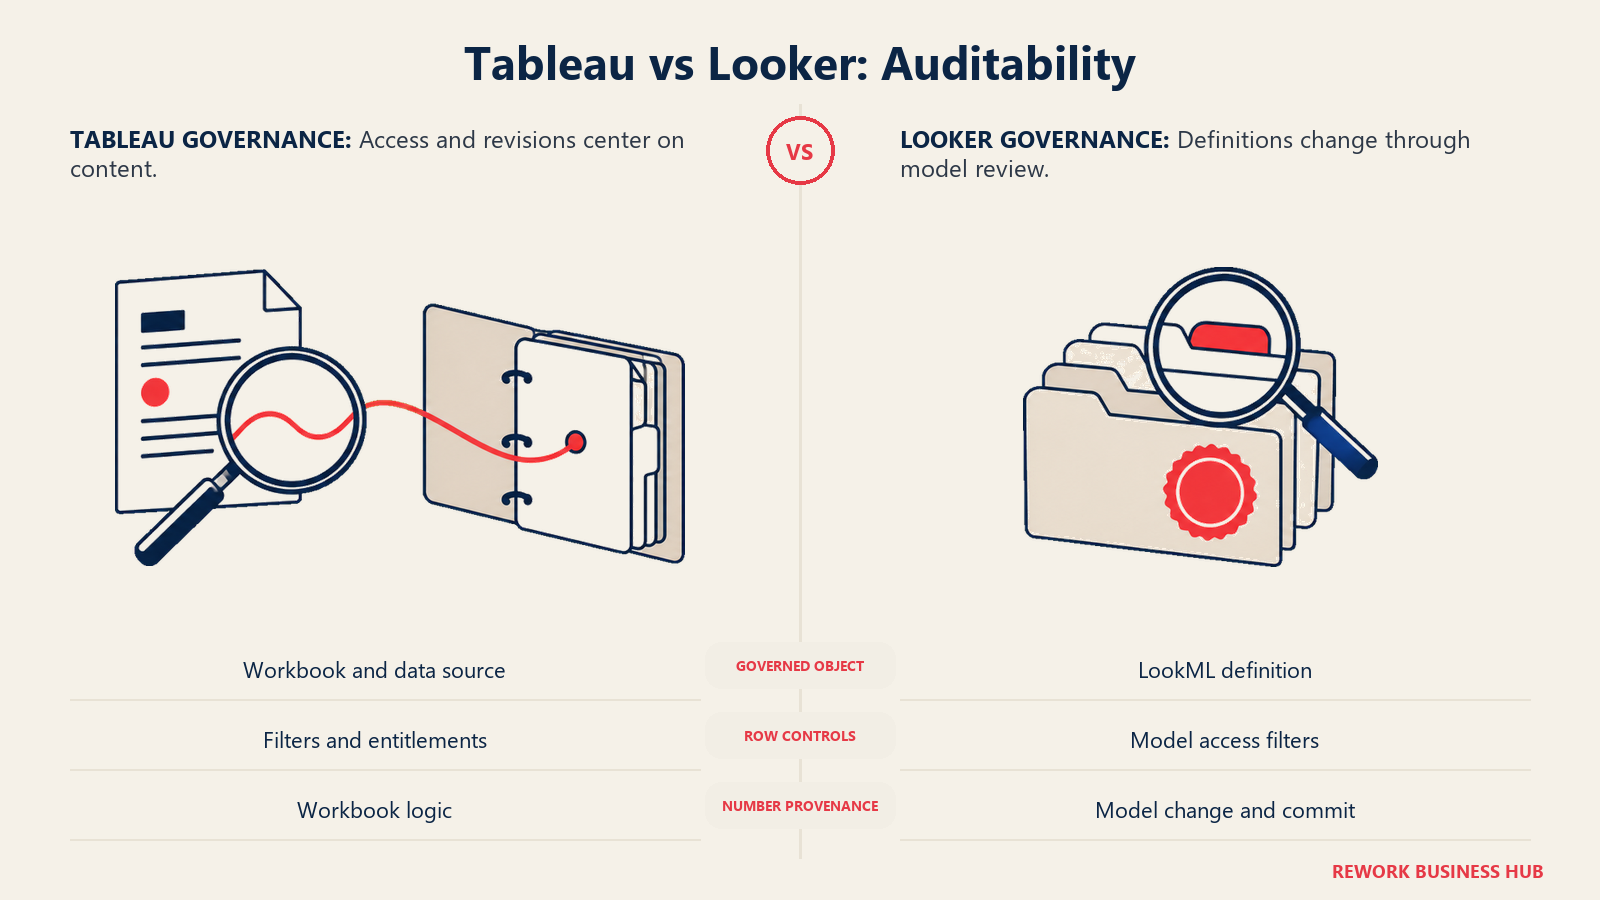
| Tableau | Looker | |
|---|---|---|
| Unit of governance | Content: sites, projects, workbooks, data sources | Definition: the LookML model itself |
| Permission model | Site roles plus project permission templates, lockable or customisable | Model-level access, plus roles and permission sets |
| Row-level security | User filters and entitlement tables applied to data sources | access_filter and access_grant in LookML, enforced at query time |
| Certified data | Certified data sources, plus the Data Management add-on | Every Explore inherits the model, so certification is the default state |
| Change control | Workbook versioning and revision history | Pull requests, code review and continuous integration testing |
| Auditability of a number | Trace to the workbook, then to its data source | Trace to a line of LookML and the commit that changed it |
That last row is the strongest single argument for Looker. When a CFO asks why a number moved, "here is the pull request that changed the definition on 12 May, and who approved it" is an answer Tableau cannot structurally produce for logic written inside individual workbooks. If your finance or audit function has ever needed that answer and not had it, weight this row heavily.
Embedding and External Sharing
Both sell an embedded story, and both price it separately from internal analytics.
| Tableau | Looker | |
|---|---|---|
| Embedded product | Tableau Embedded Analytics, via the Embedding API | Looker Embed edition, a distinct platform edition |
| Pricing | Licensed by consumption or agreement, via sales | Quote only, like every Looker edition |
| API allowance | Not published as a quota | Embed edition allows up to 500,000 query-based API calls per month and 100,000 administrative calls |
| Multi-tenant row-level security | Entitlement tables and user filters | access_filter in LookML, enforced per embedded user |
| Public sharing | Tableau Public, free, public workbooks only | No free public tier |
| Typical buyer | An ISV already invested in Salesforce or Tableau internally | A SaaS product team that wants one modelled definition powering both internal and customer-facing analytics |
Looker's advantage here is structural: the same LookML model serves internal dashboards and the customer-facing embed, so a metric cannot mean one thing to your team and another to your customers. Tableau's is that the embedded experience looks like Tableau, which for a data-heavy product some buyers actively want. Note the API quotas, the closest thing to a capacity number Google publishes: Standard allows up to 1,000 query-based API calls per month, Enterprise up to 100,000, Embed up to 500,000 (cloud.google.com/looker/pricing).
Ecosystem and Hiring Pool
Talent is a real cost that never appears on a pricing page. It decides how fast you staff a rollout, and what happens when the person who built everything resigns.
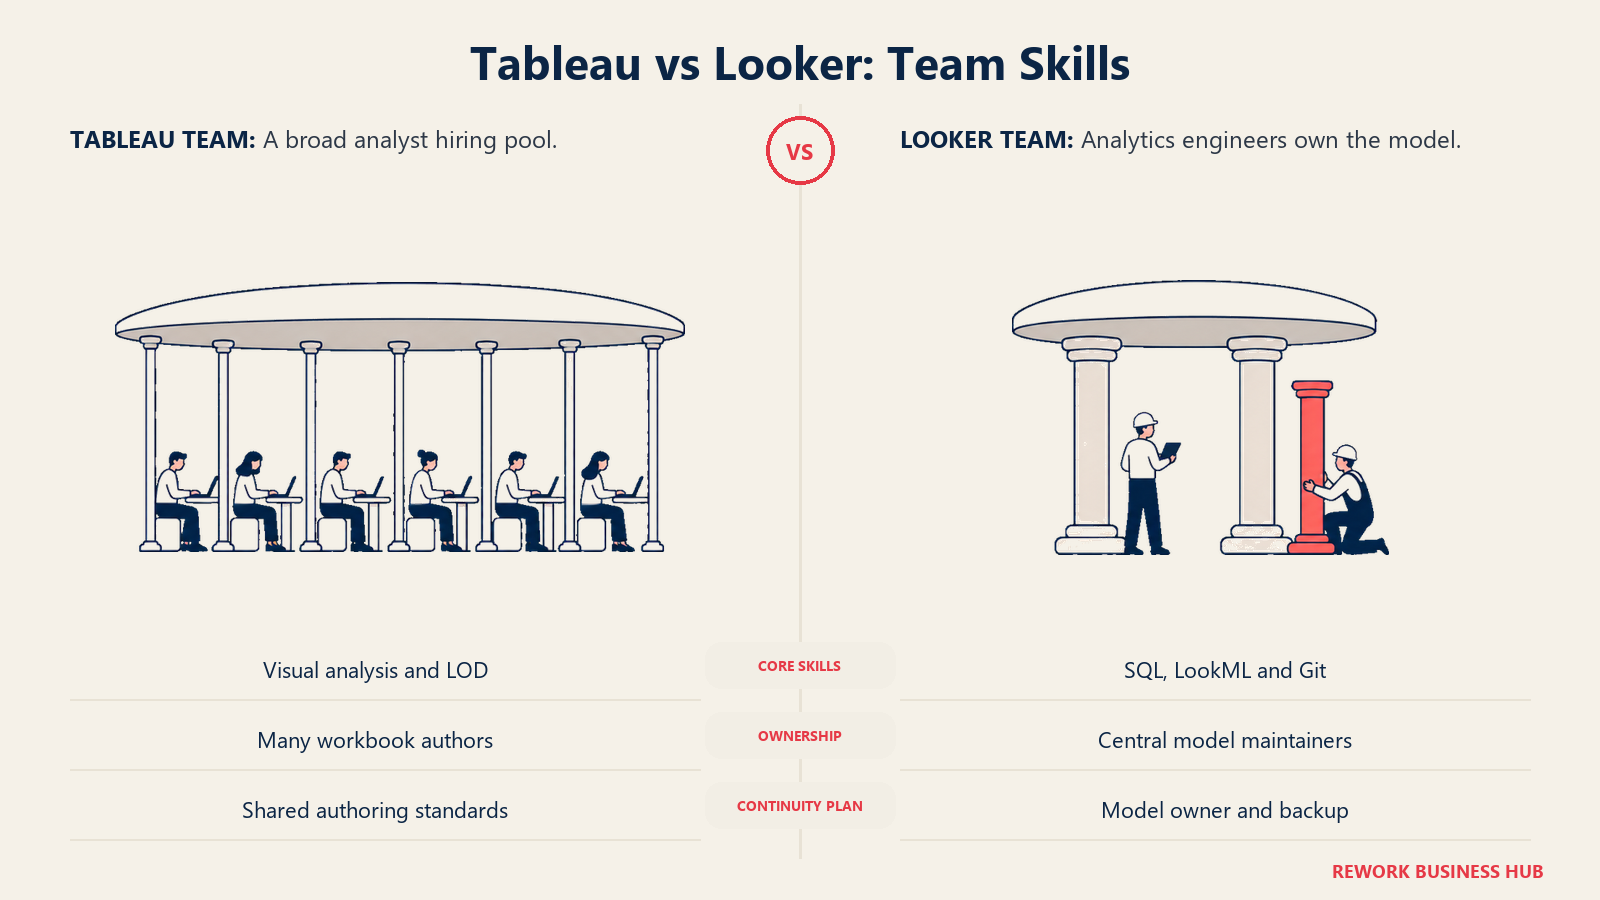
| Tableau | Looker | |
|---|---|---|
| Talent pool | Large and mature, built over more than a decade | Smaller, concentrated in analytics engineering |
| Typical hire | Business or data analyst who lists Tableau on their CV | Analytics engineer comfortable with SQL, git and dbt-style workflows |
| Training load for builders | LOD expressions are the real learning curve | LookML plus git workflow, a bigger step for a pure analyst |
| Bus-factor risk | Distributed across many workbook authors | Concentrated in whoever owns the model |
Tableau's hiring pool is the practical advantage: you can post a job and get candidates productive in week one. Looker skills overlap heavily with analytics engineering, a tighter market, and the model owner is a genuine single point of failure until you have two of them. Our data analyst tools and tech stack guide sets out what else that role needs around the BI layer.
AI in 2026: Tableau Agent and Pulse Against Conversational Analytics and Gemini
Both vendors ship generally available AI, and both attach a commercial catch, though the catches differ in kind.
Tableau's stack is Tableau Agent, for conversational analysis and AI-assisted data prep, and Tableau Pulse, which delivers personalised metrics and anomaly explanations as a newsfeed. Pulse is included across editions, but Tableau Agent sits in Cloud+ and Server+, both contact sales, and the full agentic story lands in the Tableau+ bundle pairing Cloud+ with Tableau Next (tableau.com/pricing). The AI is real, and the price of it is a phone call.
Looker's angle is grounding. Conversational Analytics queries in natural language against an Explore, or a data agent spanning up to five Explores, and because those Explores are LookML the answer inherits the governed definition rather than guessing at column names. The Looker-managed MCP server lets external AI agents connect directly, which is how Google says PayPal scaled conversational analytics past 3,000 users through Claude Desktop (Google Cloud Blog). And unusually for Looker, this piece has a published rate.
| Tableau | Looker | |
|---|---|---|
| Conversational AI | Tableau Agent, for analysis, prep and calculation building | Conversational Analytics, querying one Explore or an agent over up to five |
| Proactive metrics | Tableau Pulse, a newsfeed of metrics with anomaly explanations | Alerts and scheduled delivery, plus agent-created notification workflows |
| Grounding | Salesforce Einstein Trust Layer and Agentforce | The LookML semantic layer, so answers inherit governed definitions |
| Agent access for external tools | Salesforce ecosystem integrations | Looker-managed MCP server, no middleware required |
| What unlocks it | Tableau Agent requires Cloud+ or Server+; the full bundle is Tableau+, all contact sales | Included with the platform, subject to per-tier token quotas |
| Published AI cost | None | Overage from 1 Oct 2026: $3.00 per 1M input data tokens, $20.00 per 1M output data tokens |
| Included AI quota | Not published | Standard 60M input and 1.2M output tokens/month; Enterprise 300M and 6M; Embed 1.2B and 24M |
Read the quota row closely if AI is central to your plan, because it is the only place in this comparison where Google hands you numbers to model with. It is also the more interesting architecture: an AI answering "what was Q2 revenue" from a governed semantic layer is a different reliability proposition from one inferring intent against raw columns. Tableau's counter is that its AI sits inside the tool analysts already use, and that Pulse suits executives who never open a dashboard. For that use case, our board-ready revenue reporting guide is worth reading before assuming either AI layer covers it.
Implementation and Time to Value
| Tableau | Looker | |
|---|---|---|
| First useful dashboard | Days; an analyst can connect and build immediately | Weeks; the LookML model has to exist first |
| Prerequisite work | Clean enough data and a connection | A modelled warehouse, plus someone who can write LookML |
| Rollout to 100 users | Fast, then governance catches up with you later | Slow to start, then adding users is nearly free operationally |
| Where the cost hides | Metric reconciliation once workbooks multiply | The initial modeling project, and Developer seat scarcity |
| Typical enterprise timeline | Weeks to a governed deployment | Months to a fully modelled deployment |
| What good looks like at month 12 | Analysts producing high-quality visual answers on demand | Every team quoting the same numbers without checking with each other |
The trap is symmetrical. Tableau's fast start becomes a metric-reconciliation project in year two. Looker's slow start is that project, done up front. Budget for whichever you pick, because the work does not disappear.
When Tableau Is the Right Call
- Your bottleneck is chart production, not metric agreement. If the complaint is "we can't get dashboards built fast enough" rather than "our dashboards disagree", Tableau addresses the actual problem.
- You need a budget number without a sales cycle. Published role rates let you model 25, 50 or 100 users today and put a defensible figure in front of a finance committee.
- Design quality is a stated requirement. Freeform layout, container control and device-specific dashboards matter when the output goes to customers or a board.
- You want to hire from a deep pool. Tableau skills are common, transferable and quick to assess in an interview.
- Salesforce is your system of record. Proximity to Data Cloud and Agentforce is a real data-locality advantage, and our Power BI vs Tableau comparison covers how it stacks up against the Microsoft alternative.
When Looker Is the Right Call
- Your dashboards disagree with each other. One governed LookML definition, enforced at query time, is the only structural fix in this comparison for metric drift.
- You already run a clean warehouse. Looker's in-database architecture rewards a well-modelled BigQuery or Snowflake environment and punishes a messy one.
- You want analytics logic under version control. Pull requests, code review and CI testing on metric definitions is not something workbook-based tools replicate.
- You are embedding analytics in a product. Embed edition, with per-user row-level security defined in the same model that powers internal reporting, avoids maintaining two truths.
- AI answers have to be trustworthy, not just fluent. Conversational Analytics grounded in a semantic layer is a materially different reliability story, and Google publishes the token rates so you can model the cost.
Decision Framework
| If this is true for you | Pick |
|---|---|
| Charts take too long to build and look poor | Tableau |
| Your key dashboards disagree about the same metric | Looker |
| You need a defensible budget figure this week | Tableau |
| Metric definitions must live in git with code review | Looker |
| You have no one to own a semantic model | Tableau |
| The warehouse is clean and already the source of truth | Looker |
| Design quality is a hard requirement, not a preference | Tableau |
| You are embedding analytics in a customer-facing product | Looker |
| Warehouse compute cost is already a sore point | Tableau, whose extracts insulate you |
| AI answers must inherit governed definitions | Looker |
| You actually wanted the free Google tool | See Power BI vs Looker Studio |
What to Do Next
- Name your actual pain in one sentence before looking at another feature table. "Charts are slow to build" and "our numbers disagree" lead to different platforms, and most teams that pick badly picked before answering this.
- Model your real role mix. Count builders, self-service explorers and pure viewers separately, then run the Tableau maths above against your own numbers. That figure is also your negotiating baseline for a Looker quote.
- Start the Looker conversation early. There is no self-serve number, the term is 1 to 3 years, and procurement will need weeks you have not scheduled.
- Ask who will own the semantic model. If you cannot name that person and their backup, Looker's core advantage will not materialise. Answer this before the contract, not after.
- Model your warehouse bill under Looker, since in-database querying moves cost onto BigQuery or Snowflake. Ask your data team what 100 concurrent dashboard users would do to that line. And price the AI separately: Tableau Agent needs Cloud+ or Tableau+, both quote-only, and Looker's overage starts 1 October 2026.
- If neither is a clean fit, our best Tableau alternatives and best Looker alternatives roundups cover the field, best Power BI alternatives covers the Microsoft side, and Qlik Cloud Analytics vs ThoughtSpot vs Sisense covers the next tier. If open source is on the table, start with best Metabase alternatives.
Frequently Asked Questions about Tableau vs Looker
Is Looker the same thing as Looker Studio?
No. Looker (Google Cloud core) is the paid enterprise BI platform built on the LookML semantic layer, sold quote-only on 1 to 3 year terms. Looker Studio is the free reporting tool formerly called Google Data Studio, with no modeling language and no metric governance. They share a name and a parent company and very little else.
How much does Looker cost per user, and does it need a multi-year contract?
Google publishes no price for Looker at any tier. Standard, Enterprise and Embed editions are all "call sales" on 1, 2 or 3 year commitments, and each includes 1 production instance, 10 Standard Users and 2 Developer Users. Any per-user figure you see quoted online comes from a third party, not from Google.
How much does Tableau cost per user?
Tableau's pricing page leads with editions: Tableau Standard from $15 USD/User/Month (Billed annually) and Tableau Enterprise from $35 USD/User/Month (Billed annually). Within Standard, the role rates are Creator $75, Explorer $42 and Viewer $15 per user per month billed annually, so the "from $15" headline is the Viewer rate, not the builder rate.
Why do different articles say Tableau costs $15 and $75?
Because both are correct and describe different people. $15 is the Viewer rate and also the edition's headline "from" price; $75 is the Creator rate that anyone building workbooks needs. Any price cell that does not name the role is ambiguous by construction.
What is LookML and do I need a data engineer for it?
LookML is Looker's declarative modeling language, where you define dimensions, measures and joins once, kept in a git repository with pull requests and continuous integration testing. You need someone comfortable with SQL and git to own it, and only 2 Developer Users are included per edition, so plan for both the skill and the seat.
Which is better for embedded analytics in a product?
Looker's Embed edition is purpose-built for it, with row-level security defined in the same LookML model that powers internal reporting, and up to 500,000 query-based API calls per month. Tableau embeds through its Embedding API, licensed by consumption or agreement. Looker's structural advantage is that internal and customer-facing analytics share one definition.
Is Tableau's AI included in a standard licence?
Not fully. Tableau Pulse is included across editions, but Tableau Agent requires Cloud+ or Server+, and the full agentic bundle is Tableau+, all contact-sales. Looker is the more transparent side here: Conversational Analytics comes with the platform under per-tier token quotas, with published overage rates of $3.00 per 1M input data tokens and $20.00 per 1M output data tokens from 1 October 2026.
Will Looker increase my warehouse bill?
Probably. Looker queries in-database rather than holding extracts, so every dashboard interaction becomes a warehouse query and the cost lands on your BigQuery or Snowflake bill instead of your BI bill. Tableau's Hyper extracts insulate you from that, at the cost of managing refresh schedules.

Principal Product Marketing Strategist
On this page
- First, This Is Looker, Not Looker Studio
- TL;DR
- Key Facts
- Who Each Platform Is Really For
- Pricing Transparency Is a Decision Factor, Not a Footnote
- What Each Platform Actually Charges For
- Real Cost at 25, 50 and 100 Users
- Modeling: VizQL and LOD Expressions Against LookML and PDTs
- Data Connectivity and Where the Data Lives
- Visualization Depth and Design Control
- Governance, Permissions and Row-Level Security
- Embedding and External Sharing
- Ecosystem and Hiring Pool
- AI in 2026: Tableau Agent and Pulse Against Conversational Analytics and Gemini
- Implementation and Time to Value
- When Tableau Is the Right Call
- When Looker Is the Right Call
- Decision Framework
- What to Do Next