O Custo do Desalinhamento entre CS e Produto: O Que Ciclos de Feedback Quebrados Realmente Custam
Turn this article into takeaways for your work.
Each assistant summarizes the article only for you and suggests best practices for your work.
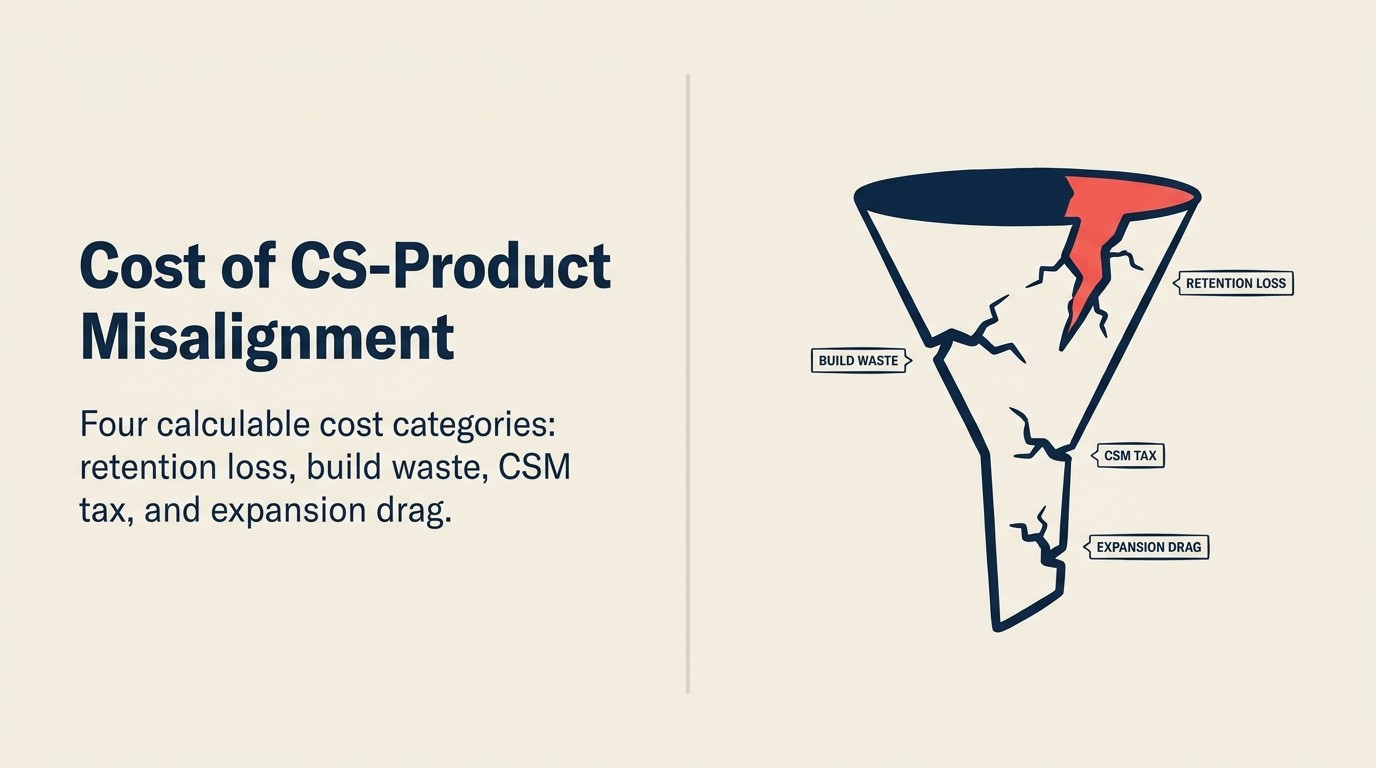
O desalinhamento entre CS e Produto tem um custo calculável: quatro categorias distintas de custo que a maioria das empresas subestima porque apenas uma delas aparece no dashboard padrão de CS. Entender todas as quatro é a diferença entre tratar ciclos de feedback quebrados como um incômodo organizacional e corrigi-los como uma prioridade de receita. Para a definição fundamental antes de fazer as contas, comece por o que é, de fato, o alinhamento entre CS e Produto.
Entre na reunião semanal do time de CS de uma empresa com 150 contas. Um CSM abre com: "A conta Maxwell está sinalizando o mesmo problema de exportação de dados de novo. Esta é a quarta QBR em que tenho que me desculpar por isso." Outro: "Não sei o que dizer para o Harrington. Faz seis meses que disse que estávamos avaliando a integração com o Salesforce. Não posso continuar dizendo 'estamos avaliando'." A líder do time concorda. Ela já enviou três chamados no Jira sobre o problema de exportação. Não tem certeza se algum PM os leu.
No fim do corredor, Produto acabou de lançar um fluxo de integração redesenhado. O PM está apresentando o projeto para a liderança: dois trimestres de iteração de design, quatro sprints de engenharia, uma reformulação completa da experiência de primeiro uso. As análises de uso mostram que a taxa de conclusão da primeira sessão subiu 8%. A rotatividade de clientes no grupo que começou neste trimestre é de 11%, ligeiramente pior que no trimestre passado. Ninguém conectou esses dois dados ainda.
Essa lacuna é como o desalinhamento se manifesta na prática: o time de CS lidando com reclamações repetidas enquanto Produto otimiza um fluxo de integração. E isso tem um preço.
O Modelo de Custo em Quatro Camadas do Desalinhamento entre CS e Produto
A maioria das conversas sobre o desalinhamento entre CS e Produto trata o problema como cultural: os times não se comunicam bem, há atrito organizacional, o canal de feedback é informal. Esse enquadramento faz a solução parecer subjetiva e o investimento parecer opcional.
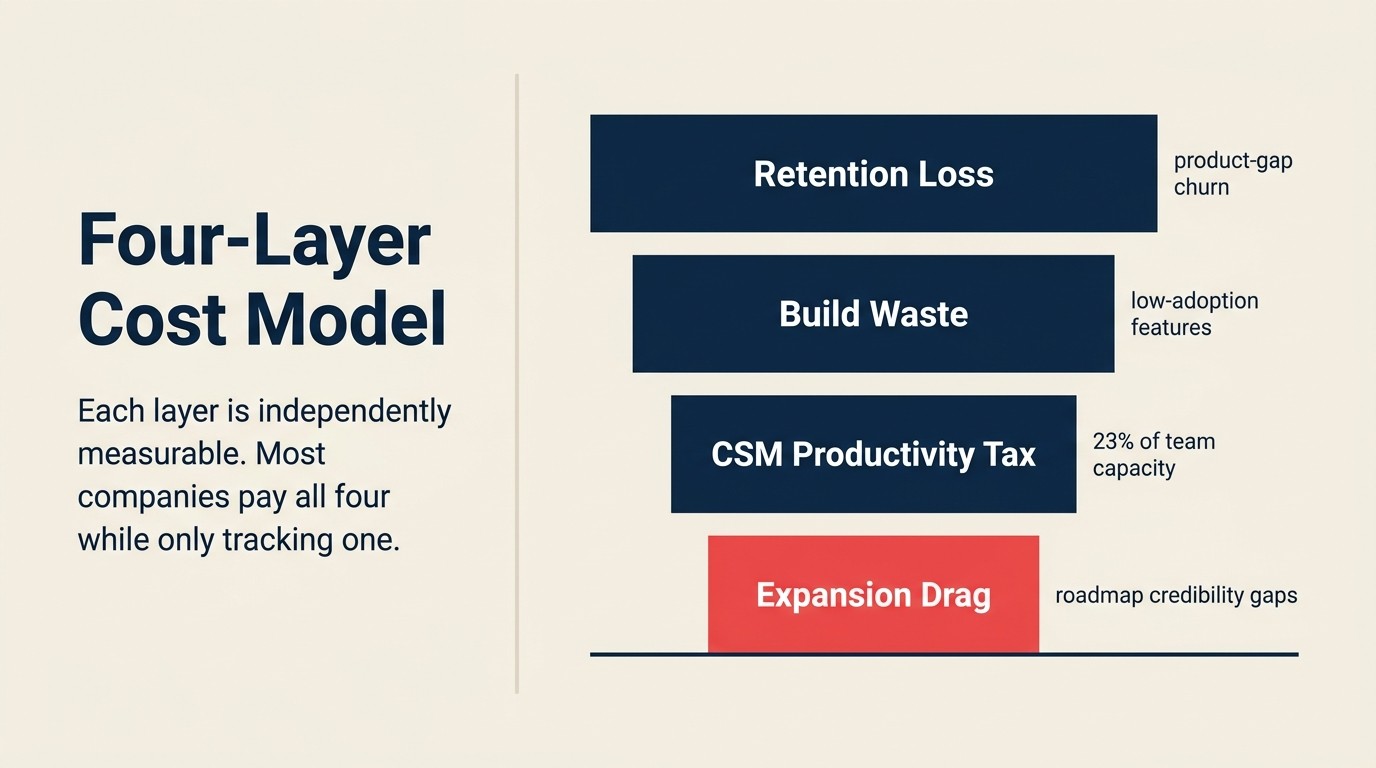
Não é um problema de cultura. É um problema de custo com quatro itens distintos e acumuláveis: o que chamamos de Modelo de Custo em Quatro Camadas. Cada camada é mensurável de forma independente, e a maioria das organizações paga todas as quatro simultaneamente enquanto monitora apenas uma.
Fatos-Chave: O Custo do Desalinhamento entre CS e Produto
- Funcionalidades construídas sem input pós-venda do CS têm taxas de adoção pós-lançamento em média 30-40% mais baixas do que funcionalidades desenvolvidas com feedback estruturado (ProductPlan).
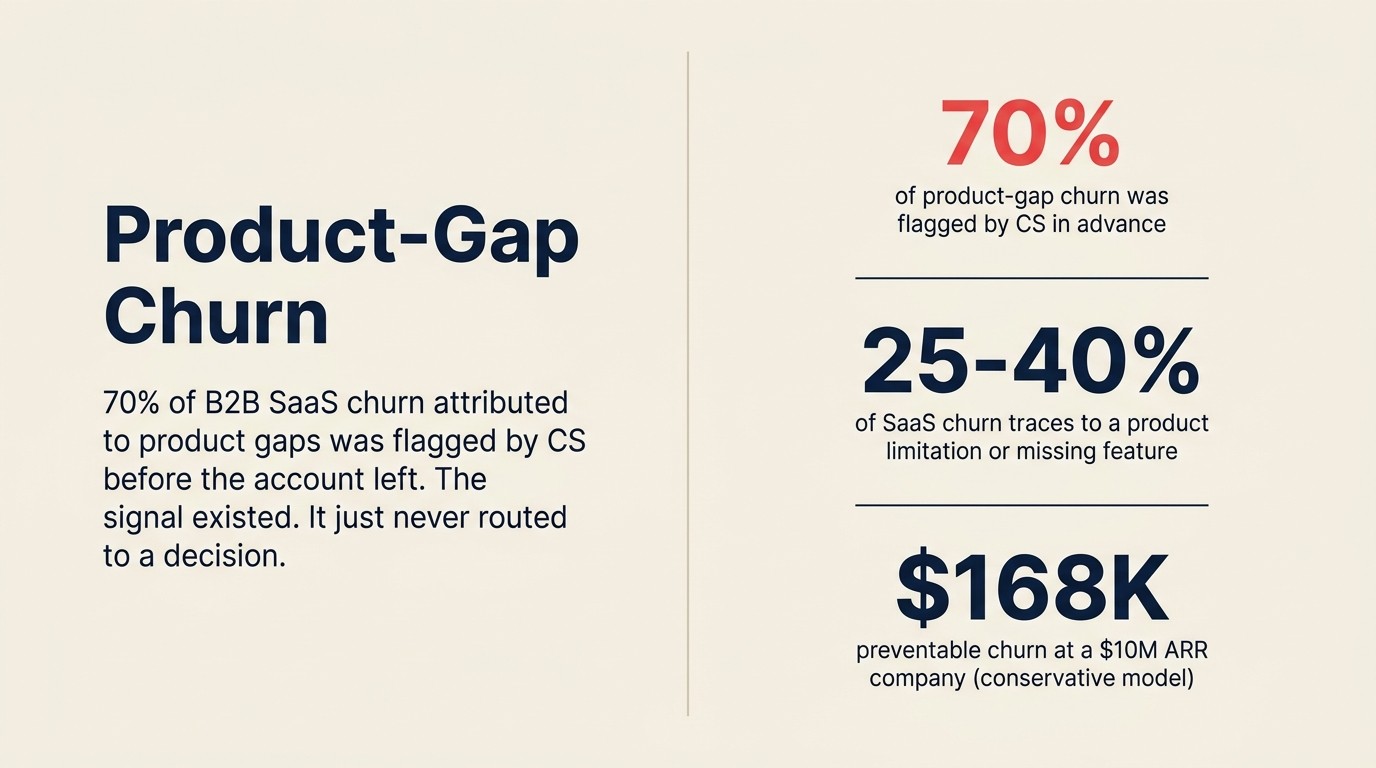
- Aproximadamente 70% da rotatividade de clientes em SaaS B2B atribuída a lacunas de produto foi sinalizada pelo time de CS antes de a conta cancelar. O sinal existia, mas não foi roteado para uma decisão que mudasse o desfecho (Gainsight).
- CSMs sem processos estruturados de feedback gastam, em média, 23% do seu tempo em tarefas de feedback de produto: cobrando PMs, reformatando solicitações, fazendo follow-up de status (TSIA).
Citável: "O desalinhamento entre CS e Produto custa dinheiro em quatro categorias distintas: perda de retenção por lacunas de produto não atendidas, desperdício de desenvolvimento por falta de sinal de CS, um imposto sobre a produtividade do CSM que consome 23% da capacidade do time, e atrito na expansão por lacunas de credibilidade no roteiro do produto. A maioria das empresas mede apenas a primeira."
Categoria de Custo 1: Perda de Retenção por Lacunas de Produto Não Atendidas
Esse é o custo mais visível, mas a maioria das empresas ainda o subestima porque conta apenas a ARR perdida, não o impacto total de receita da rotatividade causada por lacunas de produto.
A rotatividade por lacuna de produto é aquela em que o cliente saiu porque uma capacidade de que precisava não existia ou não funcionava como esperado, e essa necessidade era conhecível de antemão porque o time de CS estava ouvindo sobre ela. Nem todo evento de rotatividade é evitável. Mas a rotatividade por lacuna de produto especificamente é a categoria em que um roteamento de sinal mais cedo poderia ter mudado o desfecho. A pesquisa da Bain sobre renovações de software corporativo descobriu que as renovações podem representar até metade da receita de uma empresa de software e 80% do seu lucro. Isso torna a rotatividade evitável uma das falhas operacionais de maior custo no negócio. O monitoramento da saúde do cliente é o mecanismo que torna esses sinais visíveis antes que a conversa de renovação aconteça.
Para estimar sua exposição: puxe os últimos 12 meses de contas que cancelaram e codifique o motivo principal da rotatividade. A maioria das empresas que fez esse exercício descobre que 25-40% da rotatividade se rastreia a uma lacuna de produto (uma funcionalidade ausente, uma integração quebrada, uma limitação de fluxo de trabalho). Disso, estime que percentual dessas lacunas foi trazido à tona pelo CS antes de a conta cancelar. Os dados de benchmarking da Gainsight sugerem que a resposta gira em torno de 70%.
Então: se sua empresa perdeu US$ 800 mil de ARR no último ano e 30% se rastreia a lacunas de produto, e 70% dessas lacunas foram sinalizadas pelo CS, você tem cerca de US$ 168 mil em rotatividade que era teoricamente evitável por meio de um ciclo de feedback funcional. Nem tudo teria sido evitado. Algumas lacunas levam anos para serem construídas, e alguns clientes não podem esperar. Mas mesmo capturar 30-40% disso por meio de um roteamento de sinal mais rápido representa uma melhora significativa de NRR.
A matemática de NRR de uma melhora de 5 pontos sobre uma base de US$ 10 mi de ARR: passar de 92% para 97% de NRR significa US$ 500 mil a mais em ARR retida e expandida anualmente, com um custo de aquisição de clientes igual a zero, porque você não está substituindo clientes que cancelaram, está mantendo os que já tem. A pesquisa da McKinsey sobre a vantagem de NRR mostra que empresas de SaaS B2B com NRR acima de 120% alcançam múltiplos medianos de EV/receita de 21x contra 9x para pares abaixo desse limiar, reforçando o argumento financeiro para cada ponto de ARR retida.
Citável: "Empresas de SaaS B2B com NRR acima de 120% alcançam múltiplos medianos de EV/receita de 21x contra 9x para pares abaixo desse limiar, segundo análise da McKinsey. Cada ponto de ARR retida vale mais do que um ponto equivalente de ARR nova no nível da avaliação." (McKinsey, 2024)
Categoria de Custo 2: Desperdício de Desenvolvimento por Falta de Sinal de CS
Esse é o custo invisível do lado de Produto da equação. Quando o sinal de CS não chega às decisões de produto, os ciclos de engenharia vão para funcionalidades que resolvem hipóteses em vez de necessidades documentadas do cliente. O resultado é o cemitério de funcionalidades: construídas, lançadas, mal adotadas.
As taxas de adoção de funcionalidades aos 90 dias após o lançamento são o indicador defasado desse problema. Quando o CS não está envolvido em moldar o que é construído, ele também não está preparado para impulsionar a adoção após o lançamento. Ele descobre sobre o lançamento ao mesmo tempo que o cliente e improvisa seu suporte de adoção a partir do changelog. Um framework de adoção de produto adequado para fechar essa lacuna exige que o CS seja informado antes do lançamento, não depois.
Considere o custo de sprint de uma funcionalidade que termina no cemitério. Para uma empresa de SaaS de médio porte com um time de engenharia de 10 pessoas, um custo médio de sprint de US$ 15-20 mil por engenheiro-semana, e uma funcionalidade que levou 6-8 pontos de sprint (cerca de 3-4 engenheiro-semanas), uma funcionalidade com zero adoção representa US$ 45-80 mil em custo direto de engenharia. Se 20-25% das funcionalidades lançadas em um trimestre mostram menos de 10% de adoção aos 90 dias, um número consistente com os benchmarks da ProductPlan para times sem input estruturado de CS, o desperdício anual de desenvolvimento nesse tamanho de time é grande o suficiente para financiar toda a infraestrutura de operações de CS que o teria evitado.
E isso não tem a ver com Produto tomando más decisões. Tem a ver com Produto tomando decisões sem o sinal que o CS detém. O time de CS sabe quais clientes estão ativamente bloqueados por quê. Sabe quais soluções de contorno consomem mais tempo de gestão de contas. Esse conhecimento não chega automaticamente ao planejamento de produto. Ele precisa ser roteado até lá.
Categoria de Custo 3: O Imposto sobre a Produtividade do CSM
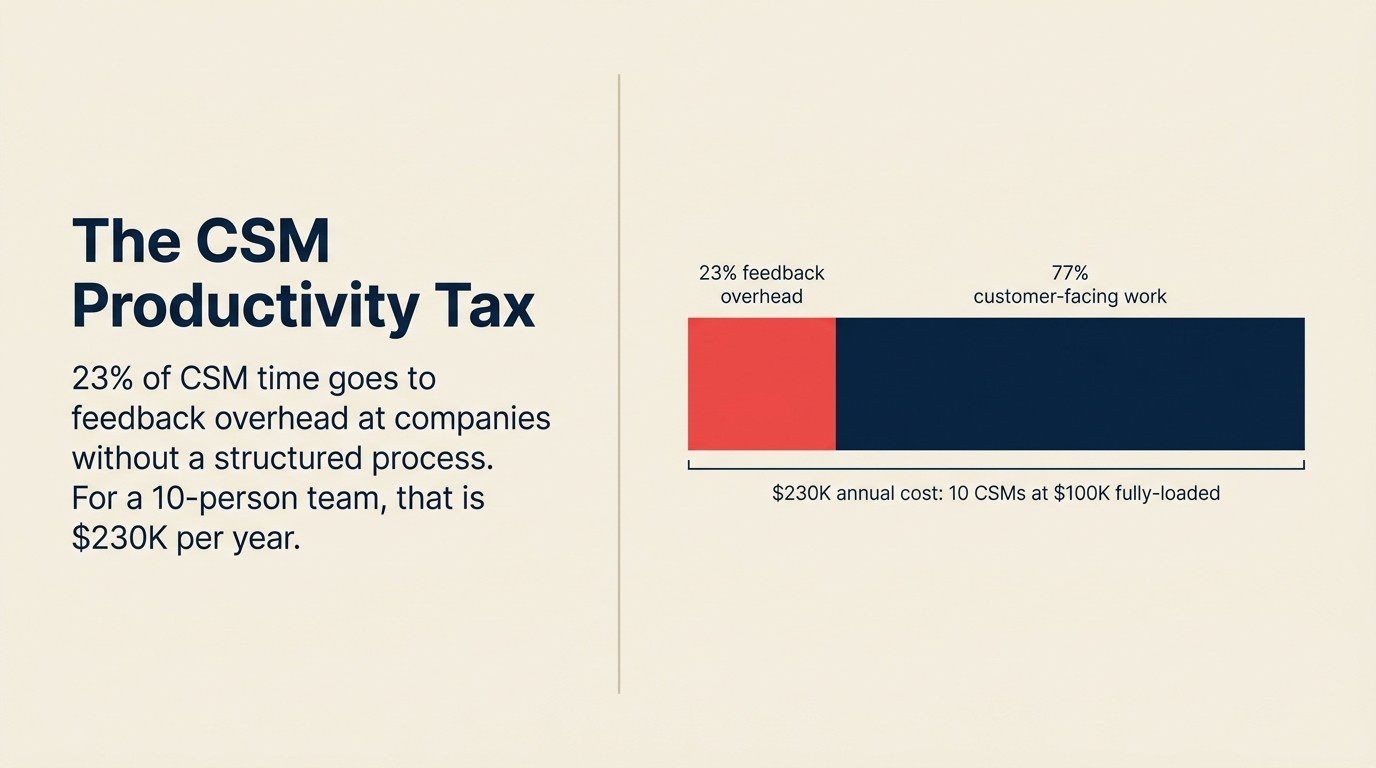
O benchmarking da TSIA descobre que CSMs em organizações sem processos estruturados de feedback gastam cerca de 23% do seu tempo em tarefas relacionadas a traduzir e cobrar feedback de clientes. Para um time de CS de 10 pessoas a um custo médio totalmente carregado de US$ 100 mil por CSM, isso representa US$ 230 mil por ano em mão de obra indo para um trabalho que um alinhamento estruturado eliminaria ou reduziria drasticamente.
Detalhe o que esses 23% realmente cobrem: redigir solicitações de funcionalidade em um formato que Produto possa usar, fazer follow-up com PMs para checar status, retraduzir reclamações de clientes depois que elas escalam, vasculhar o Slack para ver se alguém já enviou a mesma solicitação, e explicar aos clientes por que aquilo que pediram seis meses atrás ainda está "em análise".
Citável: "O benchmarking da TSIA descobriu que CSMs em organizações sem processos estruturados de feedback gastam 23% do seu tempo de trabalho em tarefas de feedback de produto: escrevendo solicitações, cobrando status, reexplicando desfechos. Para um time de CS de 10 pessoas, isso representa US$ 230 mil por ano em mão de obra indo para um trabalho que um modelo operacional estruturado eliminaria." (TSIA, 2024)
Nada desse trabalho gera valor para o cliente. É overhead gerado pela distância organizacional.
O custo de oportunidade também importa. Um CSM que gasta 23% do seu tempo em overhead de feedback é um CSM que gasta 23% menos tempo em preparação de QBR, revisão proativa de saúde, conversas de expansão e suporte de integração. Essas são as atividades que movem diretamente a retenção líquida de receita. O tempo que vai para a burocracia de feedback é tempo que não vai para o trabalho que retém e faz crescer as contas.
A correção estrutural não é pedir que os CSMs trabalhem mais. É reduzir o atrito do processo de feedback para que capturar e rotear o sinal leve minutos por semana em vez de horas: um campo etiquetado na plataforma de CS, um caminho de submissão claro, uma cadência previsível de revisão. A definição da TSIA do papel de customer success é explícita nesse ponto: CSMs são mais eficazes quando se concentram no trabalho proativo de relacionamento, não na burocracia interna de feedback.
Categoria de Custo 4: Atrito na Expansão por Lacunas no Roteiro do Produto
Esse é o custo mais subnotificado, e ele se acumula de uma forma difícil de enxergar em qualquer trimestre isolado.
CSMs que não conseguem apresentar o roteiro do produto de forma crível não conseguem usar compromissos do roteiro em conversas de expansão. E conversas de expansão em SaaS B2B muitas vezes dependem da capacidade do CSM de dizer: "Aqui está o que vem no Q3 que resolve aquilo que sua equipe sinalizou" e que essa afirmação seja específica, precisa e próxima. Os marcos de realização de valor são o lugar natural para ancorar esses compromissos. Eles dão ao cliente uma medida concreta de se o produto está entregando.
Quando o ciclo de feedback entre CS e Produto está quebrado, essa credibilidade se erode em uma direção específica: os CSMs param de citar o roteiro do produto em conversas com clientes porque aprenderam que citá-lo leva a perguntas que não conseguem responder e a compromissos que não conseguem cumprir. As conversas de expansão ficam mais estreitas, focadas no que existe hoje em vez do que está por vir, e as taxas de expansão sofrem na mesma medida.
Quantifique assim: se sua taxa média de expansão para contas que tiveram conversas sobre o roteiro (em que o CSM conectou explicitamente funcionalidades futuras a necessidades do cliente) é 15% maior do que para contas que não tiveram, e essa diferença representa 40 contas por ano, o atrito na expansão por má comunicação do roteiro é mensurável. Não é uma abstração. É um número específico que você pode calcular a partir dos próprios dados do seu CRM.
O Custo Oculto: Erosão da Credibilidade do CSM
Há um quinto custo que não se encaixa perfeitamente em nenhuma das quatro categorias acima, mas que permeia todas elas.
Quando os CSMs respondem a perguntas de produto que não conseguem responder, quando enviam feedback que nunca veem respondido, quando prometem "estamos avaliando" pela terceira QBR consecutiva, eles param de acreditar que o sistema funciona. E essa erosão tem dois efeitos posteriores.
Primeiro, CSMs que não acreditam que seu feedback será usado param de enviá-lo de forma consistente. Eles se tornam seletivos, escalando apenas os problemas mais urgentes e deixando o restante se acumular em suas anotações sem rotear para lugar nenhum. O conjunto de sinais de que Produto precisa para tomar boas decisões fica menor e mais enviesado em direção a emergências. Esse é um dos 8 sinais de alerta do desalinhamento entre CS e Produto mais difíceis de reverter depois que se instala.
Segundo, a confiança do cliente no relacionamento com o CSM se erode. O valor do CSM para o cliente é, em parte, informacional: ele é a pessoa que sabe o que o produto está fazendo e para onde está indo. Quando esse valor informacional desaparece, o relacionamento se torna puramente reativo (gerenciar problemas, processar renovações), e a oportunidade de expansão que exige um conselheiro proativo e de confiança desaparece junto.
Como Fazer uma Auditoria Aproximada de Desalinhamento na Sua Empresa
Você não precisa de um estudo formal para ter um retrato utilizável do seu custo de desalinhamento. Três extrações de dados vão lhe dizer a maior parte do que você precisa saber.
Extração 1: Motivos de rotatividade dos últimos 6-12 meses. Filtre para rotatividade por lacuna de produto: qualquer conta em que o motivo principal ou secundário tenha sido uma limitação de produto, funcionalidade ausente ou lacuna de integração. Calcule o total de ARR. Essa é sua exposição de custo de retenção pela rotatividade por lacuna de produto. Compare isso com o que o custo de uma transferência quebrada entre Vendas e CS contribuiu, porque muitas empresas descobrem que os dois centros de custo se acumulam juntos.
Extração 2: Dados de adoção de funcionalidades dos últimos 3 grandes lançamentos. Para cada lançamento, puxe a taxa de adoção em 90 dias entre as contas que eram elegíveis para usar a funcionalidade. Se a adoção em 90 dias estiver consistentemente abaixo de 20-30%, o CS ou não foi envolvido em moldar a construção ou não estava preparado para o suporte de adoção no lançamento. Calcule o custo de engenharia das funcionalidades de baixa adoção como uma estimativa aproximada de desperdício de desenvolvimento.
Extração 3: Pergunte diretamente aos CSMs. Três perguntas, respondidas com honestidade em uma discussão de equipe de 30 minutos:
- Quantas horas você gastou na semana passada em tarefas de feedback de produto: escrevendo solicitações, fazendo follow-up de status, explicando aos clientes o que aconteceu com o input deles?
- Com que frequência você cita compromissos do roteiro em conversas com clientes, e quão confiante você está de que esses compromissos são precisos?
- Nos últimos seis meses, você consegue nomear um feedback que enviou e que sabe ter influenciado uma decisão de produto?
As respostas a essas três perguntas vão trazer à tona a categoria de custo específica em que seu desalinhamento é mais caro. Use isso para priorizar onde o trabalho de modelo operacional começa.
O ROI de Acertar Isso
O argumento a favor do alinhamento entre CS e Produto não é um discurso por uma melhora cultural. É uma afirmação sobre ROI operacional.
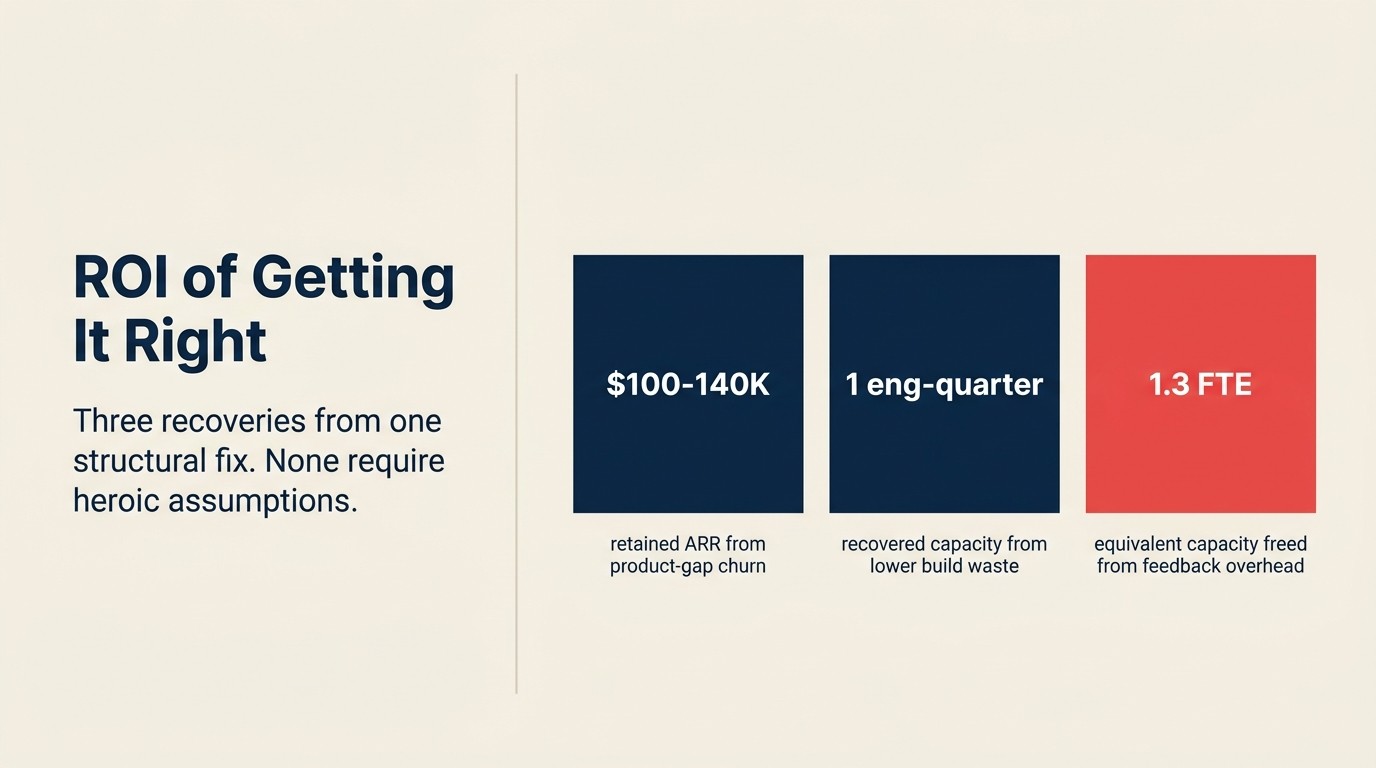
Veja o que o alinhamento sistemático recupera, modelado de forma conservadora:
Se a rotatividade por lacuna de produto em uma empresa de US$ 10 mi de ARR está em US$ 400 mil por ano, e um pipeline estruturado de VoC recupera 25-35% disso por meio de um roteamento de sinal mais rápido, o valor anual de ARR retida é de US$ 100-140 mil, antes de considerar a ARR de expansão que essas contas teriam gerado se tivessem ficado.
Se o desperdício de desenvolvimento com funcionalidades de adoção abaixo de 20% representa 20% do investimento anual de engenharia em um time de 20 pessoas, reduzir isso pela metade por meio do input de CS no planejamento de produto recupera cerca de um engenheiro-trimestre de capacidade produtiva por ano.
Se 23% do tempo do CSM indo para overhead de feedback cai para 10% por meio de um processo de submissão estruturado, a capacidade recuperada em um time de 10 pessoas equivale a 1,3 FTE, disponível para trabalho de expansão, gestão proativa de saúde e preparação estratégica de QBR.
Nenhum desses números exige suposições heroicas. Eles se baseiam em benchmarks do setor aplicados a uma escala de médio porte. O investimento para gerar essas recuperações (um processo de etiquetagem de feedback, uma cadência entre PM e CSM, um protocolo de comunicação do roteiro) custa uma fração do que a melhora retorna.
Análise Rework: Aplicar o Modelo de Custo em Quatro Camadas a uma empresa representativa de SaaS de médio porte (US$ 10 mi de ARR, 10 CSMs, 20 engenheiros) traz à tona, de forma conservadora, US$ 400 mil a US$ 700 mil em custos anuais de desalinhamento: US$ 168 mil em rotatividade evitável por lacuna de produto (30% de US$ 800 mil de ARR perdida × taxa de 70% sinalizada pelo CS × 30% de recuperação), US$ 90-180 mil em desperdício de desenvolvimento (20% do tempo de um time de engenharia de 20 pessoas em funcionalidades de baixa adoção), US$ 230 mil em imposto sobre a produtividade do CSM (23% de US$ 100 mil × 10 CSMs), e um atrito significativo na expansão por lacunas de credibilidade no roteiro. A correção estrutural: um pipeline de feedback etiquetado, cadências entre PM e CSM e um compromisso de ciclo fechado exige semanas para ser implementado e frações desse custo para operar anualmente. O módulo de alinhamento entre CS e Produto da Rework foi projetado para automatizar as etapas de captura de feedback, ponderação por ARR e fechamento do ciclo de feedback, de modo que o modelo operacional rode com baixo overhead em vez de exigir uma função de operações dedicada.
As empresas que tratam isso como uma iniciativa cultural passam dois anos em workshops de comunicação. As empresas que tratam isso como modelo operacional corrigem uma lacuna específica de roteamento de feedback e veem a linha de NRR se mover. O artigo o que é o alinhamento entre CS e Produto cobre o modelo operacional na íntegra. O modelo de maturidade ajuda você a localizar onde está e o que muda em seguida.
Perguntas Frequentes
Como se calcula o custo do desalinhamento entre CS e Produto?
Comece com três extrações de dados: motivos de rotatividade codificados por tipo (para isolar a rotatividade por lacuna de produto), taxas de adoção de funcionalidades em 90 dias nos lançamentos recentes (para estimar o desperdício de desenvolvimento) e uma pesquisa direta com os CSMs sobre o tempo gasto em tarefas relacionadas a feedback (para quantificar o imposto sobre a produtividade). Some essas três cifras e você terá um modelo aproximado de custo de desalinhamento baseado nos seus próprios dados, em vez de estimativas do setor.
Que percentual da rotatividade em SaaS é atribuível a lacunas de produto?
Os benchmarks do setor variam por segmento e maturidade, mas a maioria das organizações de CS que codificaram sistematicamente seus motivos de rotatividade descobre que 25-40% se rastreia a uma limitação de produto, funcionalidade ausente ou lacuna de integração. Disso, aproximadamente 70% foi sinalizado pelo time de CS antes de a conta cancelar, o que significa que o sinal existia, mas não influenciou uma decisão de produto a tempo.
O que é desperdício de desenvolvimento na gestão de produto?
Desperdício de desenvolvimento é o investimento de engenharia em funcionalidades que alcançam baixa adoção pós-lançamento, tipicamente medida aos 90 dias após o lançamento. Quando o CS não está envolvido em moldar o que é construído ou em preparar a adoção após o lançamento, as funcionalidades são construídas para hipóteses em vez de necessidades documentadas do cliente, e a adoção sofre porque o time mais próximo do cliente não estava preparado para impulsioná-la.
Como o desalinhamento entre CS e Produto afeta o NRR?
O desalinhamento afeta os três componentes do NRR. A retenção bruta sofre quando lacunas de produto que o CS sinalizou ficam sem resolução por tempo suficiente para causar rotatividade. A expansão sofre quando os CSMs não conseguem apresentar um roteiro de produto de forma crível porque suas referências anteriores ao roteiro não foram precisas. A contração (downgrades) muitas vezes se rastreia a uma insatisfação que uma resposta de produto mais rápida teria endereçado. Um ciclo de feedback funcional entre CS e Produto melhora diretamente os três.
Vale a pena quantificar o imposto sobre a produtividade do CSM?
Sim, e muitas vezes é o número mais fácil de trazer à tona porque vem de um autorrelato direto. Os CSMs sabem aproximadamente quanto tempo gastam cobrando feedback de produto, e esse tempo tem um custo calculável (horas de trabalho à taxa totalmente carregada) e um custo de oportunidade calculável (o trabalho de expansão e retenção para o qual esse tempo poderia ter ido). A maioria dos times descobre que o número é maior do que o esperado, o que o torna um ponto de partida útil para a conversa sobre o caso de negócio.
Saiba Mais
- O Que É o Alinhamento entre CS e Produto
- 8 Sinais de Alerta do Desalinhamento entre CS e Produto
- O Problema do "Construímos, Ninguém Usa"
- O Problema do Cemitério de Solicitações de Funcionalidade
- Modelo de Maturidade do Alinhamento entre CS e Produto
- Capturando Feedback de Forma Sistemática
- Glossário de Alinhamento entre CS e Produto
- O Custo de uma Transferência Quebrada entre Vendas e CS

Senior Operations & Growth Strategist
On this page
- O Modelo de Custo em Quatro Camadas do Desalinhamento entre CS e Produto
- Categoria de Custo 1: Perda de Retenção por Lacunas de Produto Não Atendidas
- Categoria de Custo 2: Desperdício de Desenvolvimento por Falta de Sinal de CS
- Categoria de Custo 3: O Imposto sobre a Produtividade do CSM
- Categoria de Custo 4: Atrito na Expansão por Lacunas no Roteiro do Produto
- O Custo Oculto: Erosão da Credibilidade do CSM
- Como Fazer uma Auditoria Aproximada de Desalinhamento na Sua Empresa
- O ROI de Acertar Isso
- Perguntas Frequentes
- Como se calcula o custo do desalinhamento entre CS e Produto?
- Que percentual da rotatividade em SaaS é atribuível a lacunas de produto?
- O que é desperdício de desenvolvimento na gestão de produto?
- Como o desalinhamento entre CS e Produto afeta o NRR?
- Vale a pena quantificar o imposto sobre a produtividade do CSM?
- Saiba Mais