Verkaufszyklus-Länge: Messen und verkürzen
Turn this article into takeaways for your work.
Each assistant summarizes the article only for you and suggests best practices for your work.
Die Verkaufszyklus-Länge ist die eine Kennzahl, die Pipeline-Gesundheit, Umsatzplanbarkeit und quota-Mathematik miteinander verbindet. Verkürzen Sie sie um 20 %, und Sie schließen nicht nur Deals schneller -- Sie schließen mit derselben Mitarbeiterzahl 25 % mehr Deals pro Quartal, und Ihre Pipeline-Geschwindigkeit potenziert sich in einer Weise, die auf der Board-Folie sichtbar wird.
Aber die meisten Revenue-Teams messen sie inkonsistent, vergleichen sie mit der falschen Vergleichsgruppe und versuchen, sie mit Taktiken zu verkürzen, die Käufer nur unter Druck setzen. Dieser Leitfaden behandelt, was die Kennzahl tatsächlich bedeutet, wie man sie korrekt berechnet und wie man sie verkürzt, ohne die win rate zu opfern.
Was ist die Verkaufszyklus-Länge?
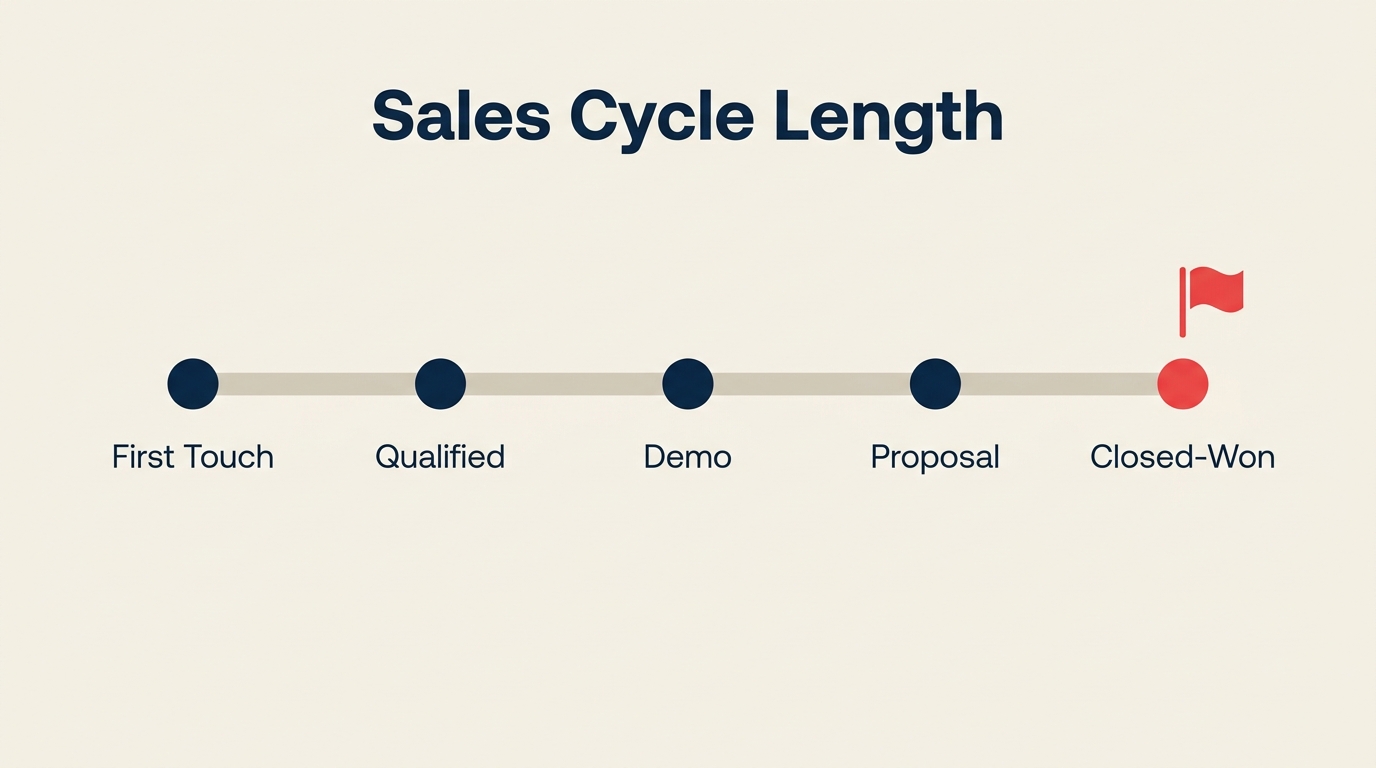
Die Verkaufszyklus-Länge ist die verstrichene Zeit, gemessen in Kalendertagen, zwischen dem Moment, in dem ein Interessent erstmals mit Ihrem Vertriebsteam in Kontakt tritt, und dem Moment, in dem diese Opportunity ein finales Ergebnis erreicht -- erfolgreich abgeschlossen oder verloren. Sie ist eine Pipeline-Geschwindigkeitskennzahl: Je kürzer sie im Verhältnis zu Ihrem durchschnittlichen Vertragswert ist, desto schneller wandelt sich Umsatz von der Pipeline in Buchungen um.
Die Definition klingt einfach. In der Praxis können zwei Teams in identischen Unternehmen sehr unterschiedliche Durchschnittswerte melden, weil sie "ersten Kontakt" unterschiedlich definieren. Ein Team startet die Uhr beim MQL-Übergabe. Ein anderes beim Eintritt in Phase 1. Ein drittes beim Datum der Demo-Buchung. Wenn Ihre Messung inkonsistent ist, ist Ihr Benchmark Rauschen.
Die nützlichste Definition für B2B-Vertriebsoperationen: Starten Sie die Uhr bei der ersten vertriebsqualifizierten Interaktion (in der Regel der Discovery-Call oder das erste Meeting, das gegen eine Opportunity in Ihrem CRM protokolliert wurde), und stoppen Sie sie beim erfolgreich abgeschlossenen Deal. Dadurch wird die Marketing-Lead-Zeit herausgefiltert, die für die MQL vs. SQL-Analyse relevanter ist als für Pipeline-Metriken.
Key Facts
- Die mediane B2B-Verkaufszyklus-Länge wuchs von 2020 bis 2024 um 24 %, angetrieben durch mehr Genehmiger auf Käuferseite pro Deal (Gong Labs Sales Benchmarks, 2024).
- Der durchschnittliche Enterprise-B2B-Deal umfasst 10 bis 11 Stakeholder, gegenüber 6,8 im Jahr 2017; jeder zusätzliche Stakeholder verlängert den Zyklus um geschätzte 6 bis 9 Tage (Gartner B2B Buying, 2024).
- Unternehmen mit dokumentierten gegenseitigen Abschlussplänen berichten von 27 % kürzeren Verkaufszyklen als Unternehmen ohne (LinkedIn State of Sales, 2024).
Wie man die Verkaufszyklus-Länge berechnet
Die Kernformel ist unkompliziert:
Durchschnittliche Verkaufszyklus-Länge = Summe der einzelnen Zyklusdauer in Tagen / Anzahl der erfolgreich abgeschlossenen Deals
Ein Rechenbeispiel: Sie schließen 8 Deals in einem Quartal mit individuellen Zykluslängen von 22, 35, 40, 28, 55, 31, 44 und 29 Tagen. Die Summe ist 284. Dividiert durch 8 ergibt sich Ihr Durchschnitt von 35,5 Tagen.
Arithmetisches Mittel vs. Median: Welchen Wert verwenden?
Verwenden Sie den Median als Ihre primäre Kennzahl. Das arithmetische Mittel ist anfällig für Ausreißer -- ein einziger 9-monatiger Enterprise-Deal kann Ihren SMB-Durchschnitt um Wochen aufblähen und Ihre Pipeline langsamer erscheinen lassen, als sie ist.
Der Median sagt Ihnen: "Wie sieht ein typischer Deal aus?" Das arithmetische Mittel sagt Ihnen: "Was passiert mathematisch, wenn ein strategischer Deal dreimal länger dauert?" Verfolgen Sie beides, aber steuern Sie nach dem Median.
Wo das arithmetische Mittel nützlich ist: bei der Berechnung, wie viel Pipeline Sie benötigen, um ein quota-Ziel zu decken. Diese Berechnung erfordert das arithmetische Mittel, weil Sie das Gesamtdealvolumen prognostizieren, nicht das typische Deal-Verhalten.
Was man ausschließen sollte
- Verlorene Deals mit einer Zykluszeit über dem 95. Perzentil (zeigen typischerweise stagnierende und dann aufgegebene Opportunities an, keine echten Verkaufszyklen).
- Opportunities, die nie ordnungsgemäß qualifiziert wurden (wurden eingebracht, um die Pipeline-Abdeckung aufzupolstern).
- Deals, die nach einem ersten Abschluss wieder geöffnet wurden -- diese verfälschen den "Neugeschäft"-Benchmark.
Verfolgen Sie diese separat in einer Ansicht "Zykluszeit-Anomalien". Sie sind wertvoll für die Verlustanalyse, verfälschen aber Ihre Baseline.
Verkaufszyklus-Benchmarks nach Segment
Diese Benchmarks repräsentieren typische Bereiche in B2B-Software und -Dienstleistungen. Ihr tatsächlicher Zyklus variiert je nach Branche, Produktkomplexität und Vertrautheit des Käufers mit der Kategorie.
| Segment | ACV | Typische Zykluslänge |
|---|---|---|
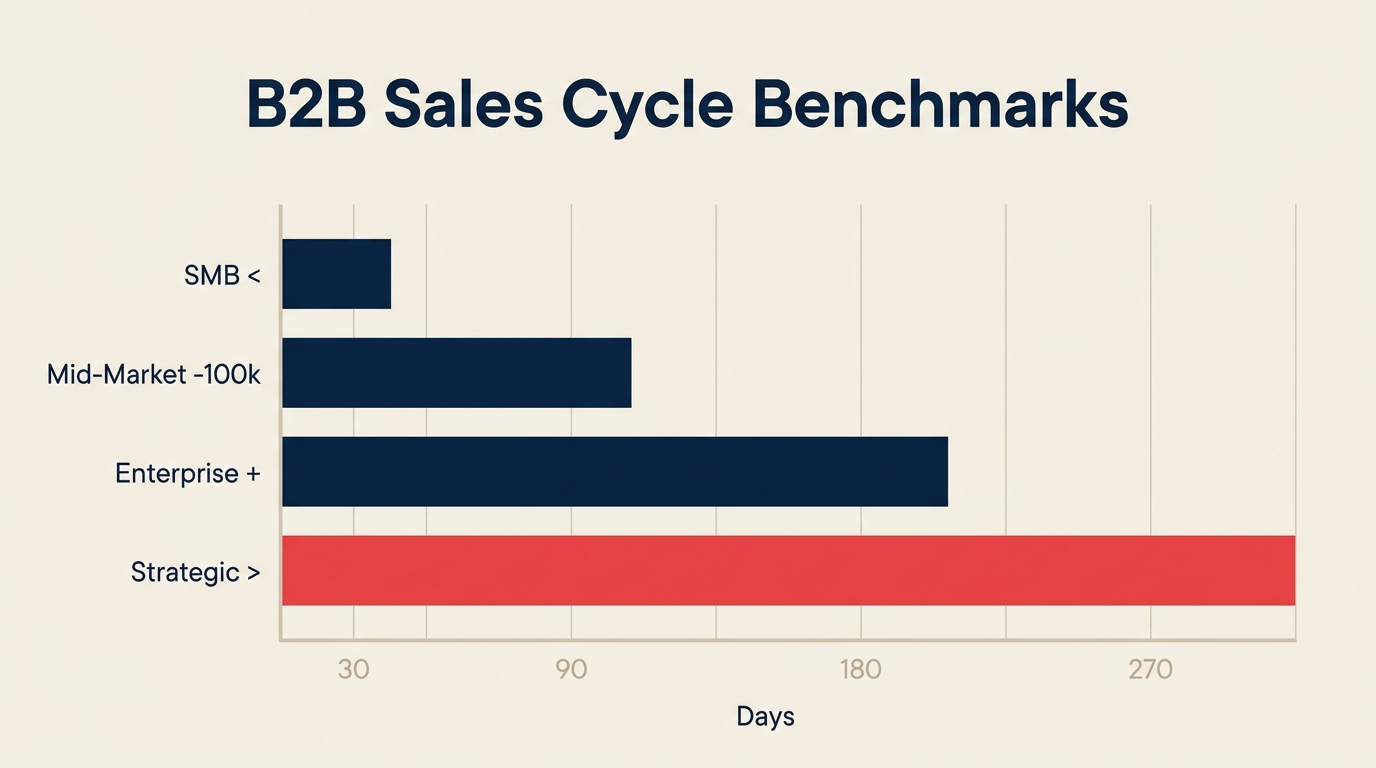
| SMB | Unter 10.000 $ | 14 bis 30 Tage |
| Mid-Market | 10.000 \(bis 100.000\) | 30 bis 90 Tage |
| Enterprise | Über 100.000 $ | 90 bis 270 Tage |
| Strategische / Named Accounts | Über 1 Million $ | 9 bis 18 Monate |
Ein paar Dinge aus dieser Tabelle sind erwähnenswert. Erstens ist die SMB-Spanne breiter, als die meisten erwarten -- ein 14-Tage-SMB-Zyklus und ein 30-Tage-SMB-Zyklus stehen für sehr unterschiedliche Vertriebsbewegungsmodelle (produktgeführt vs. vertriebsgeführt). Zweitens leistet "Enterprise" als Kategorie viel: Ein 150.000-\(-Deal bei einem 100-Personen-SaaS-Unternehmen schließt anders als ein 150.000-\)-Deal bei einem Fortune-500-Unternehmen. Nutzen Sie Ihre eigenen CRM-Daten, um segmentspezifische Benchmarks zu erstellen, anstatt die obige Tabelle als gegeben hinzunehmen.
Für Arbeit mit Verkaufsprognosemethoden und Prognosegenauigkeit benötigen Sie auch nach Phase aufgegliederte Benchmarks, nicht nur End-to-End-Werte.
Warum Verkaufszyklen lang werden
Es lohnt sich, die Grundursachen zu verstehen, bevor man nach einer Lösung greift. Die meisten verlängerten Zyklen sind auf eine oder mehrere dieser Ursachen zurückzuführen:
- Kein interner Fürsprecher. Der Käufer zeigt Interesse, aber niemand innerhalb des Accounts vermarktet Ihre Lösung aktiv bei der Genehmigungsgruppe. Deals ohne Fürsprecher verharren monatelang in der "Evaluierung".
- Einfädige Einbindung. Ihr Mitarbeiter spricht mit einer Person. Diese Person trifft auf interne Hürden und hat keinen Anreiz, sie zu überwinden. Multi-Threading -- Beziehungen zu 3 bis 5 Stakeholdern aufbauen -- ist die strukturell wirkungsvollste Einzelmaßnahme.
- Späte Entdeckung von Sicherheits- und rechtlichen Anforderungen. Sicherheitsüberprüfungen, Datenverarbeitungsvereinbarungen und Beschaffungsabläufe tauchen am Ende von Deals auf, weil am Anfang niemand danach gefragt hat. Jede Überprüfung fügt 2 bis 6 Wochen hinzu.
- Fehlausrichtung auf den Budgetzyklus. Ein Deal, der im November bei einem Unternehmen mit Geschäftsjahresende am 31. Dezember landet, ist ein anderer Deal als dieselbe Opportunity im zweiten Quartal. Budgetverfügbarkeit geht nicht nur darum, ob das Geld vorhanden ist -- es geht darum, ob der Genehmigungsprozess rechtzeitig abgeschlossen werden kann.
- Schwache ICP-Qualifizierung. Deals, die schon in Phase 1 hätten disqualifiziert werden sollen, treiben durch die Pipeline und beanspruchen Mitarbeiterzeit, was Ihre durchschnittliche Zykluslänge länger erscheinen lässt als Ihre echten Opportunities tatsächlich sind. Gute Opportunity-Qualifizierungs-Kriterien schneiden das sauber ab.
- Verzögerung zwischen Angebot und Abschluss. Angebote werden verschickt, und dann warten Mitarbeiter. Ohne einen strukturierten gegenseitigen Abschlussplan verlieren Angebote ihre Dringlichkeit. Die Aufmerksamkeit des Interessenten verlagert sich auf andere Prioritäten, und Ihr Deal verzögert sich.
Wie man den Verkaufszyklus verkürzt
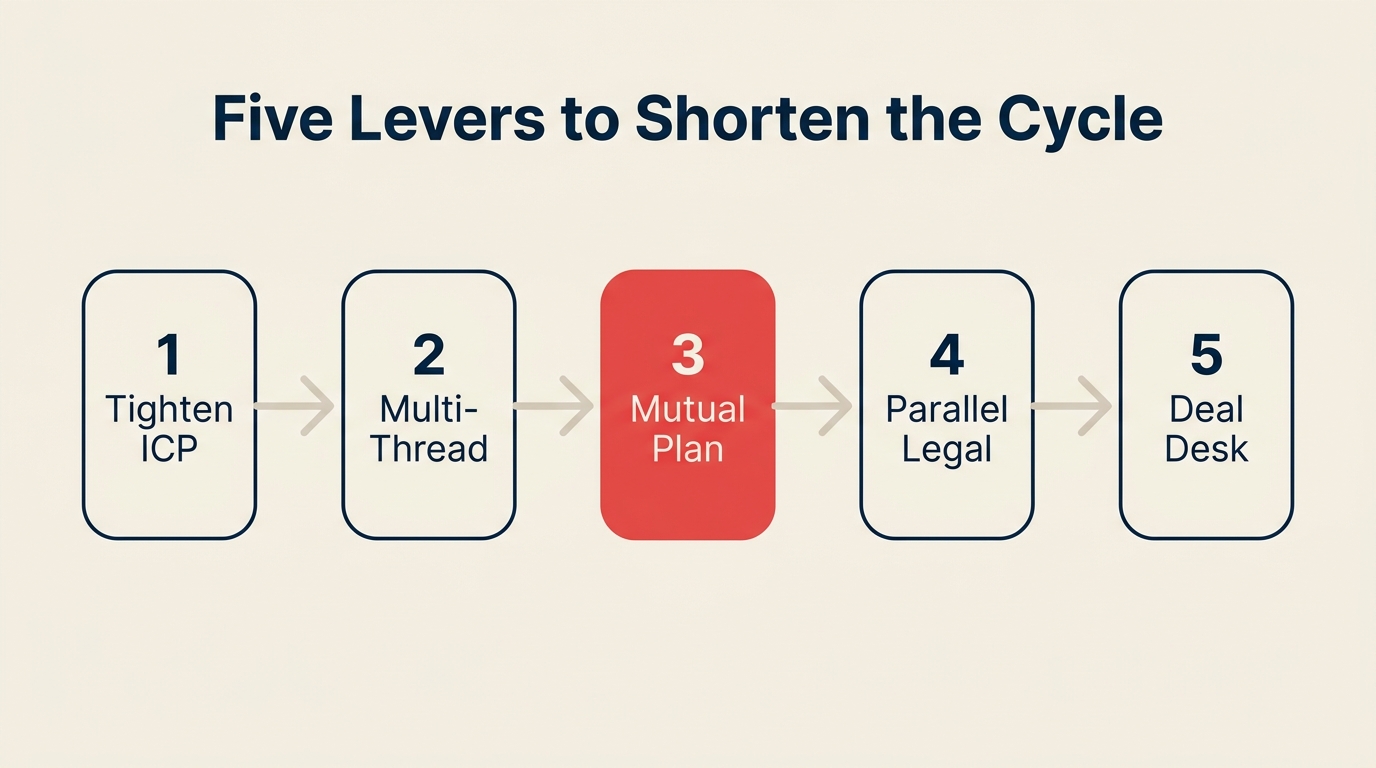
Diese fünf Schritte sind nach ihrer Wirkungskraft geordnet. Beginnen Sie mit Schritt 1 -- nicht zum ICP passende Pipeline ist die teuerste Grundursache und diejenige, die die meisten Organisationen ignorieren.
Schritt 1: Ihren ICP schärfen
Überprüfen Sie Ihre letzten 50 erfolgreich abgeschlossenen Deals und Ihre letzten 50 verlorenen Deals. Wie ist die mediane Zykluslänge für jedes Segment in diesen Gruppen? Wenn Ihre ICP-konformen Gewinne in 45 Tagen abschließen und Ihre Nicht-ICP-Gewinne in 90 Tagen, haben Sie Ihre Antwort bereits. Schneller zu disqualifizieren schadet Ihrer Zahl nicht -- es verbessert sie, weil Ihre Mitarbeiter Zeit auf Deals konzentrieren, die abschließen.
Aktualisieren Sie Ihre Pipeline-Eintrittskreterien entsprechend. Ein Deal, der das ICP nicht erfüllt, sollte entweder disqualifiziert oder in einer Pflegesequenz geparkt werden, nicht in der aktiven Pipeline geführt werden.
Schritt 2: Multi-Threading vom ersten Meeting an
Erfassen Sie beim ersten Discovery-Call das Einkaufsgremium. Wer genehmigt? Wer implementiert? Wer hat den Budgetcode? Wer wird blockieren? Bauen Sie Beziehungen zu mindestens drei Stakeholdern auf, bevor Sie die Angebotsphase erreichen. Wenn Ihr primärer Kontakt verstummt, haben Sie andere Wege. Wenn interne Politik den Deal verlangsamt, hat Ihr Fürsprecher Verbündete.
Dieser eine Schritt, konsequent im Team durchgeführt, verkürzt die durchschnittliche Zykluslänge typischerweise um 10 bis 20 %. Er verbessert auch die win rate, weshalb win-rate-Verbesserung und Zyklus-Verkürzung oft gemeinsam angegangen werden.
Schritt 3: Am Ende von Phase 2 einen gegenseitigen Abschlussplan erstellen
Ein gegenseitiger Abschlussplan ist ein gemeinsames Dokument -- typischerweise eine Seite -- auf das sich sowohl Ihr Mitarbeiter als auch der Projektverantwortliche des Käufers am Ende der Discovery- oder Demo-Phase einigen. Er enthält: wichtige Meilensteine, wer jeweils verantwortlich ist, Fristen und ein Zielabschlussdatum, auf das sich der Käufer mündlich verpflichtet hat.
Unternehmen mit dokumentierten gegenseitigen Abschlussplänen berichten von 27 % kürzeren Verkaufszyklen (LinkedIn State of Sales, 2024). Der Mechanismus ist einfach: Es wandelt ein vages "Wir evaluieren Optionen" in ein konkretes Projekt mit benannten Verantwortlichen und Terminen um. Käufer, die sich nicht auf einen gegenseitigen Abschlussplan einlassen, sind oft keine echten Käufer.
Schritt 4: Rechtliche und Sicherheitsprozesse parallel führen
Starten Sie den Sicherheitsüberprüfungs-Fragebogen und den rechtlichen Überarbeitungsprozess so früh wie in Phase 2. Warten Sie nicht auf eine mündliche Einigung -- zu diesem Zeitpunkt haben Sie bereits 3 bis 6 Wochen verloren. Kennzeichnen Sie Accounts, bei denen diese Überprüfungen wahrscheinlich sind (regulierte Branchen, große Unternehmen, alle Deals über 50.000 $), und senden Sie die Unterlagen frühzeitig. Ihr Rechtsteam wird besser ausgelastet, und Deals stagnieren nicht in der Schlussphase.
Das ist besonders wichtig für die Muster, die im Deal-Aging-Management verfolgt werden, wo Verzögerungen in der Spätphase die teuerste Form von Zeitverlust darstellen.
Schritt 5: Einen Deal-Desk für alles einsetzen, was hakt
Wenn ein Deal stagniert -- fehlende Genehmigungen, Preisausnahmen, Umfangsfragen -- sollte das sofort eine Eskalation zu einem Deal-Desk oder einer Manager-Prüfung auslösen. Die meisten Mitarbeiter sitzen auf einem stagnierten Deal und hoffen, er löst sich von selbst. Das tut er selten. Ein Deal-Desk mit klaren Eskalationskriterien (mehr als X Tage in irgendeiner Phase stagniert) deckt Probleme auf, solange sie noch lösbar sind.
Für detailliertere Taktiken zu jedem dieser Hebel geht der Leitfaden zur Verkaufszyklus-Verkürzung tief in die Ausführung.
Verkaufszyklus-Länge vs. Vertriebsgeschwindigkeit vs. Zeit bis zur ersten Antwort
Diese drei Kennzahlen werden oft verwechselt. Sie messen unterschiedliche Dinge und informieren unterschiedliche Entscheidungen.
| Kennzahl | Formel | Was sie zeigt |
|---|---|---|
| Verkaufszyklus-Länge | Summe der Zyklusdauer / erfolgreich abgeschlossene Deals | Wie lange es dauert, eine qualifizierte Opportunity in Umsatz zu wandeln |
| Vertriebsgeschwindigkeit | (Deals x win rate x ACV) / Zykluslänge | Wie schnell Ihre Pipeline Umsatz generiert (kombiniert Dealvolumen, -wert und -geschwindigkeit) |
| Zeit bis zur ersten Antwort | Durchschnittliche Zeit vom Inbound-Lead bis zum ersten Kontakt durch einen Mitarbeiter | Wie schnell der Vertrieb neue Leads kontaktiert -- beeinflusst Show-Rate und anfängliche Konversionsrate |
Die Verkaufszyklus-Länge fließt direkt in die Vertriebsgeschwindigkeits-Formel ein. Wenn Sie die Pipeline-Geschwindigkeit verbessern möchten, können Sie das durch eine Erhöhung der Dealanzahl, eine Verbesserung der win rate, eine Erhöhung des ACV oder eine Verkürzung der Zykluslänge tun. Die Zykluslänge ist oft der am besten kontrollierbare Hebel.
Die Zeit bis zur ersten Antwort, verfolgt in der Lead-Response-Time-Analyse, beeinflusst die Zykluslänge indirekt -- schnelle Reaktion erzeugt frühen Schwung, der tendenziell den Gesamtzeitrahmen komprimiert.
Verkaufszyklus-Beispiele nach Branche
Der Branchenkontext zählt. Ein 60-Tage-Zyklus, der im SaaS-SMB-Bereich langsam wirkt, ist im öffentlichen Sektor schnell. Verwenden Sie diese Tabelle zur groben Einordnung, nicht als präzises Benchmarking.
| Branche | Typische Länge | Wesentliche Einschränkung |
|---|---|---|
| SaaS SMB | 14 bis 45 Tage | Fürsprecher-Autorität, Konversion von Produkttests |
| SaaS Enterprise | 90 bis 180 Tage | Multi-Stakeholder-Konsens, Sicherheitsüberprüfung |
| Fertigung | 60 bis 120 Tage | Technische Evaluation, Beschaffungsablauf |
| Öffentlicher Sektor / Behörden | 6 bis 18 Monate | RFP-Prozess, Budgetzuteilungszyklen |
| Finanzdienstleistungen | 90 bis 180 Tage | Compliance-Prüfung, Lieferantenrisikomanagement |
Deals im öffentlichen Sektor sind eine Kategorie für sich. Der RFP-Prozess allein kann länger dauern als ein gesamter SMB-Deal. Revenue-Teams, die an Behörden verkaufen, verwalten diese Opportunities typischerweise als separate Vertriebsbewegung mit separaten Zyklusmetriken.
Häufige Messfehler
Die richtige Vorgehensweise beim Benchmarking ist genauso wichtig wie der Benchmark selbst. Das sind die häufigsten Fehler:
- Nur-Pipeline-Deals einbeziehen. Wenn ein Deal nie ein abgeschlossenes Ergebnis erreicht hat, verfälscht seine Einbeziehung die Kennzahl. Abschluss-Zyklen und Verlust-Zyklen sollten separat verfolgt werden.
- Die Uhr beim MQL starten. Marketing-Attribution und Vertriebszyklus-Attribution sind unterschiedliche Messungen. Beides zu vermischen macht beides schlechter.
- Verlust-Deal-Zykluszeit ignorieren. Ihre verlorenen Deals haben oft längere Zyklen als Ihre Gewinne -- Deals, die sich hinziehen und dann enden, zeigen genau, wo Ihre Pipeline stagniert. Das separate Verfolgen der Verlust-Zykluszeit deckt phasenspezifische Engpässe auf.
- Einen einzigen Durchschnitt über Segmente verwenden. Ein kombinierter Durchschnitt für SMB und Enterprise ist nahezu bedeutungslos. Segmentieren Sie Ihre Messung von Anfang an nach Deal-Größe, Branche oder Kundentyp.
- Nur jährlich neu berechnen. Die Zykluslänge kann von Quartal zu Quartal schwanken, wenn sich Ihr ICP verändert, Ihr Team skaliert oder sich die Beschaffungsabläufe Ihrer Käufer ändern. Prüfen Sie sie quartalsweise.
Für einen umfassenderen Blick auf Messintegrität decken Pipeline-Metriken-Übersicht und Konversionsraten-Analyse benachbarte Messpfade ab.
Best Practices
- Definieren Sie "Beginn des Zyklus" einmalig, schriftlich, und setzen Sie es in Ihrer CRM-Einrichtung durch. Konsistenz schlägt Präzision.
- Segmentieren Sie Ihren Benchmark von Tag eins nach ACV-Band. Gemischte Durchschnitte verbergen das Signal.
- Verfolgen Sie die mediane Zykluslänge als Ihre primäre KPI. Nutzen Sie das arithmetische Mittel nur für Abdeckungsverhältnis-Berechnungen.
- Prüfen Sie Zykluslängen-Trends auf Phasenebene, nicht nur End-to-End. Ein Deal, der in Phase 3 stagniert, hat eine andere Lösung als einer, der in Phase 4 stagniert.
- Verknüpfen Sie Zykluslängen-Daten mit Pipeline-Phasen-Design-Reviews. Wenn eine Phase die Zykluslänge konsequent verlängert, ist diese Phase möglicherweise nicht mit dem Käuferverhalten abgestimmt.
- Setzen Sie eine "Deal-Aging"-Warnung bei 1,5-facher Ihrer medianen Zykluslänge. Deals jenseits dieses Schwellenwerts benötigen aktives Eingreifen, nicht passive Beobachtung.
- Optimieren Sie die Zykluslänge nicht isoliert. Überwachen Sie immer die win rate daneben. Wenn die Zykluslänge um 20 % sinkt und die win rate um 15 % fällt, gewinnen Sie nicht -- Sie hetzen Deals in ein schnelles Nein.
- Prüfen Sie die Ausrichtung der Forecast-Kategorien quartalsweise. Genaue forecast-Einschätzungen hängen von realistischen Zykluslängen-Erwartungen pro Phase ab.
Häufig gestellte Fragen
Was ist der Unterschied zwischen Verkaufszyklus und Vertriebsprozess? Der Vertriebsprozess ist die Abfolge von Schritten, die Ihr Team befolgt, um einen Deal voranzubringen -- Discovery, Demo, Angebot, Verhandlung. Die Verkaufszyklus-Länge ist die Dauer dieses Prozesses, gemessen in Tagen. Ein gut gestalteter Vertriebsprozess ist ein Faktor für einen kürzeren Zyklus. Aber Sie können einen ausgezeichneten Prozess und einen langen Zyklus haben, wenn Käufer langsam sind, Deals komplex sind oder die Qualifizierung schwach ist.
Sollte ich das arithmetische Mittel oder den Median zur Verfolgung der Verkaufszyklus-Länge verwenden? Verwenden Sie den Median für Ihre primäre Management-Kennzahl. Der Median ist resistent gegenüber Ausreißern -- ein 9-monatiger strategischer Deal wird Ihren SMB-Benchmark nicht verzerren. Nutzen Sie das arithmetische Mittel bei der Berechnung des Pipeline-Abdeckungsbedarfs, da Abdeckungs-Mathematik additiv ist und die tatsächliche Durchschnittszeit bis zum Abschluss pro Dollar benötigt.
Ist ein kürzerer Verkaufszyklus immer besser? Nein. Die richtige Zykluslänge ist die kürzeste, die die win rate oder Kundenqualität nicht beeinträchtigt. Wenn Sie die Zykluslänge um 30 % kürzen und die win rate um 20 % fällt, bewegen Sie sich in die falsche Richtung. Die Zykluslänge ohne gleichzeitige Verfolgung der win rate zu optimieren ist, wie Teams versehentlich Mitarbeiter dafür belohnen, einfaches Geschäft abzuschließen und schwieriges zu verlieren.
Wie oft sollten wir unseren Verkaufszyklus-Benchmark neu berechnen? Mindestens quartalsweise. Die Verkaufszyklus-Länge verschiebt sich, wenn sich Ihr ICP ändert, Ihr Team ein neues Segment hinzufügt, Ihre Produktkomplexität sich verändert oder sich die Beschaffungsabläufe Ihrer Käufer wandeln. Jährliche Neuberechnung bedeutet, bis zu 11 Monate lang Prognoseentscheidungen mit veralteten Daten zu treffen.
Sagt die Zykluslänge die win rate voraus? Schwach und richtungsweisend: Deals, die innerhalb eines bestimmten Segments schneller abschließen, haben tendenziell höhere win rates, weil schnelle Abschlüsse oft stärkeres Fürsprecher-Engagement und bessere ICP-Übereinstimmung signalisieren. Aber die Zykluslänge allein ist kein zuverlässiger win-rate-Prädiktor. Ein Deal, der doppelt so lang dauert wie Ihr Median, könnte Ihr größter strategischer Gewinn des Jahres sein. Nutzen Sie Pipeline-vs.-forecast-Ansichten, um altersbasierte Risikosignale von legitimen Langzyklus-Opportunities zu trennen.
Die Verkaufszyklus-Länge ist in einem Sinne ein nachlaufender Indikator -- sie aktualisiert sich nur, wenn Deals abgeschlossen werden. Aber die Muster, die sie offenbart, sind vorlaufend: wo Deals stagnieren, welche Segmente schnell abschließen, welche Mitarbeiter effiziente Prozesse führen. Behandeln Sie sie als Diagnosewerkzeug, nicht nur als Schlagzeilen-Kennzahl.
Messen Sie sie konsistent, segmentieren Sie sie richtig und verbinden Sie jeden Verkürzungsaufwand mit der win-rate-Überwachung. So wird ein kürzerer Zyklus zu einem echten Umsatzmultiplikator und nicht nur zu einem Coaching-Diskussionspunkt.

Senior Operations & Growth Strategist
On this page
- Was ist die Verkaufszyklus-Länge?
- Wie man die Verkaufszyklus-Länge berechnet
- Arithmetisches Mittel vs. Median: Welchen Wert verwenden?
- Was man ausschließen sollte
- Verkaufszyklus-Benchmarks nach Segment
- Warum Verkaufszyklen lang werden
- Wie man den Verkaufszyklus verkürzt
- Schritt 1: Ihren ICP schärfen
- Schritt 2: Multi-Threading vom ersten Meeting an
- Schritt 3: Am Ende von Phase 2 einen gegenseitigen Abschlussplan erstellen
- Schritt 4: Rechtliche und Sicherheitsprozesse parallel führen
- Schritt 5: Einen Deal-Desk für alles einsetzen, was hakt
- Verkaufszyklus-Länge vs. Vertriebsgeschwindigkeit vs. Zeit bis zur ersten Antwort
- Verkaufszyklus-Beispiele nach Branche
- Häufige Messfehler
- Best Practices
- Häufig gestellte Fragen