What are KPIs? Stop Drowning in Data, Start Making Decisions
Turn this article into takeaways for your work.
Each assistant summarizes the article only for you and suggests best practices for your work.
"We track 147 different metrics," the CEO proudly announced. When I asked which three mattered most, he couldn't answer. Two quarters later, the company missed every important target while celebrating vanity metrics.
This is the KPI paradox: More data, worse decisions.
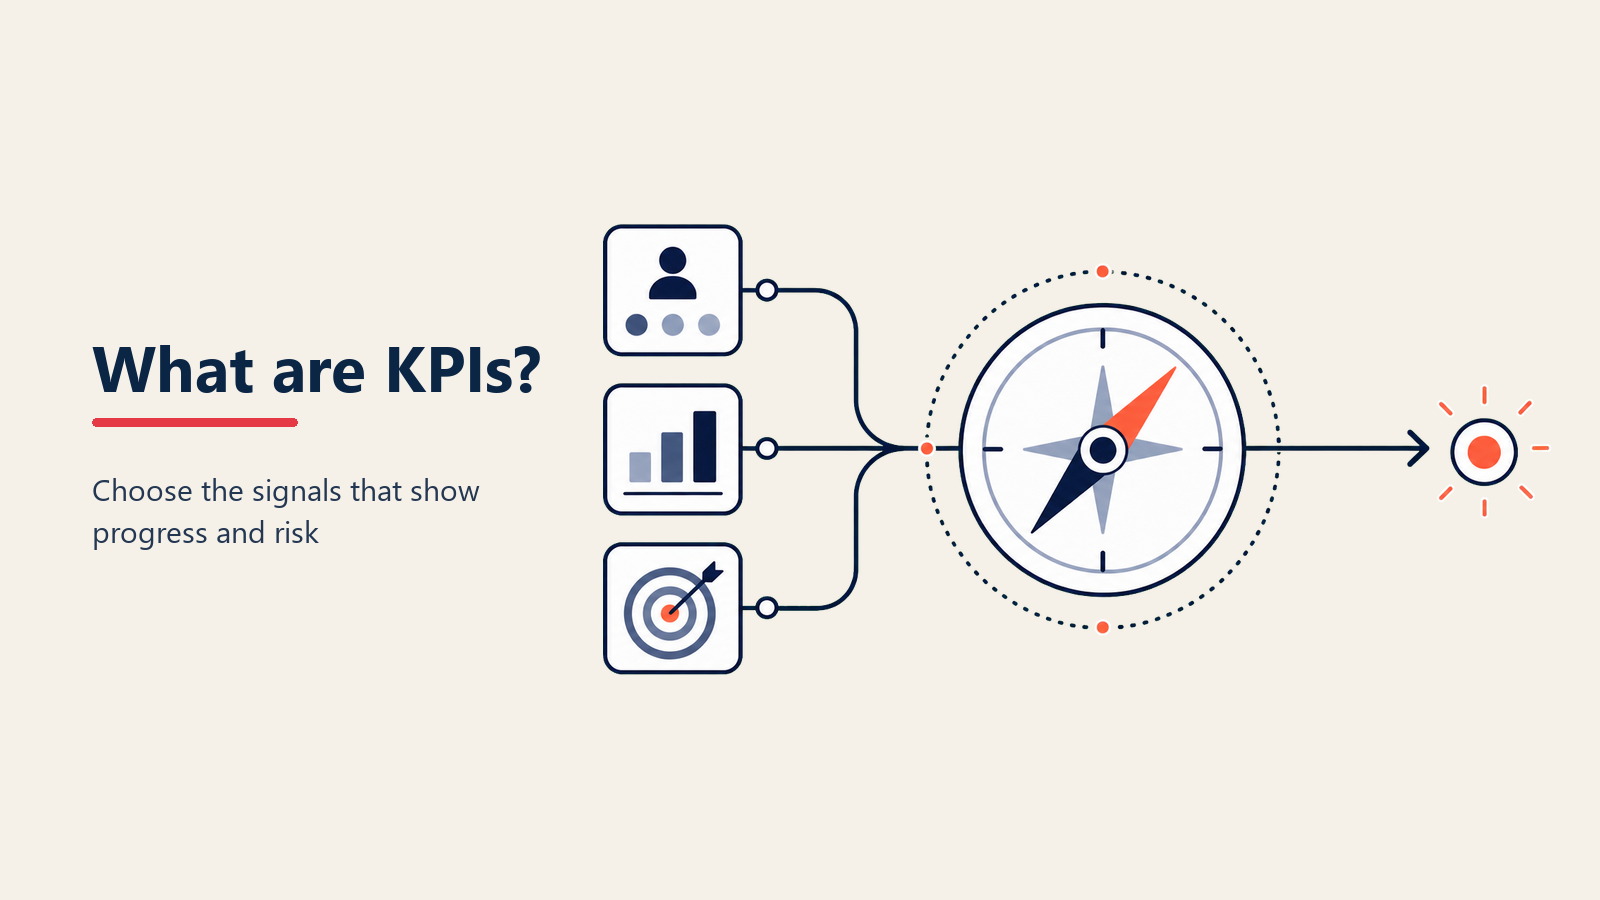
KPIs: Your Business GPS
Key Performance Indicators (KPIs) are measurable values that show if you're achieving critical business objectives.
Think of them as your business vital signs:
- Heart rate = Revenue growth
- Blood pressure = Cash flow
- Temperature = Customer satisfaction
- Oxygen level = Employee engagement
Track the wrong vitals, make the wrong diagnosis, prescribe the wrong cure.
The 5-7-15 Rule
After analyzing hundreds of companies, here's what works:
5 Company KPIs: What the CEO watches daily 7 Department KPIs: What each director owns 15 Individual KPIs: Maximum per employee
Total: ~50 KPIs for the entire company. Not 147. Not 500. Around 50.
North Star Metrics by Business Model
Every business needs one North Star—the single metric that best captures core value:
SaaS: Monthly Recurring Revenue (MRR) E-commerce: Gross Merchandise Value (GMV) Marketplace: Gross Transaction Value (GTV) Media: Daily Active Users (DAU) Subscription Box: Subscriber Retention Rate Agency: Revenue per Employee Manufacturing: Overall Equipment Effectiveness (OEE)
Your North Star aligns everyone. Everything else supports it.
The KPI Hierarchy That Works
Level 1: Company KPIs (The Big 5)
- Revenue Growth (or MRR/ARR for SaaS)
- Gross Margin (or Unit Economics)
- Cash Flow (or Burn Rate if pre-profit)
- Customer Satisfaction (NPS or Retention)
- Team Health (Engagement or Turnover)
Level 2: Department KPIs
Sales:
- Pipeline velocity
- Win rate
- Average deal size
- Sales cycle length
- Quota attainment
Marketing:
- CAC by channel
- Lead quality score
- Marketing ROI
- Brand awareness
- Content engagement
Operations:
- On-time delivery
- Cost per unit
- Inventory turnover
- Quality score
- Capacity utilization
Customer Success:
- Churn rate
- Expansion revenue
- Support ticket resolution
- Time to value
- Health score
Level 3: Individual KPIs
Specific to role, tied to department KPIs, updated weekly.
Leading vs Lagging: The Fortune Teller's Secret
Lagging indicators tell you what happened:
- Revenue (last month)
- Churn (customers who left)
- Profit (end of quarter)
Leading indicators predict what will happen:
- Pipeline (future revenue)
- Engagement score (future churn)
- Operating margin trend (future profit)
Rule: 70% leading, 30% lagging. Most companies do the opposite.
Real KPIs vs Vanity Metrics
Vanity Metrics (Feel Good, Mean Nothing)
- Total registered users (vs active users)
- Revenue (vs profitable revenue)
- Website traffic (vs conversions)
- Social media followers (vs engagement)
- Gross sales (vs net margin)
Real KPIs (Sometimes Painful, Always Useful)
- Weekly active users
- Contribution margin
- Conversion rate
- Engagement rate
- Net revenue retention
Test: If the metric going up doesn't directly improve the business, it's vanity.
The Amazon KPI Evolution
Watch how their KPIs evolved with strategy:
1995-2000: Growth Phase
- Unique visitors
- Conversion rate
- Repeat purchase rate
2000-2010: Scale Phase
- Fulfillment cost per unit
- Inventory turns
- Prime member growth
2010-2020: Domination Phase
- Same-day delivery percentage
- AWS revenue growth
- Advertising revenue
2020+: Optimization Phase
- Carbon footprint per package
- Employee safety score
- Automation percentage
Lesson: KPIs must evolve or they become irrelevant.
Your KPI Selection Framework
For each potential KPI, ask:
Is it SMART?
- Specific (not vague)
- Measurable (has a number)
- Achievable (possible to hit)
- Relevant (matters to success)
- Time-bound (has a deadline)
Does it drive behavior?
- Clear action if it's red
- Celebration if it's green
- Someone owns it
Is it simple?
- Explained in one sentence
- Calculated without a PhD
- Updated automatically
If any answer is no, it's not a KPI.
Common KPI Mistakes
Mistake 1: The Kitchen Sink
Tracking everything because you can. Result: Analysis paralysis.
Mistake 2: Set and Forget
Creating KPIs then never reviewing. Result: Driving using the rearview mirror.
Mistake 3: No Owner
"We all own customer satisfaction." Result: No one owns it.
Mistake 4: Gaming the System
Sales hits target by giving massive discounts. Result: Margin destruction.
Mistake 5: One-Size-Fits-All
Using same KPIs for startup and enterprise. Result: Wrong medicine.
Building Your KPI Dashboard
Daily Dashboard (5 metrics max)
- Cash position
- Sales pipeline
- Critical operational metric
- Customer health indicator
- Team capacity
Weekly Review (Department KPIs)
- Trend analysis
- Red/yellow/green status
- Owner updates
- Corrective actions
Monthly Strategic (All KPIs)
- Full review
- Correlation analysis
- KPI effectiveness
- Adjustments needed
Tools That Work
- Simple: Google Sheets + Zapier
- Growing: Databox, Geckoboard, Klipfolio
- Advanced: Tableau, Looker, PowerBI
The OKR Connection
KPIs measure ongoing health. OKRs drive specific improvements.
Example:
- KPI: Customer churn rate (always tracked)
- OKR: Reduce churn from 5% to 3% in Q3 (specific initiative)
Think of KPIs as your speedometer (always there) and OKRs as your destination (specific journey).
Your 30-Day KPI Transformation
Week 1: Audit
- List all current metrics
- Identify who uses what
- Find redundancies
- Spot gaps
Week 2: Design
- Select 5 company KPIs
- Define department KPIs
- Assign owners
- Set targets
Week 3: Build
- Create dashboards
- Automate data feeds
- Train teams
- Test accuracy
Week 4: Launch
- Daily standup integration
- Weekly review rhythm
- Monthly strategic review
- Quarterly KPI assessment
The Ultimate KPI Test
Ask your team right now: "What are our top 5 KPIs and how are we doing?"
If they can't answer immediately, your KPIs aren't working.
Great KPIs become part of daily language:
- "What's our NPS this week?"
- "How's pipeline looking?"
- "Where's burn rate at?"
When KPIs enter casual conversation, you've won.
Your Next Move
Stop tracking everything. Start tracking what matters.
This week:
- List your current top 5 metrics
- Ask: "If I could only know 5 things about my business, what would they be?"
- Compare the lists
- Fix the gap
Remember: The goal isn't perfect KPIs. It's better decisions. Start simple, iterate quickly, and let KPIs guide you to growth.
Want to implement KPIs effectively? Learn about OKRs for goal-setting, or dive into Business Intelligence for the analytics layer that makes KPI tracking reliable and automated.
Part of the [Business Terms Collection]. Last updated: 2026-07-21
On this page
- KPIs: Your Business GPS
- The 5-7-15 Rule
- North Star Metrics by Business Model
- The KPI Hierarchy That Works
- Level 1: Company KPIs (The Big 5)
- Level 2: Department KPIs
- Level 3: Individual KPIs
- Leading vs Lagging: The Fortune Teller's Secret
- Real KPIs vs Vanity Metrics
- Vanity Metrics (Feel Good, Mean Nothing)
- Real KPIs (Sometimes Painful, Always Useful)
- The Amazon KPI Evolution
- Your KPI Selection Framework
- Common KPI Mistakes
- Mistake 1: The Kitchen Sink
- Mistake 2: Set and Forget
- Mistake 3: No Owner
- Mistake 4: Gaming the System
- Mistake 5: One-Size-Fits-All
- Building Your KPI Dashboard
- Daily Dashboard (5 metrics max)
- Weekly Review (Department KPIs)
- Monthly Strategic (All KPIs)
- Tools That Work
- The OKR Connection
- Your 30-Day KPI Transformation
- The Ultimate KPI Test
- Your Next Move