Process Management
Process modelling made simple with flowcharts: A 5-minute guideline

You’ve got your best intentions in the Design stage. Before heading to Execution, you need a bridge where everyone can stand on. That bridge is this Modeling stage.
The purpose and output of the Model stage
The Model stage brings structure to the ideas you’ve developed during the Design phase. At this point, the goal is to visualize how a process will function in practice, detailing every step, decision point, and handoff, but this time not just in the ideal scenario, but with all the variations that might occur.
A well-built process model offers you two key benefits: it brings clarity and builds confidence. By simulating how work flows under different conditions – whether things go smoothly or hit obstacles – you can begin to understand how the process performs in real-world situations.
Just as important, the model becomes a shared tool across your organization. A diagram often communicates faster and more clearly than a long procedure manual. By using a model, you bring together managers, frontline teams, and IT around a common understanding of how the process should work.
What you end up with is a visual map of your process, which can be either in classic, simple format as a flowchart, or a more standard one like BPMN, that’s ready for review, automation, or training. It’s a foundation you can build on with confidence.
Common process modeling techniques
Flowcharts
This is the classic go-to for visualizing any repeatable process. Flowcharts use a few simple symbols like rectangles, diamonds, and ovals, then connect them with arrows to show the sequence. They’re quick to sketch and great for small businesses to get started, or just getting the first version of a process down on paper.
Flowcharts are often combined with another format called swimlanes, when we divide the flow into horizontal or vertical "lanes” to add structure to the process visualization. Each lane represents a role or team, helping everyone see where their responsibilities begin and end. It’s particularly helpful for spotting bottlenecks or excessive handoffs between teams.
BPMN (Business Process Model and Notation)
BPMN is the most powerful and widely accepted modeling standard in the BPM world. It’s designed to be detailed enough for technical implementation yet readable for business users.
BPMN lets you capture not just tasks and decisions, but also exception paths, parallel flows, messages between systems, and time-based events. While it has more symbols and rules than a basic flowchart, its precision makes it ideal for scalable, automated workflows.
Other methods (UML, EPC)
You might also encounter UML Activity Diagrams or Event-Driven Process Chains in certain industries. These are more specialized or software-centric but can be useful in specific contexts like system modeling or ERP environments.
Basic process modeling: How to draw and read a flowchart
Basic symbols
To ensure that everyone, regardless of language or location, can consistently understand a flowchart, the American National Standards Institute (ANSI) introduced a set of standards for drawing flowcharts in the 1960s. The International Standardization Organization (ISO) officially updated and issued these standards globally in 1970. It is crucial to follow these standards when drawing and interpreting a flowchart.
There are dozens of symbols representing different conditions of a process. However, for the simplicity of processes in small and medium-sized businesses, you mainly need to focus on the most common symbols.
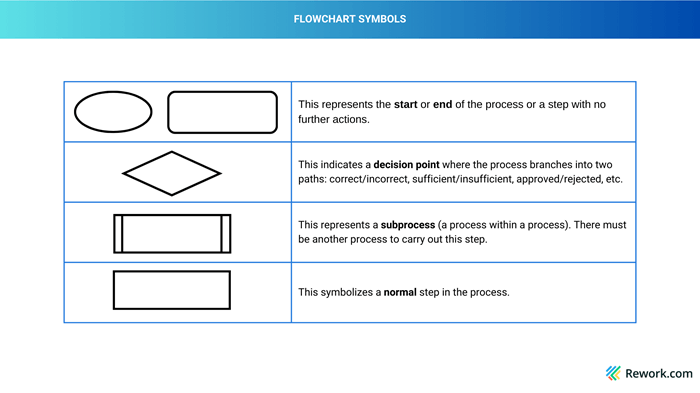 [textcenter]Rules and symbols in flowchart[/textcenter]
How to read and interpret flowcharts – Key rules
When reading or drawing a flowchart, you must follow these rules:
- Represent the process flow from left to right, top to bottom.
- Draw the return arrows from the bottom for return steps to avoid overlapping lines.
- Maintain consistent spacing and alignment between steps.
- Follow standard symbols (e.g., rectangles for regular steps, diamonds for decision points, ellipses for start/end points) and ensure consistency in design (uniform design, colors, etc.). Colors can highlight important components, but they should not compromise the flowchart's readability or consistency.
One final tip for drawing flowcharts is to keep them confined to one page. We recommend breaking complex processes into smaller flowcharts to make them easier to track and manage.
To draw the flowcharts
The most important requirement is that you’ve got to have the Design stage outputs ready. That means defining the SIPOC (if you know what that means from the previous articles), as well as the process owners, stage owners, and stage workers.
With that in hand, it’s time to categorize steps using the appropriate symbols. Remember the standards mentioned earlier to ensure you comply with process rules.
Now that all the preparations are complete, you can create your first draft of the flowchart. This can be done manually with pen and paper, or you can use specialized flowchart applications to make the process even easier.
Some tools to help you draw flowcharts easily: Lucidchart, Miro, Whimsical, Canva…
Examples of flowcharts
Here are examples of 2 common process flowcharts found in most businesses to help you better understand how to present one.
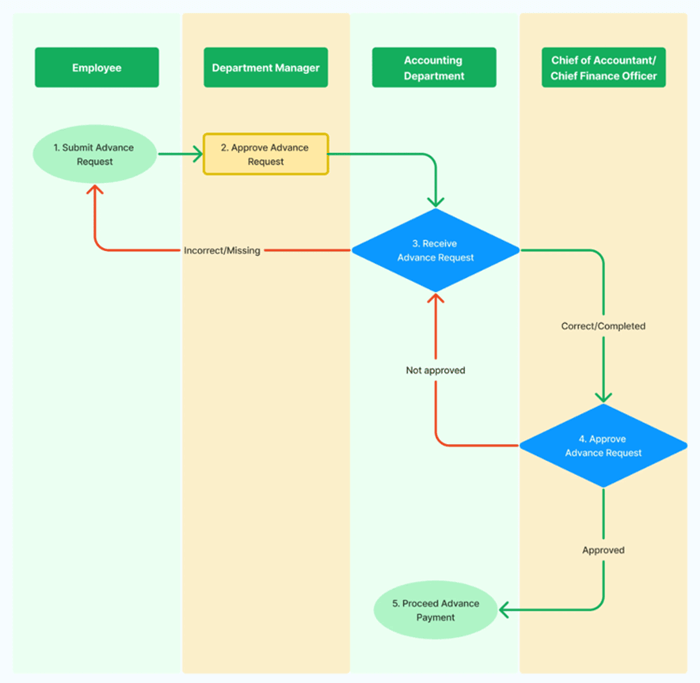
Advance payment process flowchart
The employee advance payment process involves providing employees with funds before their official payday. It typically starts with an employee request, which is reviewed and approved by the relevant department, such as HR or finance. Proper documentation, approval workflows, and tracking ensure compliance, maintaining financial transparency within the organization.
This process is illustrated through the following flowchart:
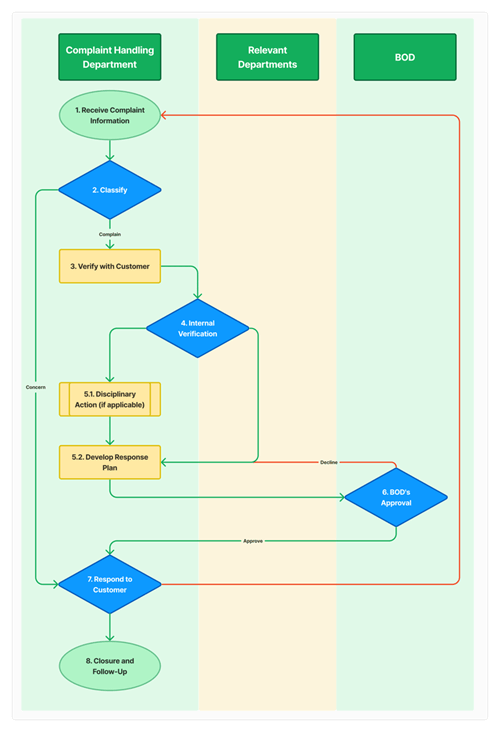
Complaint handling process flowchart
The complaint-handling process is essential for any service-based company's customer service or support departments. In this process, the business must meet its service level agreement (SLA) commitments by responding to customers within an acceptable time frame and ensuring that service provider errors don’t disrupt customer operations.
This process is illustrated through the following flowchart:
Advanced process modeling: BPMN
BPMN (Business Process Model and Notation) is a standardized method for drawing business processes. It looks similar to a flowchart but offers more structure and detail, especially when your process spans across teams, systems, or needs to handle multiple scenarios like approvals, rejections, or exceptions.
How is BPMN different from flowcharts?
Flowcharts already go a long way. When paired with swimlanes, they can:
- Show who’s responsible for each step.
- Visualize if/else decisions with clear branches.
- Clarify how work flows from start to finish.
For most small businesses, this is often all you need.
BPMN builds on that with more precision and flexibility:
- It distinguishes between types of decisions (e.g., exclusive vs. parallel approvals).
- It can model events like timeouts, cancellations, or external messages.
- It shows interactions between departments or external partners using special message flows.
- It follows strict rules, making it easier to scale, simulate, or even automate the process later.
Let’s take an example of a customer order fulfillment in an e-commerce company. The overview of the process is as follows:
Start → Receive Online Order → Check Stock Availability →
- If In Stock: Proceed to Pack & Ship → Notify Customer → Send Invoice → End
- If Out of Stock: Notify Customer → Wait for Confirmation (Cancel or Backorder) → Update Order → Continue or End
Now add some real-life complexity:
Different types of decisions (Gateways)
- Exclusive Gateway: Is stock available? (Yes or No – one path proceeds)
- Event-Based Gateway: Wait for customer response (Cancel or Confirm Backorder)
- Parallel Gateway: Pack and send invoice at the same time after shipping
These decisions can’t be clearly defined in a simple diamond shape. They need explicit logic, which BPMN provides.
Events
- Message Start Event: Triggered when a customer places an order online.
- Timer Intermediate Event: If no customer reply is received within 48 hours, cancel the order automatically.
- Error Event: If payment fails after shipping, send alert to finance for manual follow-up.
These kinds of events (message, timer, error) define how the process responds to real-world conditions and delays, which flowcharts don’t handle.
Exception handling and Reuse
If an order is canceled, notify the warehouse and mark the inventory for restocking.
If a customer places a second order within 24 hours, reuse their shipping data (a reusable subprocess).
BPMN supports exception flows and nested subprocesses without cluttering the main diagram.
When should you use BPMN?
With more rules and symbols embedded, BPMN are more flexible to express complex process systems. They are also widely accepted by process improvement experts, business analysts, regulated and compliance-heavy industries like healthcare, financial services or insurance.
However, the simplicity of flowcharts still has its wins. If your team is still small and just needs clarity, feel free to stick to flowcharts. If you feel your process is too complex to fit into a single flowchart, try breaking it down to smaller subprocesses which connect with each other based on certain conditions.
In the end, one of the main purpose of this modeling stage is to communicate the process clearly among the team. A complex model like BPMN may lead you to even more confusion and less consistency. That’s why we need a dedicated Execute stage in the BPM lifecycle, where we will discuss how these modeled processes can be enforced and adhered to. But before that, let’s learn how to officialize the processes with Process Documentation.

Camellia
Content Strategist
On this page
- The purpose and output of the Model stage
- Common process modeling techniques
- Flowcharts
- BPMN (Business Process Model and Notation)
- Other methods (UML, EPC)
- Basic process modeling: How to draw and read a flowchart
- Basic symbols
- How to read and interpret flowcharts – Key rules
- To draw the flowcharts
- Examples of flowcharts
- Advanced process modeling: BPMN
- How is BPMN different from flowcharts?
- When should you use BPMN?