Crafting a Successful Research Proposal with Gantt Charts
Crafting a successful research proposal demands careful planning. However, managing intricate projects with numerous tasks and deadlines can be challenging.
This is where the Gantt charts come into play. These powerful project management techniques offer a visual roadmap for your research proposal, transforming your intricate plan into a clear and concise document. By incorporating a Gantt chart, you not only streamline the planning process for yourself but also strengthen your proposal by demonstrating a meticulously structured and achievable project.
Let's explore the power of the Gantt chart for crafting robust research proposals and a step-by-step guide on how to create one.
Understanding Gantt Charts and their Application in Research Proposals
Gantt charts, developed by Henry Gantt, an American engineer and project management consultant, are powerful visual tools for project management. They represent project tasks as horizontal bars on a timeline, showing their duration and dependencies. This simple format provides a comprehensive overview of your research proposal development process.
In research proposals, Gantt charts are invaluable because they:
Visualize the Project Lifecycle: Understand the sequential steps involved, from literature review to data analysis and final edits.
Manage Task Dependencies: Identify tasks reliant on others' completion (e.g., data collection after finalizing research methodology).
Optimize Resource Allocation: Allocate essential resources, like software or equipment, to specific tasks within the timeline.
Crafting a Gantt Chart with Rework
Now that you understand the core functionality of Gantt charts, let's explore how to create one specifically for your research proposal. Here, we'll leverage the features of Rework.com, a comprehensive project management platform that streamlines the process.
Rework transcends the limitations of basic Gantt charts, offering functionalities that empower a more streamlined research proposal creation process. Here's how it empowers you:
Seamless Integration: Rework seamlessly integrates task management, workflow design, and progress tracking – all crucial aspects of building a strong research proposal.
Intuitive Interface: No technical expertise is required! Rework's user-friendly interface allows you to create and customize Gantt charts effortlessly.
Real-Time Collaboration: Facilitate effective teamwork and communication among your research team directly within the platform.
Streamlined Workflows: Design clear and concise workflows for each research stage, outlining tasks, deadlines, and responsible team members.
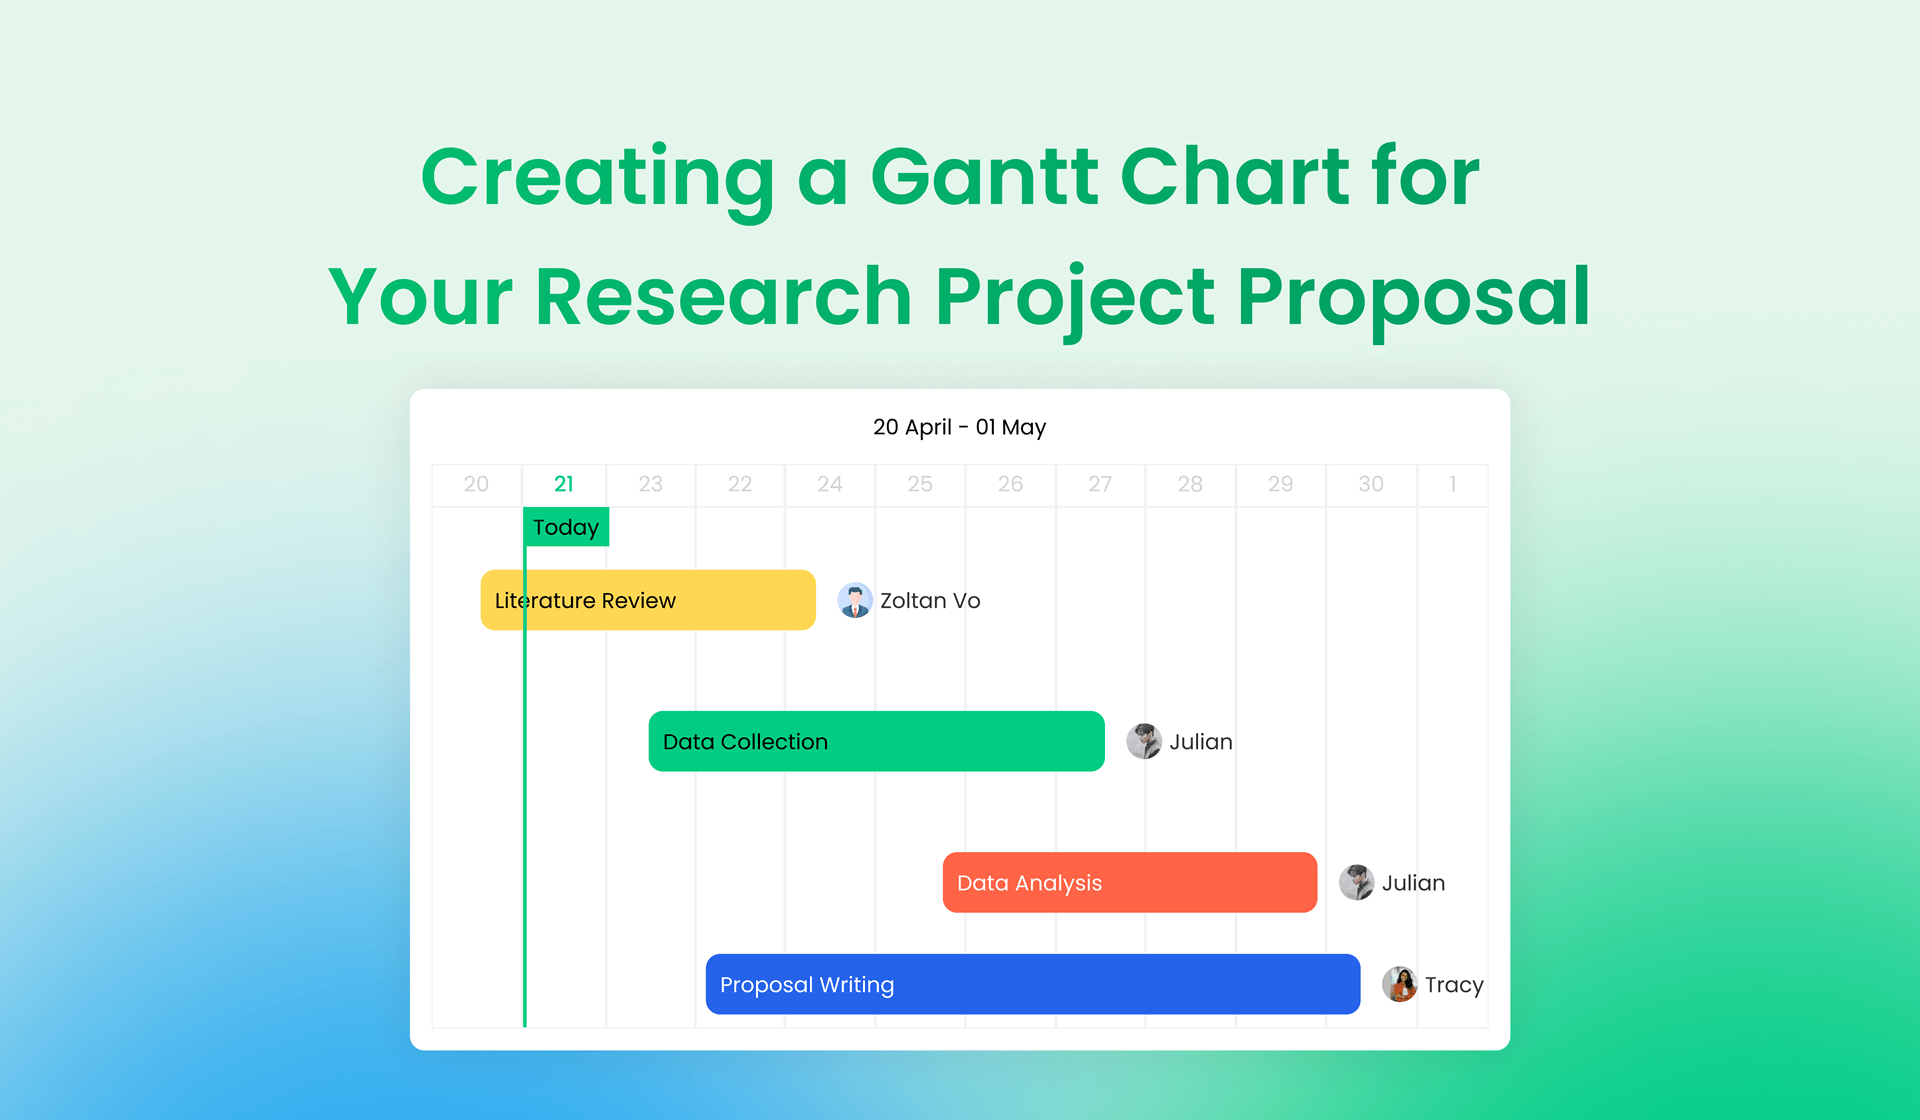
To showcase the power of Rework, let's take a brief look at what a research proposal Gantt chart might look like on the platform.
Each stage would then be broken down into specific tasks, with clear deadlines and assigned team members.
This level of organization and transparency not only strengthens your proposal but also paves the way for a smooth and efficient research journey.
Step-by-Step Guide: Constructing Your Research Proposal Gantt Chart
Having grasped the power of Gantt charts and the functionalities offered by Rework.com, let's embark on the exciting journey of building your research proposal Gantt chart! Here's a step-by-step guide to navigate the process:
1. Define Your Research Goals
This initial step lays the foundation for your entire project. Clearly outline your research topic, objectives, and desired outcomes. Having a well-defined objective will guide you in structuring the subsequent stages.
2. Break Down the Project into Stages
Identify the key stages involved in completing your research, such as literature review, data collection, data analysis, and proposal writing.
3. List Tasks Within Each Stage
Now, delve deeper into each research stage and meticulously list all the specific tasks that need to be completed. For instance, the "literature review" stage might involve tasks like identifying relevant academic databases, searching for articles, and summarizing key findings.
4. Estimate Task Durations
Allocate estimated timeframes for completing each individual task within your research stages. Consider factors like the complexity of the task and the resources available.
5. Identify Task Dependencies
Analyze the sequence of your tasks and pinpoint any dependencies. Remember the data analysis example? It can't begin until the data collection stage is complete. Mapping these dependencies in your Gantt chart ensures a smooth and logical workflow.
6. Utilize Rework's Features
Leverage the user-friendly interface of Rework to effortlessly create your Gantt chart. Input your research stages, tasks, and estimated durations. Rework will translate this information into a clear visual representation of your project timeline.
7. Assign Team Members
If you're working with a team, utilize Rework's functionalities to assign specific tasks to individual team members. This promotes accountability and ensures everyone is on the same page.
8. Track Progress & Make Adjustments
Monitor progress within Rework, identify any potential roadblocks that might arise, and be prepared to adjust your plan as needed. The flexibility of Rework allows you to adapt your Gantt chart to maintain optimal project flow.
By following these steps and utilizing Rework's capabilities, you'll craft a robust research proposal Gantt chart. This visual roadmap not only streamlines your research journey but also presents a structured plan to potential funders or reviewers, increasing your proposal's success rate.
Advanced Techniques for Optimizing Your Research Proposal Gantt Chart
To elevate your Gantt chart's effectiveness, consider these advanced strategies:
Conditional Formatting: Implement conditional formatting within your Rework Gantt chart. This functionality allows you to utilize color coding to visually distinguish completed tasks from those nearing deadlines or overdue.
Task Annotations: Move beyond simple task listings – enrich them with context for increased clarity and professionalism. Utilize Rework's functionalities to add detailed annotations directly within your Gantt chart for each task. These annotations can incorporate specific instructions, relevant resources, or crucial reminders for team members.
Rework Reporting: Rework extends beyond Gantt chart creation; it empowers you to analyze project progress with robust reporting tools. Generate comprehensive reports that offer valuable insights into task completion rates, resource allocation, and overall project health. By identifying areas needing improvement or potential roadblocks early on, you can proactively adjust your plan and optimize research execution.
Conclusion
Crafting a compelling research proposal is crucial, but it doesn't have to be overwhelming. With Rework's intuitive interface and powerful features, creating a professional Gantt chart tailored to your proposal is straightforward. By leveraging Gantt charts, you'll showcase a well-structured and achievable project, increasing your proposal's impact and securing funding. Ready to streamline your research journey? Start building your Gantt chart with Rework today!

Tara Minh
Operation Enthusiast
On this page
- Understanding Gantt Charts and their Application in Research Proposals
- Crafting a Gantt Chart with Rework
- Step-by-Step Guide: Constructing Your Research Proposal Gantt Chart
- 1. Define Your Research Goals
- 2. Break Down the Project into Stages
- 3. List Tasks Within Each Stage
- 4. Estimate Task Durations
- 5. Identify Task Dependencies
- 6. Utilize Rework's Features
- 7. Assign Team Members
- 8. Track Progress & Make Adjustments
- Advanced Techniques for Optimizing Your Research Proposal Gantt Chart
- Conclusion